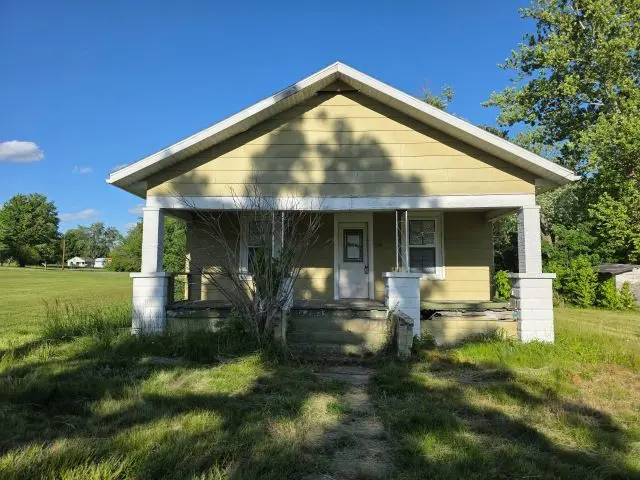
905 Mcclintock Ave · Johnston City, IL
Flood risk 1/10 · Minimal
- FEMA flood zone
- X (unshaded)
- Chance of flooding over 30 yrs
- 0.0%
- Est. flood insurance / yr
- $473 – $860
Fire risk 3/10 · Minor
- Est. fire insurance / yr
- $804 – $1,492
Heat risk 5/10 · Moderate
- Hot days now (above 107°F)
- 7 days/yr
- Hot days in 30 yrs
- 20 days/yr
Wind risk 2/10 · Minimal
- Chance of severe wind over 30 yrs
- 2.0%
Air-quality risk 2/10 · Minimal
- Unhealthy air days now
- 0 days/yr
- Unhealthy air days in 30 yrs
- 2 days/yr
Risk factors via First Street. Map © Google.
Why this score? — see what drove the B grade
The composite is a weighted blend of 9 inputs, each scored 0–100. Each bar is that input's sub-score; the figure is the points it added to the 100-point composite (weight × sub-score).
- Cash flow +30.0/30.0
- ARV discount +15.0/15.0
- 1% rule +10.0/10.0
- DSCR +10.0/10.0
- Livability +3.2/5.0
- Rent growth +2.5/5.0
- Condition / age +2.5/5.0
- Schools +1.1/10.0
- Appreciation +0.0/10.0
$49,000
🖨 Deal sheet 📄 Offer letter ✓ Due diligence
Listing remarks
House needs a lot of work. Extra lot and shed are included. House is currently not liveable. HVAC & water heater are located in basement and were submerged in water. No appliances whatsoever, are included. House and extra lot sits in an ACTIVE floodplain. Property is being sold in its "AS IS" condition. The Seller makes no representations or warranties whatsoever as to the structure, foundation, roof, plumbing, electrical or other condition of the house as this is a foreclosure. Sellers will be responsible for deed prep, any delinquent taxes and proration of taxes and possible BBC. HOUSE WILL NOT PASS FOR ANY GOVERNMENT LOANS OR VA LOANS. Seller does offer an REO Loan progra
Key facts
- 0.35 acre lot
- 2 parking spots
- Built 1908
Property features AI
Finance
- Other: Located in unincorporated Johnson City; Directions available: From Grand Avenue turn onto East Broadway Blvd, follow to East 9th St, turn North onto McClintock Ave.
- HOA & community: No master association fee required
Exterior
- Parking: Space for 2 vehicles
- Utilities: Public water; Public sewer
- Home design: Detached single-family home; One-story layout; Fee simple ownership; Property is over 100 years old; Facing / entry direction not specified
- Construction: Frame and fiber cement construction; Total finished + unfinished area approx. 2,652 total sq ft; Main finished area approx. 1,326; Unfinished basement approx. 1,326; Built before 1978
- Exterior features: Property in a flood zone; Lot dimensions approximately 113.5 x 135 ft
Interior
- Kitchen: Kitchen with eating area / table space (approx. 13 x 15)
- Bedrooms: Master bedroom on main level (12 x 12) with hardwood floors; Second bedroom on main level (12 x 14) with hardwood floors
- Flooring: Hardwood flooring in primary bedrooms; Laminate flooring in living, dining and family rooms; Other flooring in breakfast room, kitchen and laundry
- Bathrooms: One full bathroom
- Interior features: Seven total rooms; Full unfinished cellar basement
- Laundry & utility: Main-level laundry room (approx. 5 x 8)
Neighborhood map
What this means for you Summary
Snapshot
- This is a 2-bed/1.0-bath single-family listed at $49k.
Deal economics
- At list price, monthly cash flow is $508 ($6k/yr) — positive.
- The deal already cash-flows at list — no discount required.
- Meets the 1% rule at list price ($1k rent vs $49k).
- Recommended offer: $48k (3.0% below list) — sets the bar for market timing.
Location & tenants
- Location reads 64/100 on livability (#670 in IL) — a middle-class / working-renter tenant base. Strengths: cost of living A+, housing A+, crime B+; Watch: schools F, amenities F, commute F.
- Johnston City CUSD 1 (town): math 11% / reading 14% proficiency, ranked #556 of 620 in IL (top 90%) — low school quality limits family demand, transient renter base, plan for 1-2y turnover.
- Market conditions: 26 active listings in the ZIP; 130 units permitted in Williamson County in 2024 (5 in 5+ unit buildings).
Forward outlook
- Local home prices are declining (-3.0%/yr); year-one equity from $339 of loan paydown is wiped out by about $1k of value loss. Plan a longer hold.
- At projected returns (-3.0% appreciation + 3.0% rent growth), your $14k cash investment doubles in ~3 years — after that, you're playing with house money.
Negotiation context
- It's been on market 37 days — a 3% lower offer ($48k) is reasonable based on typical stale-listing flexibility.
- 2 sale attempts since 2y ago with the ask held roughly flat each time — persistent listings suggest the price (not the market) is what's stuck; bring a comps-based counter.
Risks & watch-outs
- Watch-outs: built in 1908 — expect roof / HVAC / electrical / plumbing capex.
- Climate carrying-cost: extreme-heat days projected 7→20/yr by 2055 (HVAC capex compounding) — expect insurance premiums to compound above CPI over the hold.
Questions for the listing agent
- It's been on market 37 days. Have you received any prior offers? Is the seller open to a 3% concession, seller financing, or rate buy-down credit?
- Built in 1908 — when were the roof, HVAC, electrical panel, plumbing, and water heater last replaced?
- Is there a deadline driving the sale (1031 exchange, divorce, estate, relocation)? That informs how much negotiation room exists.
- Schools are F-rated, which usually means shorter tenancies and higher turnover. Who's the typical renter profile here, and what's been the actual vacancy rate?
- What's the average days-on-market for RENTAL listings here right now (not sales)? A rising rental-DOM trend means longer vacancies and softer asking-rent achievability than the comps imply.
- What's the recent tenant-quality profile in this submarket — average credit score on applications, eviction rate, late-payment / NSF rate, and stable-employment percentage? A property-management company in the area should have these aggregated.
- How much new for-sale + rental construction is in the pipeline within 1–3 miles? Heavy new supply typically softens prices + rents 12–24 months out; constrained supply supports both.
Investment metrics
- 1% rule
- 2.22% ✓
- Cap rate
- 18.72%
- Cash-on-cash
- 44.40%
- DSCR
- 2.98
- GRM
- 3.7
CMA / ARV
- ARV (median comp)
- $87,065
- List price
- $49,000
- Delta
- -43.72%
- Verdict
- UNDERPRICED
- Comps
- 20 within 1.0 mi
Show comp detail 12 sales within ~0.75 mi
| Address | Dist | Beds/Ba | Sqft | Sold | Price | $/sf | Match |
|---|---|---|---|---|---|---|---|
| 1202 Hoffard Ave | 0.27mi | 2/2.0 | 1,300 (-2%) | 9mo | $142,500 | $110 | 72 |
| 1210 Peterson Ave | 0.28mi | 2/1.0 | 1,220 (-8%) | 9mo | $139,450 | $114 | 66 |
| 1006 Gent Ave | 0.32mi | 3/1.0 (+1) | 1,380 (+4%) | 10mo | $72,100 | $52 | 66 |
| 1005 Chestnut Ave | 0.23mi | 3/1.0 (+1) | 1,148 (-13%) | 16mo | $67,000 | $58 | 48 |
| 1409 N Monroe Ave | 0.69mi | 3/1.0 (+1) | 1,372 (+4%) | 13mo | $89,500 | $65 | 46 |
| 1010 Gent Ave | 0.32mi | 3/2.0 (+1) | 1,496 (+13%) | 16mo | $30,000 | $20 | 42 |
| 1100 N Jefferson St | 0.65mi | 3/2.0 (+1) | 1,279 (-4%) | 16mo | $136,000 | $106 | 41 |
| 1210 Barham Ave | 0.57mi | 3/2.0 (+1) | 1,480 (+12%) | 8mo | $140,000 | $95 | 39 |
| 907 Barham Ave | 0.49mi | 2/1.5 | 1,138 (-14%) | 16mo | $63,000 | $55 | 38 |
| 701 Jefferson Ave | 0.64mi | 2/1.5 | 1,161 (-12%) | 14mo | $125,000 | $108 | 35 |
| 1004 Jefferson Ave | 0.65mi | 3/2.0 (+1) | 1,202 (-9%) | 12mo | $155,000 | $129 | 35 |
| 1103 Jefferson Ave | 0.63mi | 3/2.0 (+1) | 1,497 (+13%) | 15mo | $110,000 | $73 | 28 |
Match score weights: distance 35% · size 25% · config 20% · recency 20%. Top-matched comps best support the ARV.
Projected returns pro-forma
-3.0% appreciation · 3.0% rent growth · sell at horizon
- IRR
- 41.4%
- Equity multiple
- 2.78×
- Total profit
- $24,415
- Equity at exit
- $7,306
- IRR
- 47.6%
- Equity multiple
- 5.59×
- Total profit
- $62,994
- Equity at exit
- $4,237
Cash invested: $13,720 (down + closing). Projections, not guarantees.
Landlord ↔ Tenant lean methodology
- Overall (STATE)
- 43 Moderately Tenant-Leaning
- State Illinois
- 43 Moderately Tenant-Leaning · D+7
- County
- — inherits STATE
- City
- — inherits STATE
ZIP-level market 62951
- Home prices YoY
- -25.8%
- Active inventory
- 26
- Price-to-rent
- 3.7×
Monthly cashflow live
- Estimated rent
- $1,090 medium interval (Pro) →
- Mortgage (P&I)
- −$257
- Tax from tax record
- −$76 /mo · $909/yr
- Insurance
- −$20
- HOA
- −$0
- Vacancy / Maint / Mgmt
- −$229
- Net cashflow
- $508
Break-even live
UW: 25.0% down · 7.5% · 30yr · 1.5% tax · 5.0% vac · 8.0% maint · 8.0% mgmt
Financing live
Cash to close
- Down payment
- $12,250
- Closing costs
- $1,470
- Reserves months
- —
- Total cash needed
- —
Loan-product check · same deal, 3 products live
Conventional
25% down · 7.5% · 30yr
- Down + closing
- —
- Monthly P&I
- —
- Monthly cashflow
- —
- DSCR
- —
- Eligible?
- —
Personal DTI + credit; lowest rate.
DSCR
20% down · 8.5% · 30yr
- Down + closing
- —
- Monthly P&I
- —
- Monthly cashflow
- —
- DSCR
- —
- Eligible?
- —
No personal income docs; deal must DSCR.
Hard money
10% down · 12.0% · 12mo
- Down + closing
- —
- Monthly P&I
- —
- Monthly cashflow
- —
- DSCR
- —
- Eligible?
- —
Short-term bridge; refi at stabilization.
Listing history 27 events
-
2026-06-19days on market $49,000 Active 37 DOM
-
2026-06-18days on market $49,000 Active 36 DOM
-
2026-06-17days on market $49,000 Active 35 DOM
-
2026-06-16days on market $49,000 Active 34 DOM
-
2026-06-15days on market $49,000 Active 33 DOM
-
2026-06-14days on market $49,000 Active 31 DOM
-
2026-06-13days on market $49,000 Active 30 DOM
-
2026-06-10days on market $49,000 Active 28 DOM
-
2026-06-09days on market $49,000 Active 27 DOM
-
2026-06-08days on market $49,000 Active 26 DOM
-
2026-06-07days on market $49,000 Active 25 DOM
-
2026-06-05days on market $49,000 Active 22 DOM
-
2026-06-03days on market $49,000 Active 21 DOM
-
2026-06-02days on market $49,000 Active 20 DOM
-
2026-06-01days on market $49,000 Active 19 DOM
-
2026-05-31days on market $49,000 Active 18 DOM
-
2026-05-30days on market $49,000 Active 17 DOM
-
2026-05-13$49,000 Active 812-char remark
-
2024-08-30historical
-
2024-07-15price
-
2024-07-10price
-
2024-06-20Active
-
2006-03-26historical
-
2006-01-27soldstatus $52,500
-
2005-12-16historical
-
2001-12-27historical
-
2001-08-23soldstatus $42,000
ⓘ Source: listings_history table (triggers on properties + properties_extension) + one-shot
backfill from property_details.listing_events for pre-trigger history.
Tax reassessment forecast IL · Partial reset (capped growth)
- Current annual tax
- $909 · $76/mo
- Projected year-2 tax
- $1,011 · $84/mo
- Expected delta
- +$102/yr (+$8/mo · 11.2%)
ⓘ Screening estimate from a state-policy table — verify with the county assessor before closing.
Climate risk First Street
- Flood 1/10 Low FEMA zone X (unshaded) · 0% chance over 30 yrs
- Wildfire 3/10 Moderate
- Heat 5/10 Major 7 d/yr ≥107°F today · 20 d/yr by 30 yrs out
- Wind 2/10 Low 2% chance of damaging wind over 30 yrs
- Air quality 2/10 Low 0 unhealthy d/yr today · 2 by 30 yrs out
Nearby sold comps map
Loading sold comps map…
Walkable amenities ~0.75 mi
Loading nearby amenities…
Taxation est. · year 1
- Rental income
- $13,075
- − Mortgage interest
- −$2,745
- − Property taxes
- −$909
- − Insurance
- −$245
- − Repairs & maintenance
- −$1,046
- − Management
- −$1,046
- − Depreciation
- −$1,425
- Taxable income
- $5,658
- Est. tax owed @ 24.0%
- −$1,358
- After-tax cash flow
- $4,733/yr
For passive investors: Depreciation is non-cash, so a rental often shows a tax loss while cash-flowing — sheltering income. Rental losses are passive: they offset passive income freely, and up to $25,000/yr can offset ordinary (W-2) income if you actively participate and your MAGI is under $100k (phasing out to $0 by $150k); unused losses carry forward. On sale, claimed depreciation is recaptured at up to 25%, and gains may owe capital-gains tax (a 1031 exchange can defer both). Figures are a year-1 estimate at your 24.0% rate — not tax advice; consult a CPA.
Schools (NCES district)
- District
- Johnston City CUSD 1
- NCES district ID
- 1720550
- Math proficiency
- 11% ▼ -11.00%
- Reading proficiency
- 14% ▼ -6.00%
- Median HH income
- $40,813
- Composite
- 10.81/100
- National rank
- #9765
- State rank
- #556 of 620 in IL
Livability — Johnston City
- Score
- 64/100
- State rank
- #670
- US rank
- #13707
Category grades
Schools grade is shown separately in the Schools card above.
Census & demographics
- City population
- 5,381
- Population (ZIP)
- 5,381
Population outlook (Williamson County) Hauer SSP2
- Today (2025)
- 69,553 people
- By 2030
- 70,090 · +0.8%
- By 2040
- 70,345 · +1.1%
- By 2050
- 69,394 · -0.2%
- By 2075
- 63,590 · -8.6%
- By 2100
- 51,154 · -26.5%
Race, ethnicity, and origin ACS 2023
- Neighborhood character
- Predominantly White (92%)
- Race & ethnicity
- White 92% Two or more races 3% Asian 2% Hispanic / Latino 2%
- Common ancestry
- Romanian 4% Iranian 3% English 2%
- Foreign-born
- 2% · China
- Languages at home
- 98% English-only · Chinese 2%
Political lean MEDSL · Williamson
- 2024 margin
- Solid R (+38.8) · D 30.0% · R 68.8% · Other 1.3%
- 2008→2024 swing
- -24.0pp toward R · 2008: -14.8pp · 2024: -38.8pp
- All cycles
- 2024: R+38.8 2020: R+37.3 2016: R+41.2 2012: R+25.0 2008: R+14.8
Not yet ingested
- Civics
- —
Market trends
- HPI YoY
- ▼ -38.65%
- Current HPI
- 111.1728
- Rent YoY
- —
- Metro
- —
- State GDP YoY
- ▲ 1.59%
- F500 in state
- 60
Industry mix (Fortune 500 HQ in IL)
| Industry | F500 HQs | Revenue |
|---|---|---|
| Insurance | 4 | $201B |
|
||
| Consumer Goods | 4 | $87B |
|
||
| Industrial Machinery | 3 | $64B |
|
||
| Healthcare | 2 | $55B |
|
||
| Retail / Pharmacy | 1 | $148B |
|
||
| Agriculture / Food | 1 | $86B |
|
||
Price history
+16.7% since first listed10 events — show timeline
- 2026-05-13 Listed $49,000 MRED as Distributed by MLS Grid
- 2024-08-30 Listing Removed — RMLSA as Distributed by MLS Grid
- 2024-07-15 Price Changed — RMLSA as Distributed by MLS Grid
- 2024-07-10 Price Changed — RMLSA as Distributed by MLS Grid
- 2024-06-20 Listed — RMLSA as Distributed by MLS Grid
- 2006-03-26 Listing Removed — MRED as Distributed by MLS Grid
- 2006-01-27 Sold (Public Records) $52,500 Public Records
- 2005-12-16 Listing Removed — MRED as Distributed by MLS Grid
- 2001-12-27 Listing Removed — MRED as Distributed by MLS Grid
- 2001-08-23 Sold (Public Records) $42,000 Public Records
Property tax history
+3.5%/yrLatest (2025): $909 · +0.6% YoY. Source: county tax records.
Cash-flow waterfall
monthlySold comps — $/sqft
last 12 mo · ≤1 miLoading sold comps…