3359 Orion St NW · North Canton, OH
Flood risk 1/10 · Minimal
- FEMA flood zone
- X (unshaded)
- Chance of flooding over 30 yrs
- 0.0%
- Est. flood insurance / yr
- $507 – $1,088
Fire risk 1/10 · Minimal
- Est. fire insurance / yr
- $713 – $1,323
Heat risk 3/10 · Minor
- Hot days now (above 96°F)
- 7 days/yr
- Hot days in 30 yrs
- 17 days/yr
Wind risk 1/10 · Minimal
- Chance of severe wind over 30 yrs
- —
Air-quality risk 2/10 · Minimal
- Unhealthy air days now
- 1 days/yr
- Unhealthy air days in 30 yrs
- 2 days/yr
Risk factors via First Street. Map © Google.
Why this score? — see what drove the B grade
The composite is a weighted blend of 9 inputs, each scored 0–100. Each bar is that input's sub-score; the figure is the points it added to the 100-point composite (weight × sub-score).
- Cash flow +25.8/30.0
- ARV discount +15.0/15.0
- DSCR +8.6/10.0
- 1% rule +6.8/10.0
- Schools +6.7/10.0
- Livability +4.2/5.0
- Rent growth +2.7/5.0
- Condition / age +2.5/5.0
- Appreciation +0.0/10.0
$125,000
🖨 Deal sheet (PDF) 📄 Offer letter ✓ Due diligence
Listing remarks MLS
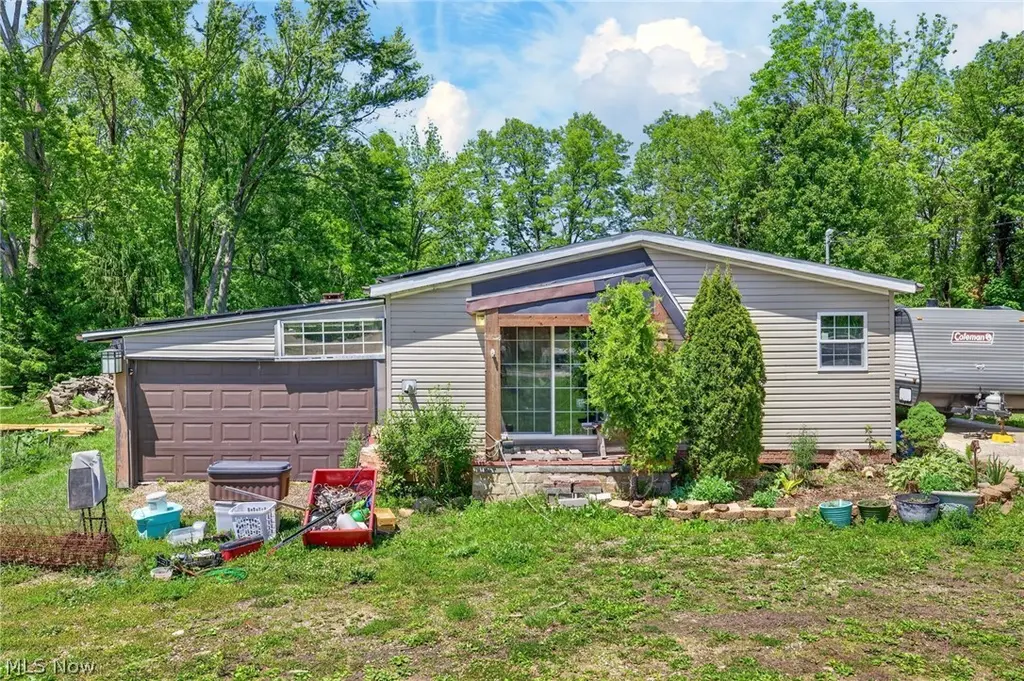
Lovely 3 bedroom, 2 bath open floor plan manufactured home. Large kitchen features plenty of cabinets, counter space, stove and refrigerator. Wood flooring in the kitchen and living room is bamboo. Large master bedroom and bath. Private patio on the side of the house looks over a beautiful treed lot. One garage attached the second is detached. Close to shopping, restaurants and major highways. Don't miss out schedule your showing now.
Key facts
- Covered front porch
- Water softener
- Hurricane straps
Tags
Property features AI
Exterior
- Parking: Attached garage with two spaces
- Utilities: Public sewer; Well water
- Home design: Single-story home; Vinyl siding; Asphalt/fiberglass roof; Above-grade living area reported as 1,189
- Construction: Vinyl siding construction; Asphalt/fiberglass roof
- Exterior features: Lot approximately 0.67 acres
Interior
- Bedrooms: Three main-level bedrooms
- Bathrooms: Two full bathrooms on the main level
- Heating & cooling: Electric heating; Fireplace heat sources
- Interior features: Two wood-burning fireplaces
Neighborhood map
What this means for you Summary
Snapshot
- This is a 3-bed/2.0-bath single-family listed at $125k.
Deal economics
- At list price, monthly cash flow is $304 ($4k/yr) — positive.
- The deal already cash-flows at list — no discount required.
- Meets the 1% rule at list price ($1k rent vs $125k).
- Recommended offer: $123k (1.5% below list) — sets the bar for market timing.
- Cap rate 9.2% vs local median 4.0% in North Canton — top-decile yield for the area; either an underpriced asset or a hidden risk that comps aren't pricing in. Stress-test before assuming the spread holds.
Location & tenants
- Location reads 85/100 on livability (#44 in OH, #598 nationally) — a professional / high-income tenant draw. Strengths: schools A+, crime A+, cost of living A+; Watch: amenities D-, commute F.
- North Canton City (suburban): math 77% / reading 79% proficiency, ranked #64 of 656 in OH (top 10%) — strong family-tenant draw, lease renewals of 3-5y typical; only 16% free/reduced lunch — higher-income household profile.
- Market conditions: Rents flat; 226 active listings in the ZIP; 10 comparable units currently listed for rent nearby; rentals lingering (median 45d on market — plan ~5-8 weeks vacancy on turnover, expect pricing pressure); 70% of comp listings sitting > 30 days — soft ceiling on asking rent; solid renter incomes; 528 units permitted in Stark County in 2024 (84 in 5+ unit buildings).
Forward outlook
- Local home prices are declining (-3.0%/yr); year-one equity from $864 of loan paydown is wiped out by about $4k of value loss. Plan a longer hold.
- Stark County population projected to shrink 8% by 2050 — rents likely to lag national; underwrite the cash flow, not the appreciation.
Negotiation context
- It's been on market 22 days — a 2% lower offer ($123k) is reasonable based on typical stale-listing flexibility.
- 2 sale attempts since 6y ago with the ask held roughly flat each time — persistent listings suggest the price (not the market) is what's stuck; bring a comps-based counter.
- Current owner paid $97k; 29% above their basis — modest negotiation headroom, anchor on the comps not their cost.
Questions for the listing agent
- Is there a deadline driving the sale (1031 exchange, divorce, estate, relocation)? That informs how much negotiation room exists.
- Schools are A-rated — typically a magnet for longer-tenancy family renters. What's the average tenant stay here, and is there a school-zone premium baked into asking?
- What's the average days-on-market for RENTAL listings here right now (not sales)? A rising rental-DOM trend means longer vacancies and softer asking-rent achievability than the comps imply.
- What's the recent tenant-quality profile in this submarket — average credit score on applications, eviction rate, late-payment / NSF rate, and stable-employment percentage? A property-management company in the area should have these aggregated.
- How much new for-sale + rental construction is in the pipeline within 1–3 miles? Heavy new supply typically softens prices + rents 12–24 months out; constrained supply supports both.
Investment metrics
- 1% rule
- 1.18% ✓
- Cap rate
- 9.21%
- Cash-on-cash
- 10.42%
- DSCR
- 1.46
- GRM
- 7.0
CMA / ARV
- ARV (on-the-fly)
- $231,660
- Comps found
- 8
Show comp detail 8 sales within ~0.75 mi
| Address | Dist | Beds/Ba | Sqft | Sold | Price | $/sf | Match |
|---|---|---|---|---|---|---|---|
| 7890 Killington Ave NW | 0.53mi | 3/3.0 | 1,240 (+4%) | 8mo | $329,900 | $266 | 58 |
| 3008 Mount Pleasant St NW | 0.72mi | 3/2.0 | 1,287 (+8%) | 1mo | $325,000 | $253 | 52 |
| 7901 Killington Ave NW | 0.50mi | 3/1.0 | 1,240 (+4%) | 17mo | $237,900 | $192 | 51 |
| 7914 Killington Ave NW | 0.53mi | 3/2.0 | 1,300 (+9%) | 17mo | $230,000 | $177 | 46 |
| 8062 Sandleford Ave NW | 0.67mi | 3/1.0 | 1,240 (+4%) | 15mo | $250,100 | $202 | 45 |
| 1406 Chatham Ave NE | 0.72mi | 3/1.5 | 1,284 (+8%) | 11mo | $250,000 | $195 | 42 |
| 8146 Sandleford Ave NW | 0.71mi | 2/2.0 (-1) | 1,308 (+10%) | 13mo | $220,000 | $168 | 34 |
| 3136 Mount Pleasant NW | 0.67mi | 2/1.5 (-1) | 1,092 (-8%) | 23mo | $179,900 | $165 | 29 |
Match score weights: distance 35% · size 25% · config 20% · recency 20%. Top-matched comps best support the ARV.
Projected returns pro-forma
-3.0% appreciation · 0.82% rent growth · sell at horizon
- IRR
- -3.2%
- Equity multiple
- 0.88×
- Total profit
- $-4,053
- Equity at exit
- $18,638
- IRR
- 3.9%
- Equity multiple
- 1.26×
- Total profit
- $9,018
- Equity at exit
- $10,808
Cash invested: $35,000 (down + closing). Projections, not guarantees.
Landlord ↔ Tenant lean methodology
- Overall (STATE)
- 73 Landlord-Friendly
- State Ohio
- 73 Landlord-Friendly · R+6
- County
- — inherits STATE
- City
- — inherits STATE
ZIP-level market 44720
- Rents YoY
- 0.8%
- Active inventory
- 226
- Price-to-rent
- 7.0×
Monthly cashflow live
- Estimated rent
- $1,478 high interval (Pro) →
- Mortgage (P&I)
- −$656
- Tax from tax record
- −$156 /mo · $1,874/yr
- Insurance
- −$52
- HOA
- −$0
- Vacancy / Maint / Mgmt
- −$310
- Net cashflow
- $304
Break-even live
Sensitivity live
| Price | -10% $375 | -5% $339 | +0% $304 | +5% $268 | +10% $233 |
|---|---|---|---|---|---|
| Rent | -10% $187 | -5% $245 | +0% $304 | +5% $362 | +10% $421 |
| Rate | -1.0pp $367 | -0.5pp $336 | base $304 | +0.5pp $271 | +1.0pp $239 |
UW: 25.0% down · 7.5% · 30yr · 1.5% tax · 5.0% vac · 8.0% maint · 8.0% mgmt
Financing live
Cash to close
- Down payment
- $31,250
- Closing costs
- $3,750
- Reserves months
- —
- Total cash needed
- —
Loan-product check · same deal, 3 products live
Conventional
25% down · 7.5% · 30yr
- Down + closing
- —
- Monthly P&I
- —
- Monthly cashflow
- —
- DSCR
- —
- Eligible?
- —
Personal DTI + credit; lowest rate.
DSCR
20% down · 8.5% · 30yr
- Down + closing
- —
- Monthly P&I
- —
- Monthly cashflow
- —
- DSCR
- —
- Eligible?
- —
No personal income docs; deal must DSCR.
Hard money
10% down · 12.0% · 12mo
- Down + closing
- —
- Monthly P&I
- —
- Monthly cashflow
- —
- DSCR
- —
- Eligible?
- —
Short-term bridge; refi at stabilization.
Rent comps 10 comps
| Address | Beds | Baths | Sqft | Rent | $/sqft | DOM | Units | Dist |
|---|---|---|---|---|---|---|---|---|
| 285 Wilbur Dr NE North Canton, OH | 1.0–2.0 | 1.0 | 908 | $1,230 | $1.35 | 45d | 1 | 0.36mi |
| 171 Applegrove St NE North Canton, OH | 1.0–2.0 | 1.0–2.0 | 1100 | $1,590 | $1.45 | 45d | 1 | 0.52mi |
| 3617 Mount Pleasant St NW Unit 3617 North Canton, OH | 3.0 | 1.5 | 1310 | $1,350 | $1.03 | 45d | 1 | 0.55mi |
| 1303 N Main St North Canton, OH | 2.0 | 2.0 | 1000 | $1,415 | $1.42 | 45d | 1 | 0.68mi |
| 8523 Pleasantwood Ave NW North Canton, OH | 2.0 | 1.5 | 1200 | $1,300 | $1.08 | 45d | 1 | 0.73mi |
| 1113 N Main St North Canton, OH | 2.0 | 1.0 | 565 | $1,090 | $1.93 | 45d | 1 | 0.77mi |
| 7514 Peachmont Ave NW North Canton, OH | 3.0 | 2.0 | 1441 | $1,625 | $1.13 | 15d | 1 | 1.30mi |
| 415 Sheraton Dr NW Unit 415 North Canton, OH | 2.0 | 1.5 | 1200 | $1,269 | $1.06 | 15d | 1 | 1.37mi |
| 407 Sheraton Dr NW Unit 407 North Canton, OH | 2.0 | 1.5 | 1200 | $1,269 | $1.06 | 15d | 1 | 1.38mi |
| 4640 Applegrove St NW North Canton, OH | 2.0 | 1.5 | 1000 | $1,199 | $1.20 | 45d | 1 | 1.47mi |
Listing history 16 events
-
2026-06-21days on market $125,000 Active 22 DOM
-
2026-06-18days on market $125,000 Active 19 DOM
-
2026-06-17days on market $125,000 Active 18 DOM
-
2026-06-16days on market $125,000 Active 17 DOM
-
2026-06-15days on market $125,000 Active 16 DOM
-
2026-06-14days on market $125,000 Active 14 DOM
-
2026-06-13days on market $125,000 Active 13 DOM
-
2026-06-10days on market $125,000 Active 11 DOM
-
2026-06-09days on market $125,000 Active 10 DOM
-
2026-06-08days on market $125,000 Active 9 DOM
-
2026-06-07days on market $125,000 Active 8 DOM
-
2026-06-05days on market $125,000 Active 5 DOM
-
2026-06-02days on market $125,000 Active 3 DOM
-
2026-06-01days on market $125,000 Active 2 DOM
-
2026-05-31remarks 699-char remark
-
2026-05-31$125,000 Active 1 DOM
ⓘ Source: listings_history table (triggers on properties + properties_extension) + one-shot
backfill from property_details.listing_events for pre-trigger history.
Tax reassessment forecast OH · Partial reset (capped growth)
- Current annual tax
- $1,874 · $156/mo
- Projected year-2 tax
- $1,912 · $159/mo
- Expected delta
- +$38/yr (+$3/mo · 2.0%)
ⓘ Screening estimate from a state-policy table — verify with the county assessor before closing.
Climate risk First Street
- Flood 1/10 Low FEMA zone X (unshaded) · 0% chance over 30 yrs
- Wildfire 1/10 Low
- Heat 3/10 Moderate 7 d/yr ≥96°F today · 17 d/yr by 30 yrs out
- Wind 1/10 Low
- Air quality 2/10 Low 1 unhealthy d/yr today · 2 by 30 yrs out
Nearby sold comps map
Loading sold comps map…
Walkable amenities ~0.75 mi
Loading nearby amenities…
Taxation est. · year 1
- Rental income
- $17,735
- − Mortgage interest
- −$7,002
- − Property taxes
- −$1,874
- − Insurance
- −$625
- − Repairs & maintenance
- −$1,419
- − Management
- −$1,419
- − Depreciation
- −$3,636
- Taxable income
- $1,761
- Est. tax owed @ 24.0%
- −$423
- After-tax cash flow
- $3,224/yr
For passive investors: Depreciation is non-cash, so a rental often shows a tax loss while cash-flowing — sheltering income. Rental losses are passive: they offset passive income freely, and up to $25,000/yr can offset ordinary (W-2) income if you actively participate and your MAGI is under $100k (phasing out to $0 by $150k); unused losses carry forward. On sale, claimed depreciation is recaptured at up to 25%, and gains may owe capital-gains tax (a 1031 exchange can defer both). Figures are a year-1 estimate at your 24.0% rate — not tax advice; consult a CPA.
Schools (NCES district)
- District
- North Canton City
- NCES district ID
- 3904450
- Math proficiency
- 77% ▼ -6.00%
- Reading proficiency
- 79% ▼ -4.00%
- Median HH income
- $59,644
- Composite
- 66.92/100
- National rank
- #400
- State rank
- #64 of 656 in OH
Livability — North Canton
- Score
- 85/100
- State rank
- #44
- US rank
- #598
Category grades
Schools grade is shown separately in the Schools card above.
Census & demographics
- County
- Stark County · 272,865 people
- City population
- 39,851
- Metro
- Canton-Massillon, OH
- Population (ZIP)
- 39,851
- Household income
- $82,594
- Rent vs Own
- Severe rent burden
- 1068.0
Population outlook (Stark County) Hauer SSP2
- Today (2025)
- 373,708 people
- By 2030
- 371,245 · -0.7%
- By 2040
- 361,331 · -3.3%
- By 2050
- 345,290 · -7.6%
- By 2075
- 302,669 · -19.0%
- By 2100
- 238,870 · -36.1%
Race, ethnicity, and origin ACS 2023
- Neighborhood character
- Predominantly White (92%)
- Race & ethnicity
- White 92% Two or more races 3% Hispanic / Latino 2% Black 2% Asian 2%
- Common ancestry
- Romanian 5% Italian 4% Lithuanian 3%
- Foreign-born
- 3% · Canada, China
- Languages at home
- 97% English-only · Spanish 1% Other Indo-European 1%
Political lean MEDSL · Stark
- 2024 margin
- Strong R (+21.9) · D 38.6% · R 60.5%
- 2008→2024 swing
- -27.4pp toward R · 2008: 5.5pp · 2024: -21.9pp
- All cycles
- 2024: R+21.9 2020: R+18.5 2016: R+17.4 2012: R+0.4 2008: D+5.5
Not yet ingested
- Civics
- —
Market trends
- HPI YoY
- ▼ -218.69%
- Current HPI
- 215.4995
- Rent YoY
- ▲ 0.82%
- Metro
- Canton-Massillon, OH
- State GDP YoY
- ▲ 1.98%
- F500 in state
- 48
Industry mix (Fortune 500 HQ in OH)
| Industry | F500 HQs | Revenue |
|---|---|---|
| Insurance | 3 | $145B |
|
||
| Industrial Machinery | 3 | $49B |
|
||
| Financial Services | 3 | $24B |
|
||
| Consumer Goods | 2 | $93B |
|
||
| Aerospace / Defense | 2 | $47B |
|
||
| Utilities | 2 | $33B |
|
||
Price history
+363.0% since first listed7 events — show timeline
- 2026-05-30 Listed $125,000 MLSNOW
- 2021-03-29 Sold (Public Records) $97,000 Public Records
- 2021-03-22 Sold (MLS) $97,000 MLSNOW
- 2020-09-17 Pending — MLSNOW
- 2020-09-15 Price Changed $104,900 MLSNOW
- 2020-08-31 Listed $109,000 MLSNOW
- 2015-07-22 Sold (Public Records) $27,000 Public Records
Property tax history
+22.6%/yrLatest (2024): $1,874 · +1.1% YoY. Source: county tax records.
Cash-flow waterfall
monthlySold comps — $/sqft
last 12 mo · ≤1 miLoading sold comps…