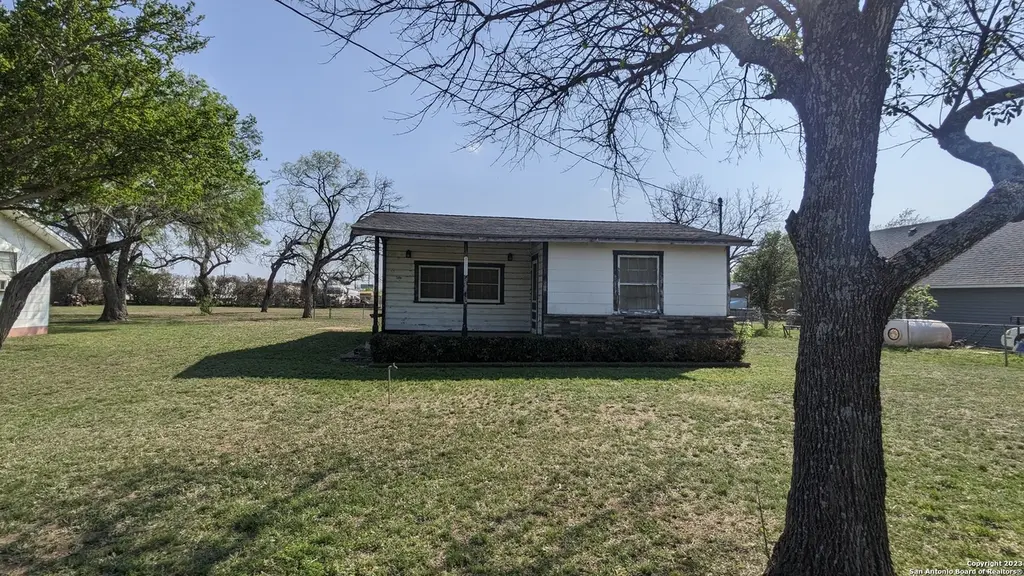
4918 Alma · San Antonio, TX
Flood risk 1/10 · Minimal
- FEMA flood zone
- X (unshaded)
- Chance of flooding over 30 yrs
- 0.0%
- Est. flood insurance / yr
- $507 – $1,088
Fire risk 4/10 · Minor
- Est. fire insurance / yr
- $1,222 – $2,270
Heat risk 8/10 · Major
- Hot days now (above 109°F)
- 7 days/yr
- Hot days in 30 yrs
- 22 days/yr
Wind risk 8/10 · Major
- Chance of severe wind over 30 yrs
- 80.0%
Air-quality risk 2/10 · Minimal
- Unhealthy air days now
- 0 days/yr
- Unhealthy air days in 30 yrs
- 2 days/yr
Risk factors via First Street. Map © Google.
Why this score? — see what drove the C- grade
The composite is a weighted blend of 9 inputs, each scored 0–100. Each bar is that input's sub-score; the figure is the points it added to the 100-point composite (weight × sub-score).
- ARV discount +15.0/15.0
- Cash flow +12.7/30.0
- Appreciation +5.0/10.0
- 1% rule +4.1/10.0
- Livability +4.0/5.0
- DSCR +3.8/10.0
- Rent growth +2.5/5.0
- Condition / age +2.5/5.0
- Schools +1.9/10.0
$130,000
🖨 Deal sheet 📄 Offer letter ✓ Due diligence
Listing remarks MLS
This has great investment potential, half acre lot on very quite street with quick access to 410, restaurants and shops. Open level lot mostly cleared out very serene and peaceful. A nice quiet pocket in South East San Antonio with development potential for duplex or quadplex.
Key facts
- Quiet street
- Quick access to 410
- Half acre lot
Tags
Neighborhood map
What this means for you Summary
Snapshot
- This is a 2-bed/1.0-bath single-family listed at $130k.
Deal economics
- At list price, monthly cash flow is $-14 ($-174/yr) — negative.
- To cash-flow at today's rent, offer at most $127k (2.0% below list).
- To meet the 1% rule (rent ≥ 1% of price), the offer needs to be $118k (9.4% below list).
- Recommended offer: $118k (9.4% below list) — sets the bar for 1% rule.
- Cap rate 6.2% vs local median 3.8% in San Antonio — top-decile yield for the area; either an underpriced asset or a hidden risk that comps aren't pricing in. Stress-test before assuming the spread holds.
Location & tenants
- Location reads 80/100 on livability (#31 in TX, #1,616 nationally) — a professional / high-income tenant draw. Strengths: amenities A+, commute A+, cost of living A+; Watch: schools C-, crime F.
- East Central ISD (rural): math 16% / reading 25% proficiency, ranked #758 of 826 in TX (top 92%) — low school quality limits family demand, transient renter base, plan for 1-2y turnover; 61% free/reduced lunch — lower-income household profile, screen leases tightly.
- Market conditions: 1 active listings in the ZIP; 7 comparable units currently listed for rent nearby; rentals at typical pace (median 20d on market — plan ~3-4 weeks tenant-placement turnaround); 8,308 units permitted in Bexar County in 2024 (2,506 in 5+ unit buildings).
Forward outlook
- In year one you build about $5k of equity ($899 loan paydown + $4k appreciation (3.0% local appreciation)).
- Bexar County population projected at +50% by 2050 — long-run rental-demand tailwind backs the buy-and-hold thesis.
- At projected returns (3.0% appreciation + 3.0% rent growth), your $36k cash investment doubles in ~7 years — after that, you're playing with house money.
- By year 7, paydown + projected appreciation supports a ~$30k cash-out refi (75% LTV) — recoverable capital for the next deal without selling this one.
Negotiation context
- It's been on market 94 days — a 9% lower offer ($118k) is reasonable based on typical stale-listing flexibility.
- 6 sale attempts since 3y ago with the ask held roughly flat each time — persistent listings suggest the price (not the market) is what's stuck; bring a comps-based counter.
Risks & watch-outs
- Watch-outs: built in 1951 — expect roof / HVAC / electrical / plumbing capex.
- Climate carrying-cost: severe wind risk, 80% chance of damaging wind over 30y; extreme-heat days projected 7→22/yr by 2055 (HVAC capex compounding) — expect insurance premiums to compound above CPI over the hold.
Questions for the listing agent
- What do current leases actually rent for vs. the listed asking? Can we see a recent rent roll and the last 12 months of T-12 income?
- It's been on market 94 days. Have you received any prior offers? Is the seller open to a 9% concession, seller financing, or rate buy-down credit?
- Built in 1951 — when were the roof, HVAC, electrical panel, plumbing, and water heater last replaced?
- Why hasn't it sold? Are there any deal-killer items the seller is aware of (foundation, flood, title, zoning, code violations)?
- Is there a deadline driving the sale (1031 exchange, divorce, estate, relocation)? That informs how much negotiation room exists.
- Crime grade is F in this area — have there been break-ins, vandalism, or insurance claims at this property in the last 3 years? What carrier currently insures it and at what premium?
- What's the average days-on-market for RENTAL listings here right now (not sales)? A rising rental-DOM trend means longer vacancies and softer asking-rent achievability than the comps imply.
- What's the recent tenant-quality profile in this submarket — average credit score on applications, eviction rate, late-payment / NSF rate, and stable-employment percentage? A property-management company in the area should have these aggregated.
- How much new for-sale + rental construction is in the pipeline within 1–3 miles? Heavy new supply typically softens prices + rents 12–24 months out; constrained supply supports both.
Investment metrics
- 1% rule
- 0.91% ✗
- Cap rate
- 6.16%
- Cash-on-cash
- -0.48%
- DSCR
- 0.98
- GRM
- 9.2
CMA / ARV
- ARV (median comp)
- $167,489
- List price
- $130,000
- Delta
- -22.38%
- Verdict
- UNDERPRICED
- Comps
- 20 within 1.0 mi
Show comp detail 2 sales within ~0.75 mi
| Address | Dist | Beds/Ba | Sqft | Sold | Price | $/sf | Match |
|---|---|---|---|---|---|---|---|
| 5422 Abilene Trl | 0.67mi | 2/2.0 | 924 (+12%) | 18mo | $100,000 | $108 | 30 |
| 2815 Kaiser Dr | 0.72mi | 3/2.0 (+1) | 912 (+10%) | 16mo | $169,055 | $185 | 28 |
Match score weights: distance 35% · size 25% · config 20% · recency 20%. Top-matched comps best support the ARV.
Projected returns pro-forma
3.0% appreciation · 3.0% rent growth · sell at horizon
- IRR
- 7.1%
- Equity multiple
- 1.41×
- Total profit
- $14,785
- Equity at exit
- $58,454
- IRR
- 9.9%
- Equity multiple
- 2.48×
- Total profit
- $54,008
- Equity at exit
- $90,084
Cash invested: $36,400 (down + closing). Projections, not guarantees.
Landlord ↔ Tenant lean methodology
- Overall (STATE)
- 87 Strongly Landlord-Friendly
- State Texas
- 87 Strongly Landlord-Friendly · R+5
- County
- — inherits STATE
- City
- — inherits STATE
ZIP-level market 78222-3004
- Active inventory
- 1
- Price-to-rent
- 9.2×
Monthly cashflow live
- Estimated rent
- $1,178 high interval (Pro) →
- Mortgage (P&I)
- −$682
- Tax from tax record
- −$209 /mo · $2,506/yr
- Insurance
- −$54
- HOA
- −$0
- Vacancy / Maint / Mgmt
- −$247
- Net cashflow
- $-14
Break-even live
UW: 25.0% down · 7.5% · 30yr · 1.5% tax · 5.0% vac · 8.0% maint · 8.0% mgmt
Financing live
Cash to close
- Down payment
- $32,500
- Closing costs
- $3,900
- Reserves months
- —
- Total cash needed
- —
Loan-product check · same deal, 3 products live
Conventional
25% down · 7.5% · 30yr
- Down + closing
- —
- Monthly P&I
- —
- Monthly cashflow
- —
- DSCR
- —
- Eligible?
- —
Personal DTI + credit; lowest rate.
DSCR
20% down · 8.5% · 30yr
- Down + closing
- —
- Monthly P&I
- —
- Monthly cashflow
- —
- DSCR
- —
- Eligible?
- —
No personal income docs; deal must DSCR.
Hard money
10% down · 12.0% · 12mo
- Down + closing
- —
- Monthly P&I
- —
- Monthly cashflow
- —
- DSCR
- —
- Eligible?
- —
Short-term bridge; refi at stabilization.
Rent comps 7 comps
| Address | Beds | Baths | Sqft | Rent | $/sqft | DOM | Units | Dist |
|---|---|---|---|---|---|---|---|---|
| 2825 S WW White Rd San Antonio, TX | 2.0 | 2.0 | 1007 | $927 | $0.92 | 43d | 1 | 0.58mi |
| 4226 Toledo Mist San Antonio, TX | 2.0 | 2.5 | 944 | $1,600 | $1.69 | 23d | 1 | 0.70mi |
| 2819 S WW White Rd Unit 710 San Antonio, TX | 2.0 | 2.0 | 1007 | $1,200 | $1.19 | 2d | 1 | 0.70mi |
| 2819 S WW White Rd Unit 610 San Antonio, TX | 1.0 | 1.0 | 770 | $998 | $1.30 | 2d | 1 | 0.70mi |
| 4243 Family Tree San Antonio, TX | 2.0 | 1.0 | 900 | $1,072 | $1.19 | 4d | 8 | 0.84mi |
| 2718 Bermuda Dr San Antonio, TX | 3.0 | 3.0 | 1080 | $1,400 | $1.30 | 20d | 1 | 0.99mi |
| 3510 Bottomless Lk San Antonio, TX | 2.0 | 2.0 | 1068 | $1,150 | $1.08 | 43d | 1 | 1.10mi |
Listing history 25 events
-
2026-06-18days on market $130,000 Active 94 DOM
-
2026-06-17days on market $130,000 Active 93 DOM
-
2026-06-16days on market $130,000 Active 92 DOM
-
2026-06-15days on market $130,000 Active 91 DOM
-
2026-06-13days on market $130,000 Active 89 DOM
-
2026-06-09days on market $130,000 Active 85 DOM
-
2026-06-08days on market $130,000 Active 84 DOM
-
2026-06-07days on market $130,000 Active 83 DOM
-
2026-06-04days on market $130,000 Active 80 DOM
-
2026-06-03days on market $130,000 Active 79 DOM
-
2026-06-02days on market $130,000 Active 78 DOM
-
2026-06-01days on market $130,000 Active 77 DOM
-
2026-05-31days on market $130,000 Active 76 DOM
-
2026-03-16$130,000 New 279-char remark
Show marketing remark (279 chars)
This has great investment potential, half acre lot on very quite street with quick access to 410, restaurants and shops. Open level lot mostly cleared out very serene and peaceful. A nice quiet pocket in South East San Antonio with development potential for duplex or quadplex.
-
2025-11-26historical
-
2025-04-01$140,000 New
-
2024-11-07soldstatus
-
2024-06-19historical
-
2024-04-25status Back on Market
-
2024-04-12historical
-
2023-12-26status Back on Market
-
2023-12-15historical Active Option
-
2023-11-11status Back on Market
-
2023-11-02status Pending
-
2023-03-25$185,000 New
ⓘ Source: listings_history table (triggers on properties + properties_extension) + one-shot
backfill from property_details.listing_events for pre-trigger history.
Tax reassessment forecast TX · Resets to sale price
- Current annual tax
- $2,506 · $209/mo
- Projected year-2 tax
- $2,506 · $209/mo
- Expected delta
- $0/yr ($0/mo · 0.0%)
ⓘ Screening estimate from a state-policy table — verify with the county assessor before closing.
Climate risk First Street
- Flood 1/10 Low FEMA zone X (unshaded) · 0% chance over 30 yrs
- Wildfire 4/10 Moderate
- Heat 8/10 Severe 7 d/yr ≥109°F today · 22 d/yr by 30 yrs out
- Wind 8/10 Severe 80% chance of damaging wind over 30 yrs
- Air quality 2/10 Low 0 unhealthy d/yr today · 2 by 30 yrs out
Nearby sold comps map
Loading sold comps map…
Walkable amenities ~0.75 mi
Loading nearby amenities…
Taxation est. · year 1
- Rental income
- $14,130
- − Mortgage interest
- −$7,282
- − Property taxes
- −$2,506
- − Insurance
- −$650
- − Repairs & maintenance
- −$1,130
- − Management
- −$1,130
- − Depreciation
- −$3,782
- Taxable loss
- −$2,350
- Est. tax savings @ 24.0%
- +$564
- After-tax cash flow
- $390/yr
For passive investors: Depreciation is non-cash, so a rental often shows a tax loss while cash-flowing — sheltering income. Rental losses are passive: they offset passive income freely, and up to $25,000/yr can offset ordinary (W-2) income if you actively participate and your MAGI is under $100k (phasing out to $0 by $150k); unused losses carry forward. On sale, claimed depreciation is recaptured at up to 25%, and gains may owe capital-gains tax (a 1031 exchange can defer both). Figures are a year-1 estimate at your 24.0% rate — not tax advice; consult a CPA.
Schools (NCES district)
- District
- East Central ISD
- NCES district ID
- 4817850
- Math proficiency
- 16% ▼ -12.00%
- Reading proficiency
- 25% ▼ -6.00%
- Median HH income
- $53,941
- Composite
- 18.67/100
- National rank
- #8887
- State rank
- #758 of 826 in TX
Livability — San Antonio
- Score
- 80/100
- State rank
- #31
- US rank
- #1616
Category grades
Schools grade is shown separately in the Schools card above.
Census & demographics
- Census place
- San Antonio, TX
Population outlook (Bexar County) Hauer SSP2
- Today (2025)
- 2,336,851 people
- By 2030
- 2,560,728 · +9.6%
- By 2040
- 3,020,569 · +29.3%
- By 2050
- 3,493,522 · +49.5%
- By 2075
- 4,668,459 · +99.8%
- By 2100
- 5,533,242 · +136.8%
Not yet ingested
- Political lean
- —
- Race & ethnicity
- —
- Common origin
- —
- Civics
- —
Market trends
- HPI YoY
- —
- Current HPI
- —
- Rent YoY
- —
- Metro
- —
- State GDP YoY
- ▲ 3.95%
- F500 in state
- 110
Industry mix (Fortune 500 HQ in TX)
| Industry | F500 HQs | Revenue |
|---|---|---|
| Energy | 16 | $1,198B |
|
||
| Technology | 5 | $198B |
|
||
| Engineering / Construction | 4 | $72B |
|
||
| Energy Services | 3 | $60B |
|
||
| Utilities | 3 | $41B |
|
||
| Healthcare | 2 | $330B |
|
||
Price history
-29.7% since first listed12 events — show timeline
- 2026-03-16 Listed $130,000 LERA
- 2025-11-26 Listing Removed — LERA
- 2025-04-01 Listed $140,000 LERA
- 2024-11-07 Sold (Public Records) — Public Records
- 2024-06-19 Listing Removed — LERA
- 2024-04-25 Relisted — LERA
- 2024-04-12 Listing Removed — LERA
- 2023-12-26 Relisted — LERA
- 2023-12-15 Contingent — LERA
- 2023-11-11 Relisted — LERA
- 2023-11-02 Pending — LERA
- 2023-03-25 Listed $185,000 LERA
Property tax history
+5.4%/yrLatest (2025): $2,506 · +4.7% YoY. Source: county tax records.
Cash-flow waterfall
monthlySold comps — $/sqft
last 12 mo · ≤1 miLoading sold comps…