 🏗️ New Construction
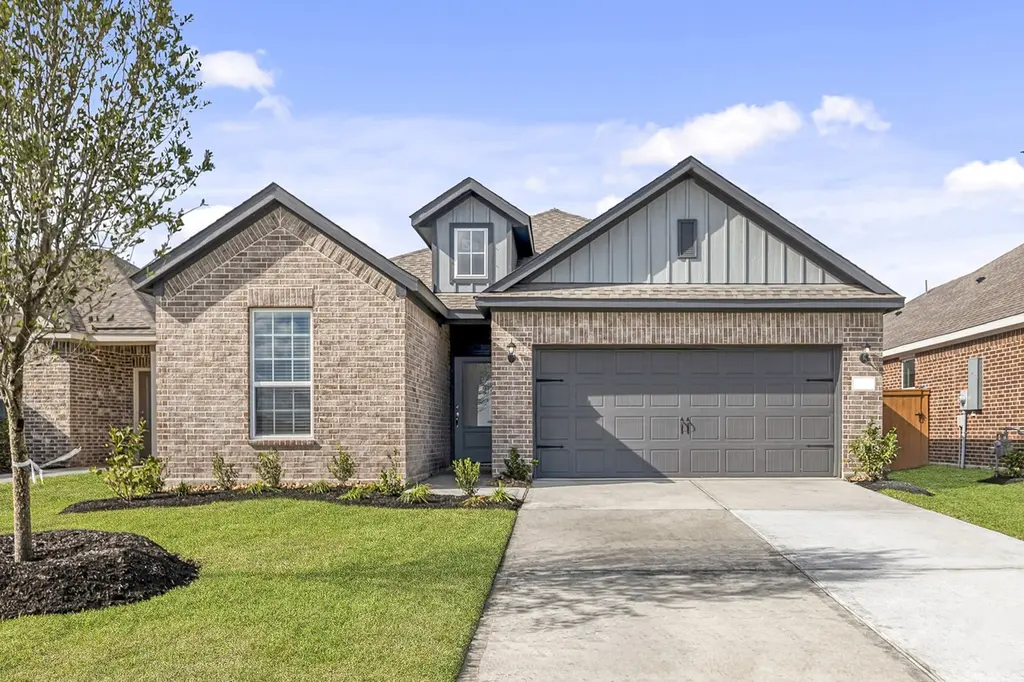
1119 Moonlight Trace Dr · Rosenberg, TX
Flood risk No data
- FEMA flood zone
- —
- Chance of flooding over 30 yrs
- —
- Est. flood insurance / yr
- —
Fire risk No data
- Est. fire insurance / yr
- —
Heat risk No data
- Hot days now (above threshold)
- —
- Hot days in 30 yrs
- —
Wind risk No data
- Chance of severe wind over 30 yrs
- —
Air-quality risk No data
- Unhealthy air days now
- —
- Unhealthy air days in 30 yrs
- —
Risk factors via First Street. Map © Google.
Why this score? — see what drove the C- grade
The composite is a weighted blend of 9 inputs, each scored 0–100. Each bar is that input's sub-score; the figure is the points it added to the 100-point composite (weight × sub-score).
- Cash flow +15.8/30.0
- ARV discount +7.5/15.0
- Appreciation +7.1/10.0
- DSCR +4.9/10.0
- Schools +4.6/10.0
- 1% rule +4.0/10.0
- Livability +3.1/5.0
- Rent growth +2.5/5.0
- Condition / age +2.5/5.0
$289,900
🖨 Deal sheet 📄 Offer letter ✓ Due diligence
Listing remarks
The beautiful Harris is single-story floor plan that has everything you have been looking for! Enjoy a fully upgraded kitchen, luxurious master suite, spacious laundry room and sizable bedrooms with the Harris at Emberly. An inviting open-concept layout gives you ample space for your family to gather. Guests will enjoy being able to flow throughout the home and back patio while they visit to create seamless conversations. Your home will include stainless steel appliances, granite countertops, 36” upper wood cabinets, programmable thermostat, Wi-Fi-enabled garage door opener and professional front yard landscaping. You will also get to enjoy saving money with the energy-efficient featu
Key facts
- Sizable bedrooms
- Open-concept layout
- 2 garage spots
Tags
Property features AI
Finance
- HOA & community: Emberly Homeowners Association; Annual association fee; Community amenities include clubhouse, fitness center, pool, playground, sport court, pickleball, dog park, park, and trails; Association maintains common areas and recreation facilities
Exterior
- Parking: Attached garage with 2 spaces
- Security: Smoke detectors
- Utilities: Public water; Public sewer
- Home design: Residential property; Under construction (new construction); Slab foundation; Brick construction; Composition roof
- Construction: Built in 2026; Brick exterior; Composition roofing; Slab foundation
- Exterior features: Covered patio; Patio/Deck; Fence (back yard); Sprinkler/irrigation system; Patio
Interior
- Kitchen: Dishwasher; Gas cooktop; Gas oven; Microwave; Disposal; Refrigerator; Kitchen island; Pantry
- Bedrooms: Primary bedroom (First level) — 11x17; Bedroom (First level) — 10x12; Bedroom (First level) — 10x12
- Flooring: Carpet; Plank; Vinyl
- Bathrooms: 2 full bathrooms; Primary bathroom (First level) — 11x8; Bathroom (First level) — 7x10
- Heating & cooling: Heat pump heating; Central electric air conditioning
- Interior features: Entrance foyer; Granite counters; High ceilings; Kitchen island; Kitchen and family room combo; Pantry; Soaking tub; Separate shower; Tub/shower combination; Vanity; Ceiling fans; Kitchen and dining combo; Programmable thermostat; Low emissivity windows; ENERGY STAR qualified appliances; Ventilation for improved indoor air quality
- Laundry & utility: Washer hookup; Electric dryer hookup; Utility room (First level) — 6x7; Tankless water heater
Neighborhood map
What this means for you Summary
Snapshot
- This is a 3-bed/2.0-bath land listed at $290k.
Deal economics
- At list price, monthly cash flow is $122 ($1k/yr) — positive.
- To cash-flow at today's rent, offer at most $285k (1.6% below list).
- To meet the 1% rule (rent ≥ 1% of price), the offer needs to be $238k (18.1% below list).
- Recommended offer: $238k (18.1% below list) — sets the bar for 1% rule.
- Cap rate 6.8% vs local median 3.4% in Rosenberg — top-decile yield for the area; either an underpriced asset or a hidden risk that comps aren't pricing in. Stress-test before assuming the spread holds.
Location & tenants
- Location reads 62/100 on livability (#922 in TX) — a middle-class / working-renter tenant base. Strengths: cost of living A+, housing A+, crime B; Watch: schools D-, amenities F, commute F.
- Lamar CISD (suburban): math 50% / reading 53% proficiency, ranked #116 of 826 in TX (top 14%) — acceptable for families but not a draw, mixed tenant base, ~2y average lease.
- Market conditions: 232 active listings in the ZIP; 1 comparable units currently listed for rent nearby; 12,093 units permitted in Fort Bend County in 2024 (815 in 5+ unit buildings).
Forward outlook
- In year one you build about $13k of equity ($2k loan paydown + $11k appreciation (4.2% local appreciation)).
- Fort Bend County population projected at +75% by 2050 — long-run rental-demand tailwind backs the buy-and-hold thesis.
- At projected returns (4.2% appreciation + 3.0% rent growth), your $74k cash investment doubles in ~5 years — after that, you're playing with house money.
- By year 3, paydown + projected appreciation supports a ~$32k cash-out refi (75% LTV) — recoverable capital for the next deal without selling this one.
Negotiation context
- It's been on market 32 days — a 3% lower offer ($281k) is reasonable based on typical stale-listing flexibility.
- 10 sale attempts; this cycle's ask is 11757% above the opening price — seller raised mid-cycle; expect resistance to lowballs.
Questions for the listing agent
- It's been on market 32 days. Have you received any prior offers? Is the seller open to a 18% concession, seller financing, or rate buy-down credit?
- What does the HOA fee cover, when was the last increase, and are there any pending special assessments or reserve-fund shortfalls?
- Is there a deadline driving the sale (1031 exchange, divorce, estate, relocation)? That informs how much negotiation room exists.
- Schools are D-rated, which usually means shorter tenancies and higher turnover. Who's the typical renter profile here, and what's been the actual vacancy rate?
- What's the average days-on-market for RENTAL listings here right now (not sales)? A rising rental-DOM trend means longer vacancies and softer asking-rent achievability than the comps imply.
- What's the recent tenant-quality profile in this submarket — average credit score on applications, eviction rate, late-payment / NSF rate, and stable-employment percentage? A property-management company in the area should have these aggregated.
- How much new for-sale + rental construction is in the pipeline within 1–3 miles? Heavy new supply typically softens prices + rents 12–24 months out; constrained supply supports both.
Investment metrics
- 1% rule
- 0.90% ✗
- Cap rate
- 6.85%
- Cash-on-cash
- 1.99%
- DSCR
- 1.09
- GRM
- 9.3
CMA / ARV
- ARV (median comp)
- $263,765
- List price
- $289,900
- Delta
- 9.91%
- Verdict
- FAIR
- Comps
- 20 within 1.0 mi
Projected returns pro-forma
4.15% appreciation · 3.0% rent growth · sell at horizon
- IRR
- 12.4%
- Equity multiple
- 1.76×
- Total profit
- $56,004
- Equity at exit
- $136,102
- IRR
- 13.8%
- Equity multiple
- 3.29×
- Total profit
- $169,160
- Equity at exit
- $224,518
Cash invested: $73,854 (down + closing). Projections, not guarantees.
Landlord ↔ Tenant lean methodology
- Overall (STATE)
- 87 Strongly Landlord-Friendly
- State Texas
- 87 Strongly Landlord-Friendly · R+5
- County
- — inherits STATE
- City
- — inherits STATE
ZIP-level market 77417
- Home prices YoY
- 1.2%
- Active inventory
- 232
- Price-to-rent
- 10.2×
Monthly cashflow live
- Estimated rent
- $2,375 medium interval (Pro) →
- Mortgage (P&I)
- −$1,383
- Tax from tax record
- −$130 /mo · $1,559/yr
- Insurance
- −$110
- HOA
- −$131
- Vacancy / Maint / Mgmt
- −$499
- Net cashflow
- $122
Break-even live
UW: 25.0% down · 7.5% · 30yr · 1.5% tax · 5.0% vac · 8.0% maint · 8.0% mgmt
Financing live
Cash to close
- Down payment
- $65,941
- Closing costs
- $7,913
- Reserves months
- —
- Total cash needed
- —
Loan-product check · same deal, 3 products live
Conventional
25% down · 7.5% · 30yr
- Down + closing
- —
- Monthly P&I
- —
- Monthly cashflow
- —
- DSCR
- —
- Eligible?
- —
Personal DTI + credit; lowest rate.
DSCR
20% down · 8.5% · 30yr
- Down + closing
- —
- Monthly P&I
- —
- Monthly cashflow
- —
- DSCR
- —
- Eligible?
- —
No personal income docs; deal must DSCR.
Hard money
10% down · 12.0% · 12mo
- Down + closing
- —
- Monthly P&I
- —
- Monthly cashflow
- —
- DSCR
- —
- Eligible?
- —
Short-term bridge; refi at stabilization.
Rent comps 1 comps
| Address | Beds | Baths | Sqft | Rent | $/sqft | DOM | Units | Dist |
|---|---|---|---|---|---|---|---|---|
| 10730 Sky Creek Ln Beasley, TX | 3.0–4.0 | 2.0–2.5 | 1869 | $2,375 | $1.27 | 1d | 1 | 0.65mi |
HOA detail
- Monthly dues
- $131 · $1,572/yr
- Likely covers
- internetlandscaping
Listing history 32 events
-
2026-06-18days on market $289,900 Active 32 DOM
-
2026-06-17days on market $289,900 Active 31 DOM
-
2026-06-16days on market $289,900 Active 30 DOM
-
2026-06-15days on market $289,900 Active 29 DOM
-
2026-06-13statusdays on market $289,900 Active 27 DOM
-
2026-06-08statusdays on market $289,900 Pending 25 DOM
-
2026-06-07days on market $289,900 Active 24 DOM
-
2026-06-04days on market $289,900 Active 21 DOM
-
2026-06-03days on market $289,900 Active 20 DOM
-
2026-06-02days on market $289,900 Active 19 DOM
-
2026-06-01days on market $289,900 Active 18 DOM
-
2026-05-31days on market $289,900 Active 17 DOM
-
2026-05-14$289,900 Active 724-char remark
-
2026-05-11historical
-
2026-04-22price $294,900
-
2026-04-08$289,900 Active
-
2026-04-06historical
-
2026-03-10price $289,900
-
2026-02-24price $291,900
-
2026-02-20$286,900 Active
-
2026-01-05historical
-
2025-12-02$280,900 Active
-
2025-11-24historical
-
2025-11-11historical $2,375
-
2025-10-15$280,900 Active
-
2025-10-14historical
-
2025-10-09$2,375
-
2025-10-07historical $2,375
-
2025-10-02price $280,900
-
2025-09-12price $2,375
-
2025-09-05$2,400
-
2025-09-04$277,900 Active
ⓘ Source: listings_history table (triggers on properties + properties_extension) + one-shot
backfill from property_details.listing_events for pre-trigger history.
Tax reassessment forecast TX · Resets to sale price
- Current annual tax
- $1,559 · $130/mo
- Projected year-2 tax
- $5,305 · $442/mo
- Expected delta
- +$3,746/yr (+$312/mo · 240.3%)
ⓘ Screening estimate from a state-policy table — verify with the county assessor before closing.
Nearby sold comps map
Loading sold comps map…
Walkable amenities ~0.75 mi
Loading nearby amenities…
Taxation est. · year 1
- Rental income
- $28,500
- − Mortgage interest
- −$14,775
- − Property taxes
- −$1,559
- − Insurance
- −$1,319
- − Repairs & maintenance
- −$2,280
- − Management
- −$2,280
- − HOA
- −$1,572
- − Depreciation
- −$7,673
- Taxable loss
- −$2,958
- Est. tax savings @ 24.0%
- +$710
- After-tax cash flow
- $2,176/yr
For passive investors: Depreciation is non-cash, so a rental often shows a tax loss while cash-flowing — sheltering income. Rental losses are passive: they offset passive income freely, and up to $25,000/yr can offset ordinary (W-2) income if you actively participate and your MAGI is under $100k (phasing out to $0 by $150k); unused losses carry forward. On sale, claimed depreciation is recaptured at up to 25%, and gains may owe capital-gains tax (a 1031 exchange can defer both). Figures are a year-1 estimate at your 24.0% rate — not tax advice; consult a CPA.
Schools (NCES district)
- District
- Lamar CISD
- NCES district ID
- 4826580
- Math proficiency
- 50% ▼ -12.00%
- Reading proficiency
- 53% ▼ -4.00%
- Median HH income
- $75,213
- Composite
- 46.43/100
- National rank
- #2452
- State rank
- #116 of 826 in TX
Livability — Rosenberg
- Score
- 62/100
- State rank
- #922
- US rank
- #16414
Category grades
Schools grade is shown separately in the Schools card above.
Census & demographics
- City population
- 115,151
- Population (ZIP)
- 3,232
Population outlook (Fort Bend County) Hauer SSP2
- Today (2025)
- 1,004,526 people
- By 2030
- 1,153,104 · +14.8%
- By 2040
- 1,453,718 · +44.7%
- By 2050
- 1,753,781 · +74.6%
- By 2075
- 2,455,772 · +144.5%
- By 2100
- 2,930,528 · +191.7%
Race, ethnicity, and origin ACS 2023
- Neighborhood character
- Predominantly Hispanic (67%)
- Race & ethnicity
- Hispanic / Latino 67% Two or more races 49% White 22% Black 8%
- Hispanic origin (detail)
- Mexican 54%
- Common ancestry
- Italian 2% Romanian 1%
- Foreign-born
- 3% · Canada
- Languages at home
- 76% English-only · Spanish 24%
Political lean MEDSL · Fort Bend
- 2024 margin
- Toss-up / Even · D 49.5% · R 47.9% · Other 2.6%
- 2008→2024 swing
- +4.0pp toward D · 2008: -2.4pp · 2024: 1.6pp
- All cycles
- 2024: D+1.6 2020: D+10.6 2016: D+6.6 2012: R+6.8 2008: R+2.4
Not yet ingested
- Civics
- —
Market trends
- HPI YoY
- ▲ 4.15%
- Current HPI
- 337.8236
- Rent YoY
- —
- Metro
- —
- State GDP YoY
- ▲ 3.95%
- F500 in state
- 110
Industry mix (Fortune 500 HQ in TX)
| Industry | F500 HQs | Revenue |
|---|---|---|
| Energy | 16 | $1,198B |
|
||
| Technology | 5 | $198B |
|
||
| Engineering / Construction | 4 | $72B |
|
||
| Energy Services | 3 | $60B |
|
||
| Utilities | 3 | $41B |
|
||
| Healthcare | 2 | $330B |
|
||
Price history
-99.1% since first listed23 events — show timeline
- 2026-06-11 Relisted — HARMLS
- 2026-06-08 Pending — HARMLS
- 2026-06-05 Listed for Rent $2,445 HARMLS
- 2026-05-14 Listed $289,900 HARMLS
- 2026-05-11 Listing Removed — HARMLS
- 2026-04-22 Price Changed $294,900 HARMLS
- 2026-04-08 Listed $289,900 HARMLS
- 2026-04-06 Listing Removed — HARMLS
- 2026-03-10 Price Changed $289,900 HARMLS
- 2026-02-24 Price Changed $291,900 HARMLS
- 2026-02-20 Listed $286,900 HARMLS
- 2026-01-05 Listing Removed — HARMLS
- 2025-12-02 Listed $280,900 HARMLS
- 2025-11-24 Listing Removed — HARMLS
- 2025-11-11 Rental Removed $2,375 HARMLS
- 2025-10-15 Listed $280,900 HARMLS
- 2025-10-14 Listing Removed — HARMLS
- 2025-10-09 Listed for Rent $2,375 HARMLS
- 2025-10-07 Rental Removed $2,375 HARMLS
- 2025-10-02 Price Changed $280,900 HARMLS
- 2025-09-12 Price Changed $2,375 HARMLS
- 2025-09-05 Listed for Rent $2,400 HARMLS
- 2025-09-04 Listed $277,900 HARMLS
Cash-flow waterfall
monthlySold comps — $/sqft
last 12 mo · ≤1 miLoading sold comps…