4486 S Meridian St · Indianapolis city (balance), IN
Flood risk 1/10 · Minimal
- FEMA flood zone
- X (unshaded)
- Chance of flooding over 30 yrs
- 0.0%
- Est. flood insurance / yr
- $473 – $860
Fire risk 1/10 · Minimal
- Est. fire insurance / yr
- $717 – $1,331
Heat risk 4/10 · Minor
- Hot days now (above 101°F)
- 7 days/yr
- Hot days in 30 yrs
- 19 days/yr
Wind risk 2/10 · Minimal
- Chance of severe wind over 30 yrs
- 1.0%
Air-quality risk 3/10 · Minor
- Unhealthy air days now
- 2 days/yr
- Unhealthy air days in 30 yrs
- 3 days/yr
Risk factors via First Street. Map © Google.
Why this score? — see what drove the F grade
The composite is a weighted blend of 9 inputs, each scored 0–100. Each bar is that input's sub-score; the figure is the points it added to the 100-point composite (weight × sub-score).
- Cash flow +5.3/30.0
- Schools +3.5/10.0
- Rent growth +3.4/5.0
- Livability +2.5/5.0
- Condition / age +2.5/5.0
- 1% rule +0.6/10.0
- DSCR +0.0/10.0
- ARV discount +0.0/15.0
- Appreciation +0.0/10.0
$265,000
🖨 Deal sheet (PDF) 📄 Offer letter ✓ Due diligence
Listing remarks MLS
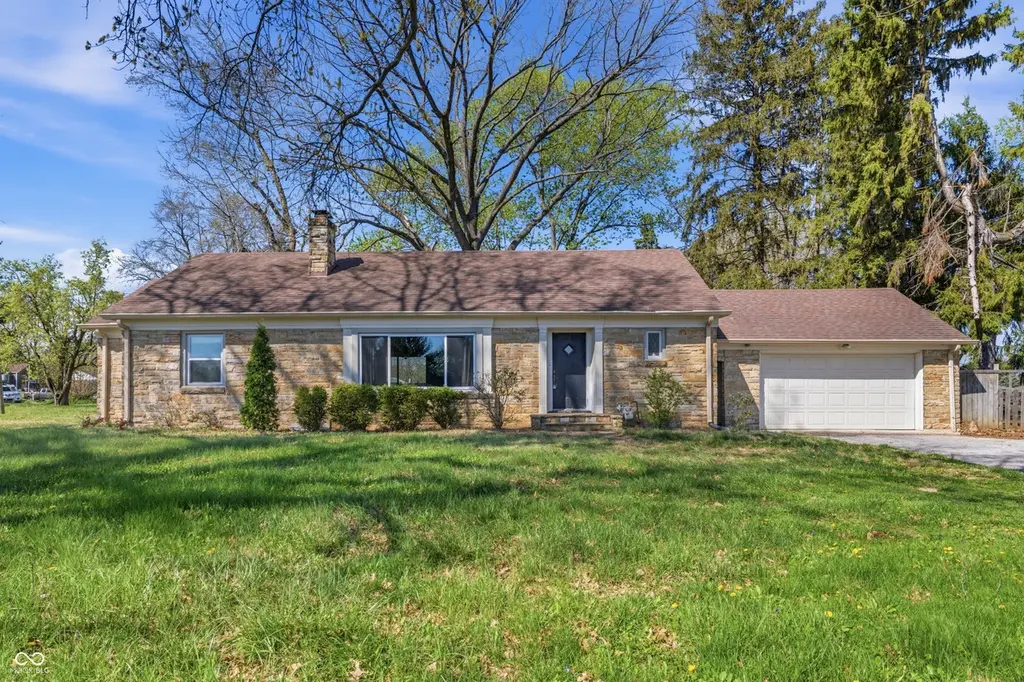
This stone ranch home has all the charm you would expect from a 1947 house, including built-in shelving in several rooms & built-in china cabinet. The arched entry-ways invite you into the spacious living room w/ fireplace & 3 BRs. New windows! Laminate flooring throughout (ready for finishing touches). Oversized garage has plenty of space for 2 cars & workshop area. Enjoy large backyard w/an open-air brick patio/firepit ready for family & friends to gather. Lots of space for gardens on this 1.149 acre lot with mature trees! This established, peaceful neighborhood has no HOA! Conventiently located minutes from downtown Indy & easy interstate access. With some TLC, this beautiful house is ready to be your home. Home is being sold AS-IS.
Key facts
- Private driveway
- Sump pump
- Private well pump
Tags
Property features AI
Exterior
- Parking: Attached garage (2 spaces)
- Utilities: Municipal sewer connected; Private water source; Solid waste service available
- Home design: Single-family residence; One story
- Construction: Stone construction; Block foundation; Crawl space foundation
- Exterior features: Privacy fence; Lot approximately 1.12 acres
Interior
- Kitchen: Gas oven; Exhaust fan; Refrigerator
- Bedrooms: 3 bedrooms on the main level
- Bathrooms: 1 full bathroom; 1 half bathroom
- Heating & cooling: Forced air heating (natural gas); Central air conditioning
- Interior features: Built-in features; Painted woodwork; Basement (finished portion present); Wood-burning fireplace
- Laundry & utility: Washer; Dryer; Water heater
Neighborhood map
What this means for you Summary
Snapshot
- This is a 3-bed/1.5-bath single-family listed at $265k.
Deal economics
- At list price, monthly cash flow is $-586 ($-7k/yr) — negative.
- To cash-flow at today's rent, offer at most $161k (39.1% below list).
- To meet the 1% rule (rent ≥ 1% of price), the offer needs to be $148k (44.0% below list).
- Recommended offer: $148k (44.0% below list) — sets the bar for 1% rule.
Location & tenants
- Location reads: area grade F — affects rentability + tenant quality, not the cash-flow math above.
- Perry Township Schools (urban): math 36% / reading 45% proficiency, ranked #138 of 301 in IN (top 46%) — families likely to look elsewhere, expect single-tenant / working-renter base with shorter leases.
- Market conditions: Rents rising (+3.5%/yr); 210 active listings in the ZIP; 17 comparable units currently listed for rent nearby; rentals at typical pace (median 17d on market — plan ~3-4 weeks tenant-placement turnaround); solid renter incomes; 1,906 units permitted in Marion County in 2024 (621 in 5+ unit buildings).
Forward outlook
- Local home prices are declining (-3.0%/yr); year-one equity from $2k of loan paydown is wiped out by about $8k of value loss. Plan a longer hold.
- Marion County population projected at +18% by 2050 — long-run rental-demand tailwind backs the buy-and-hold thesis.
Negotiation context
- Only 7 days on market — expect competitive offers; lowballing is unlikely to land.
- 4 sale attempts since 12y ago with the ask held roughly flat each time — persistent listings suggest the price (not the market) is what's stuck; bring a comps-based counter.
- Current owner paid $192k; 38% above their basis — modest negotiation headroom, anchor on the comps not their cost.
Risks & watch-outs
- Watch-outs: built in 1947 — expect roof / HVAC / electrical / plumbing capex.
Questions for the listing agent
- What do current leases actually rent for vs. the listed asking? Can we see a recent rent roll and the last 12 months of T-12 income?
- Built in 1947 — when were the roof, HVAC, electrical panel, plumbing, and water heater last replaced?
- Is there a deadline driving the sale (1031 exchange, divorce, estate, relocation)? That informs how much negotiation room exists.
- The area grade is low — what's the realistic commute time and amenity access for the typical tenant pool here? Any planned neighborhood developments (good or bad) we should know about?
- What's the average days-on-market for RENTAL listings here right now (not sales)? A rising rental-DOM trend means longer vacancies and softer asking-rent achievability than the comps imply.
- What's the recent tenant-quality profile in this submarket — average credit score on applications, eviction rate, late-payment / NSF rate, and stable-employment percentage? A property-management company in the area should have these aggregated.
- How much new for-sale + rental construction is in the pipeline within 1–3 miles? Heavy new supply typically softens prices + rents 12–24 months out; constrained supply supports both.
Investment metrics
- 1% rule
- 0.56% ✗
- Cap rate
- 3.64%
- Cash-on-cash
- -9.48%
- DSCR
- 0.58
- GRM
- 14.9
CMA / ARV
- ARV (on-the-fly)
- $216,836
- Comps found
- 12
Show comp detail 12 sales within ~0.75 mi
| Address | Dist | Beds/Ba | Sqft | Sold | Price | $/sf | Match |
|---|---|---|---|---|---|---|---|
| 109 Bixler Rd | 0.21mi | 3/1.0 | 1,395 (-3%) | 12mo | $230,000 | $165 | 73 |
| 210 Gazebo Dr | 0.23mi | 3/2.5 | 1,540 (+7%) | 3mo | $217,000 | $141 | 71 |
| 143 E Elbert St | 0.38mi | 3/2.0 | 1,340 (-7%) | 1mo | $254,000 | $190 | 69 |
| 11 Medina Ln | 0.33mi | 3/2.0 | 1,337 (-7%) | 8mo | $177,000 | $132 | 65 |
| 21 Medina Dr | 0.40mi | 3/2.0 | 1,319 (-8%) | 7mo | $150,000 | $114 | 60 |
| 37 Medina Ln | 0.34mi | 3/2.0 | 1,336 (-7%) | 14mo | $202,000 | $151 | 59 |
| 14 Medina Dr | 0.42mi | 4/2.0 (+1) | 1,548 (+8%) | 2mo | $230,000 | $149 | 59 |
| 331 W Thompson Rd | 0.53mi | 3/1.5 | 1,589 (+11%) | 2mo | $273,000 | $172 | 56 |
| 149 W Elbert St | 0.38mi | 2/2.0 (-1) | 1,584 (+10%) | 8mo | $235,000 | $148 | 51 |
| 5213 Cordes Rd | 0.74mi | 2/1.0 (-1) | 1,420 (-1%) | 16mo | $215,000 | $151 | 44 |
| 5215 Southdale Dr | 0.61mi | 2/1.5 (-1) | 1,245 (-13%) | 2mo | $223,000 | $179 | 43 |
| 5240 Southdale Dr | 0.66mi | 2/1.0 (-1) | 1,580 (+10%) | 11mo | $215,000 | $136 | 36 |
Match score weights: distance 35% · size 25% · config 20% · recency 20%. Top-matched comps best support the ARV.
Projected returns pro-forma
-3.0% appreciation · 3.46% rent growth · sell at horizon
- IRR
- -32.8%
- Equity multiple
- -0.07×
- Total profit
- $-79,625
- Equity at exit
- $39,512
- IRR
- -36.8%
- Equity multiple
- -0.55×
- Total profit
- $-114,664
- Equity at exit
- $22,912
Cash invested: $74,200 (down + closing). Projections, not guarantees.
Landlord ↔ Tenant lean methodology
- Overall (STATE)
- 90 Strongly Landlord-Friendly
- State Indiana
- 90 Strongly Landlord-Friendly · R+11
- County
- — inherits STATE
- City
- — inherits STATE
ZIP-level market 46217
- Rents YoY
- 3.5%
- Active inventory
- 210
- Price-to-rent
- 14.9×
Monthly cashflow live
- Estimated rent
- $1,484 high interval (Pro) →
- Mortgage (P&I)
- −$1,390
- Tax from tax record
- −$259 /mo · $3,106/yr
- Insurance
- −$110
- HOA
- −$0
- Vacancy / Maint / Mgmt
- −$312
- Net cashflow
- $-586
Break-even live
Sensitivity live
| Price | -10% $-436 | -5% $-511 | +0% $-586 | +5% $-661 | +10% $-736 |
|---|---|---|---|---|---|
| Rent | -10% $-704 | -5% $-645 | +0% $-586 | +5% $-528 | +10% $-469 |
| Rate | -1.0pp $-453 | -0.5pp $-519 | base $-586 | +0.5pp $-655 | +1.0pp $-725 |
UW: 25.0% down · 7.5% · 30yr · 1.5% tax · 5.0% vac · 8.0% maint · 8.0% mgmt
Financing live
Cash to close
- Down payment
- $66,250
- Closing costs
- $7,950
- Reserves months
- —
- Total cash needed
- —
Loan-product check · same deal, 3 products live
Conventional
25% down · 7.5% · 30yr
- Down + closing
- —
- Monthly P&I
- —
- Monthly cashflow
- —
- DSCR
- —
- Eligible?
- —
Personal DTI + credit; lowest rate.
DSCR
20% down · 8.5% · 30yr
- Down + closing
- —
- Monthly P&I
- —
- Monthly cashflow
- —
- DSCR
- —
- Eligible?
- —
No personal income docs; deal must DSCR.
Hard money
10% down · 12.0% · 12mo
- Down + closing
- —
- Monthly P&I
- —
- Monthly cashflow
- —
- DSCR
- —
- Eligible?
- —
Short-term bridge; refi at stabilization.
Rent comps 17 comps
| Address | Beds | Baths | Sqft | Rent | $/sqft | DOM | Units | Dist |
|---|---|---|---|---|---|---|---|---|
| 457 Monument View DR Indianapolis, IN | 1.0–3.0 | 1.0–2.0 | 966 | $1,360 | $1.41 | 24d | 1 | 0.42mi |
| 4259 Burkhart Dr Indianapolis, IN | 1.0–2.0 | 1.0 | 747 | $1,575 | $2.11 | 17d | 4 | 0.52mi |
| 4259 Burkhart Dr Unit 4257B Indianapolis, IN | 2.0 | 1.0 | 887 | $999 | $1.13 | 18d | 1 | 0.52mi |
| 4259 Burkhart Dr Unit 4264BE Indianapolis, IN | 2.0 | 1.0 | 887 | $1,149 | $1.30 | 5d | 1 | 0.52mi |
| 4259 Burkhart Dr Unit 4257C Indianapolis, IN | 2.0 | 1.0 | 949 | $999 | $1.05 | 8d | 1 | 0.52mi |
| 4100 Continental Ct Indianapolis, IN | 1.0–2.0 | 1.0–1.5 | 917 | $1,249 | $1.36 | 2d | 7 | 0.59mi |
| 4020 Hanna Village Dr Indianapolis, IN | 1.0–3.0 | 1.0–2.0 | 886 | $1,499 | $1.69 | 3d | 2 | 0.69mi |
| 724 Southfield Ct Indianapolis, IN | 3.0 | 2.5 | 1254 | $1,300 | $1.04 | 24d | 1 | 0.81mi |
| 4929 Mount Vernon Dr Indianapolis, IN | 3.0 | 1.5 | 1242 | $1,350 | $1.09 | 8d | 1 | 0.82mi |
| 717 Southfield Ct Unit 715 Indianapolis, IN | 3.0 | 1.5 | 1242 | $1,180 | $0.95 | 24d | 1 | 0.83mi |
| 5301 S Turtle Creek Dr Indianapolis, IN | 1.0–3.0 | 1.0–2.0 | 869 | $1,447 | $1.66 | 5d | 18 | 0.95mi |
| 920 E Markwood Ave Indianapolis, IN | 1.0–2.0 | 1.0 | 838 | $949 | $1.13 | 8d | 2 | 1.01mi |
| 960 Baden Manor Dr Indianapolis, IN | 3.0 | 2.0 | 1400 | $2,200 | $1.57 | 24d | 1 | 1.08mi |
| 1051 E Edwards Ave Indianapolis, IN | 2.0 | 1.0 | 896 | $1,150 | $1.28 | 44d | 1 | 1.11mi |
| 4109 Weaver Ave Indianapolis, IN | 4.0 | 2.0 | 1100 | $1,749 | $1.59 | 44d | 1 | 1.21mi |
| 3500 Bluff Rd Indianapolis, IN | 2.0 | 2.0 | 781 | $1,399 | $1.79 | 5d | 5 | 1.22mi |
| 3216 Brill Rd Indianapolis, IN | 3.0 | 2.0 | 1628 | $1,646 | $1.01 | 24d | 1 | 1.43mi |
Listing history 9 events
-
2026-04-16status Pending
-
2026-04-08$265,000 Active
-
2021-09-30soldstatus $192,000 Closed 765-char remark
Show marketing remark (765 chars)
This stone ranch home has all the charm you would expect from a 1947 house, including built-in shelving in several rooms & built-in china cabinet. The arched entry-ways invite you into the spacious living room w/ fireplace & 3 BRs. New windows! Laminate flooring throughout (ready for finishing touches). Oversized garage has plenty of space for 2 cars & workshop area. Enjoy large backyard w/an open-air brick patio/firepit ready for family & friends to gather. Lots of space for gardens on this 1.149 acre lot with mature trees! This established, peaceful neighborhood has no HOA! Conventiently located minutes from downtown Indy & easy interstate access. With some TLC, this beautiful house is ready to be your home. Home is being sold AS-IS.
-
2021-08-27status Pending 765-char remark
Show marketing remark (765 chars)
This stone ranch home has all the charm you would expect from a 1947 house, including built-in shelving in several rooms & built-in china cabinet. The arched entry-ways invite you into the spacious living room w/ fireplace & 3 BRs. New windows! Laminate flooring throughout (ready for finishing touches). Oversized garage has plenty of space for 2 cars & workshop area. Enjoy large backyard w/an open-air brick patio/firepit ready for family & friends to gather. Lots of space for gardens on this 1.149 acre lot with mature trees! This established, peaceful neighborhood has no HOA! Conventiently located minutes from downtown Indy & easy interstate access. With some TLC, this beautiful house is ready to be your home. Home is being sold AS-IS.
-
2021-08-24$178,000 Active 765-char remark
Show marketing remark (765 chars)
This stone ranch home has all the charm you would expect from a 1947 house, including built-in shelving in several rooms & built-in china cabinet. The arched entry-ways invite you into the spacious living room w/ fireplace & 3 BRs. New windows! Laminate flooring throughout (ready for finishing touches). Oversized garage has plenty of space for 2 cars & workshop area. Enjoy large backyard w/an open-air brick patio/firepit ready for family & friends to gather. Lots of space for gardens on this 1.149 acre lot with mature trees! This established, peaceful neighborhood has no HOA! Conventiently located minutes from downtown Indy & easy interstate access. With some TLC, this beautiful house is ready to be your home. Home is being sold AS-IS.
-
2014-12-12soldstatus $97,000 Sold 295-char remark
Show marketing remark (295 chars)
Full acre with mature trees and great landscaping is the perfect setting for this three bedroom stone ranch. Roof and gutters new in 2013. HVAC is 5 years old. Large living room with fireplace. Wonderful built-ins in the nook. Easy commute to interstates and downtown. Possession at closing.
-
2014-08-15historical
Show marketing remark (295 chars)
Full acre with mature trees and great landscaping is the perfect setting for this three bedroom stone ranch. Roof and gutters new in 2013. HVAC is 5 years old. Large living room with fireplace. Wonderful built-ins in the nook. Easy commute to interstates and downtown. Possession at closing.
-
2014-08-15Contingent - Backup Pending Other 295-char remark
Show marketing remark (295 chars)
Full acre with mature trees and great landscaping is the perfect setting for this three bedroom stone ranch. Roof and gutters new in 2013. HVAC is 5 years old. Large living room with fireplace. Wonderful built-ins in the nook. Easy commute to interstates and downtown. Possession at closing.
-
2014-01-15$119,900
ⓘ Source: listings_history table (triggers on properties + properties_extension) + one-shot
backfill from property_details.listing_events for pre-trigger history.
Tax reassessment forecast IN · Partial reset (capped growth)
- Current annual tax
- $3,106 · $259/mo
- Projected year-2 tax
- $3,106 · $259/mo
- Expected delta
- $0/yr ($0/mo · 0.0%)
ⓘ Screening estimate from a state-policy table — verify with the county assessor before closing.
Climate risk First Street
- Flood 1/10 Low FEMA zone X (unshaded) · 0% chance over 30 yrs
- Wildfire 1/10 Low
- Heat 4/10 Moderate 7 d/yr ≥101°F today · 19 d/yr by 30 yrs out
- Wind 2/10 Low 100% chance of damaging wind over 30 yrs
- Air quality 3/10 Moderate 2 unhealthy d/yr today · 3 by 30 yrs out
Nearby sold comps map
Loading sold comps map…
Walkable amenities ~0.75 mi
Loading nearby amenities…
Taxation est. · year 1
- Rental income
- $17,809
- − Mortgage interest
- −$14,844
- − Property taxes
- −$3,106
- − Insurance
- −$1,325
- − Repairs & maintenance
- −$1,425
- − Management
- −$1,425
- − Depreciation
- −$7,709
- Taxable loss
- −$12,024
- Est. tax savings @ 24.0%
- +$2,886
- After-tax cash flow
- $-4,152/yr
For passive investors: Depreciation is non-cash, so a rental often shows a tax loss while cash-flowing — sheltering income. Rental losses are passive: they offset passive income freely, and up to $25,000/yr can offset ordinary (W-2) income if you actively participate and your MAGI is under $100k (phasing out to $0 by $150k); unused losses carry forward. On sale, claimed depreciation is recaptured at up to 25%, and gains may owe capital-gains tax (a 1031 exchange can defer both). Figures are a year-1 estimate at your 24.0% rate — not tax advice; consult a CPA.
Schools (NCES district)
- District
- Perry Township Schools
- NCES district ID
- 1808820
- Math proficiency
- 36% ▼ -13.00%
- Reading proficiency
- 45% ▼ -6.00%
- Median HH income
- $47,170
- Composite
- 34.61/100
- National rank
- #5153
- State rank
- #138 of 301 in IN
Livability — Indianapolis city (balance)
No livability data for this city. (Only ~50 U.S. cities are tracked.)
Census & demographics
- Census place
- Indianapolis city (balance), IN
- County
- Marion County · 998,460 people
- City population
- 881,119
- Metro
- Indianapolis-Carmel-Anderson, IN
- Population (ZIP)
- 36,917
- Household income
- $92,029
- Rent vs Own
- Severe rent burden
- 472.0
Population outlook (Marion County) Hauer SSP2
- Today (2025)
- 1,025,572 people
- By 2030
- 1,065,727 · +3.9%
- By 2040
- 1,141,577 · +11.3%
- By 2050
- 1,208,920 · +17.9%
- By 2075
- 1,367,288 · +33.3%
- By 2100
- 1,438,201 · +40.2%
Race, ethnicity, and origin ACS 2023
- Neighborhood character
- Diverse neighborhood (Simpson 0.60)
- Race & ethnicity
- White 59% Asian 20% Black 10% Hispanic / Latino 8% Two or more races 6%
- Hispanic origin (detail)
- Mexican 6%
- Common ancestry
- Lithuanian 3% Romanian 2% Iranian 1%
- Foreign-born
- 17% · Philippines, Canada, China
- Languages at home
- 76% English-only · Other Asian/Pacific 15% Spanish 6% Other Indo-European 1%
Political lean MEDSL · Marion
- 2024 margin
- Strong D (+27.7) · D 63.0% · R 35.3% · Other 1.7%
- 2008→2024 swing
- -0.7pp no change · 2008: 28.4pp · 2024: 27.7pp
- All cycles
- 2024: D+27.7 2020: D+29.1 2016: D+22.8 2012: D+22.2 2008: D+28.4
Not yet ingested
- Civics
- —
Market trends
- HPI YoY
- ▼ -221.18%
- Current HPI
- 223.147
- Rent YoY
- ▲ 3.46%
- Metro
- Indianapolis-Carmel-Anderson, IN
- State GDP YoY
- ▲ 2.90%
- F500 in state
- 18
Industry mix (Fortune 500 HQ in IN)
| Industry | F500 HQs | Revenue |
|---|---|---|
| Industrial Machinery | 2 | $37B |
|
||
| Healthcare | 1 | $177B |
|
||
| Pharmaceuticals | 1 | $45B |
|
||
| Metals / Steel | 1 | $18B |
|
||
| Agriculture | 1 | $17B |
|
||
| Packaging | 1 | $12B |
|
||
Price history
+121.0% since first listed9 events — show timeline
- 2026-04-16 Pending — MIBOR as Distributed by MLS Grid
- 2026-04-08 Listed $265,000 MIBOR as Distributed by MLS Grid
- 2021-09-30 Sold (MLS) $192,000 MIBOR as Distributed by MLS Grid
- 2021-08-27 Pending — MIBOR as Distributed by MLS Grid
- 2021-08-24 Listed $178,000 MIBOR as Distributed by MLS Grid
- 2014-12-12 Sold (MLS) $97,000 MIBOR as Distributed by MLS Grid
- 2014-08-15 Listing Removed — MIBOR as Distributed by MLS Grid
- 2014-08-15 Listed — MIBOR as Distributed by MLS Grid
- 2014-01-15 Listed $119,900 MIBOR as Distributed by MLS Grid
Property tax history
+6.5%/yrLatest (2025): $3,106 · +7.3% YoY. Source: county tax records.
Cash-flow waterfall
monthlySold comps — $/sqft
last 12 mo · ≤1 miLoading sold comps…