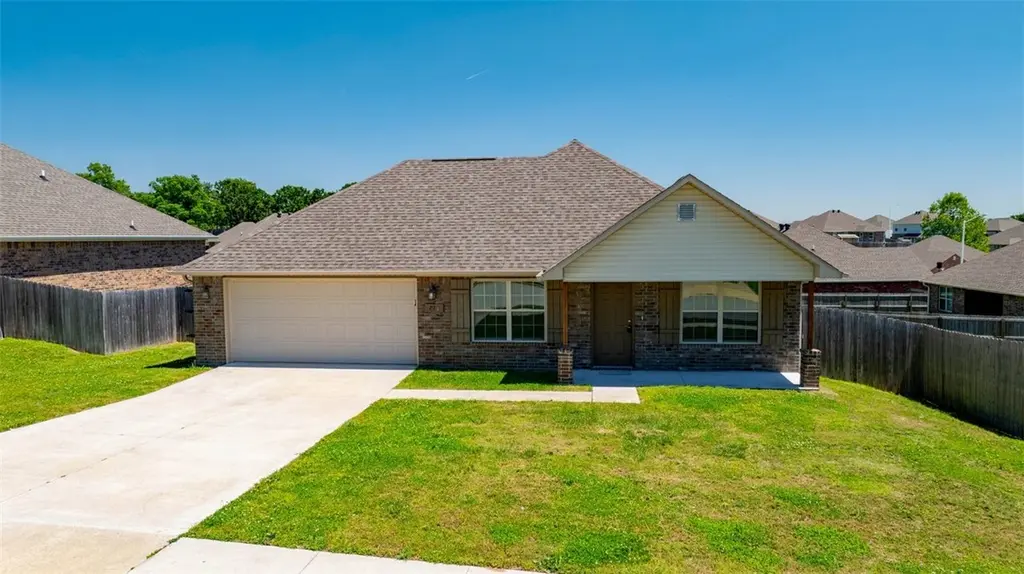
716 Vista St · Gentry, AR
Flood risk 1/10 · Minimal
- FEMA flood zone
- X (unshaded)
- Chance of flooding over 30 yrs
- 0.0%
- Est. flood insurance / yr
- $507 – $1,088
Fire risk 6/10 · Moderate
- Est. fire insurance / yr
- $1,499 – $2,785
Heat risk 5/10 · Moderate
- Hot days now (above 105°F)
- 7 days/yr
- Hot days in 30 yrs
- 20 days/yr
Wind risk 2/10 · Minimal
- Chance of severe wind over 30 yrs
- 2.0%
Air-quality risk 2/10 · Minimal
- Unhealthy air days now
- 0 days/yr
- Unhealthy air days in 30 yrs
- 1 days/yr
Risk factors via First Street. Map © Google.
Why this score? — see what drove the D grade
The composite is a weighted blend of 9 inputs, each scored 0–100. Each bar is that input's sub-score; the figure is the points it added to the 100-point composite (weight × sub-score).
- Appreciation +10.0/10.0
- ARV discount +9.1/15.0
- Cash flow +6.9/30.0
- Livability +3.4/5.0
- Schools +3.3/10.0
- Rent growth +2.5/5.0
- Condition / age +2.5/5.0
- 1% rule +1.2/10.0
- DSCR +1.1/10.0
$270,000
🖨 Deal sheet 📄 Offer letter ✓ Due diligence
Listing remarks MLS
BEAUTIFUL HOUSE!
Key facts
- Walk-in closet
- Backyard
- 9,583 sq ft lot
Tags
Property features AI
Finance
- HOA & community: Monthly association fee
Exterior
- Parking: Attached garage; 1 covered space
- Security: Security system; Fire alarm; Smoke detectors
- Utilities: Electricity available
- Home design: Single-story home; Resale (less than 25 years old)
- Construction: Brick construction; Architectural shingle roof; Slab foundation
- Exterior features: Concrete driveway; Back yard fencing; Cleared lot; Shared road frontage
Interior
- Kitchen: Dishwasher; Microwave; Refrigerator; Plumbed for ice maker; Electric water heater
- Flooring: Laminate
- Bathrooms: 2 full bathrooms
- Heating & cooling: Central heating; Central air conditioning
- Interior features: Ceiling fans; Granite counters; Pantry; Walk-in closet(s); Window treatments; Blinds
- Laundry & utility: Washer hookup; Dryer hookup
Neighborhood map
What this means for you Summary
Snapshot
- This is a 4-bed/2.0-bath single-family listed at $270k.
Deal economics
- At list price, monthly cash flow is $-407 ($-5k/yr) — negative.
- To cash-flow at today's rent, offer at most $198k (26.6% below list).
- To meet the 1% rule (rent ≥ 1% of price), the offer needs to be $169k (37.6% below list).
- Recommended offer: $169k (37.6% below list) — sets the bar for 1% rule.
- Cap rate 4.5% vs local median 2.8% in Gentry — top-decile yield for the area; either an underpriced asset or a hidden risk that comps aren't pricing in. Stress-test before assuming the spread holds.
Location & tenants
- Location reads 67/100 on livability (#95 in AR) — a middle-class / working-renter tenant base. Strengths: cost of living A+, housing A+, crime B+; Watch: schools C-, employment D+, amenities F.
- Gentry School District (town): math 36% / reading 41% proficiency, ranked #71 of 238 in AR (top 30%) — families likely to look elsewhere, expect single-tenant / working-renter base with shorter leases.
- Market conditions: 255 active listings in the ZIP; 2 comparable units currently listed for rent nearby; 4,359 units permitted in Benton County in 2024 (402 in 5+ unit buildings).
Forward outlook
- In year one you build about $29k of equity ($2k loan paydown + $27k appreciation (10.0% local appreciation)).
- Benton County population projected at +56% by 2050 — long-run rental-demand tailwind backs the buy-and-hold thesis.
- By year 2, paydown + projected appreciation supports a ~$46k cash-out refi (75% LTV) — recoverable capital for the next deal without selling this one.
Negotiation context
- Only 8 days on market — expect competitive offers; lowballing is unlikely to land.
- 2 sale attempts since 4y ago with the ask held roughly flat each time — persistent listings suggest the price (not the market) is what's stuck; bring a comps-based counter.
Risks & watch-outs
- Climate carrying-cost: major wildfire risk; extreme-heat days projected 7→20/yr by 2055 (HVAC capex compounding) — expect insurance premiums to compound above CPI over the hold.
Questions for the listing agent
- What do current leases actually rent for vs. the listed asking? Can we see a recent rent roll and the last 12 months of T-12 income?
- Is there a deadline driving the sale (1031 exchange, divorce, estate, relocation)? That informs how much negotiation room exists.
- The area grade is low — what's the realistic commute time and amenity access for the typical tenant pool here? Any planned neighborhood developments (good or bad) we should know about?
- What's the average days-on-market for RENTAL listings here right now (not sales)? A rising rental-DOM trend means longer vacancies and softer asking-rent achievability than the comps imply.
- What's the recent tenant-quality profile in this submarket — average credit score on applications, eviction rate, late-payment / NSF rate, and stable-employment percentage? A property-management company in the area should have these aggregated.
- How much new for-sale + rental construction is in the pipeline within 1–3 miles? Heavy new supply typically softens prices + rents 12–24 months out; constrained supply supports both.
Investment metrics
- 1% rule
- 0.62% ✗
- Cap rate
- 4.49%
- Cash-on-cash
- -6.45%
- DSCR
- 0.71
- GRM
- 13.3
CMA / ARV
- ARV (on-the-fly)
- $280,208
- Comps found
- 12
Show comp detail 12 sales within ~0.75 mi
| Address | Dist | Beds/Ba | Sqft | Sold | Price | $/sf | Match |
|---|---|---|---|---|---|---|---|
| 816 Brook St | 0.10mi | 4/2.0 | 1,654 (-2%) | 2mo | $259,000 | $157 | 90 |
| 828 Brook St | 0.12mi | 4/2.0 | 1,638 (-3%) | 1mo | $250,000 | $153 | 89 |
| 812 Saddlebrook St | 0.11mi | 4/2.0 | 1,654 (-2%) | 4mo | $255,000 | $154 | 88 |
| 821 Brook St | 0.09mi | 4/2.0 | 1,634 (-3%) | 8mo | $279,900 | $171 | 84 |
| 1017 Rachel St | 0.23mi | 4/2.0 | 1,668 (-1%) | 4mo | $259,000 | $155 | 84 |
| 2000 Maple Ct | 0.21mi | 4/2.0 | 1,626 (-4%) | 1mo | $280,000 | $172 | 83 |
| 1012 Vista Dr | 0.21mi | 4/2.0 | 1,626 (-4%) | 3mo | $255,000 | $157 | 81 |
| 2009 Morgan Cir | 0.07mi | 4/2.0 | 1,531 (-9%) | 3mo | $254,000 | $166 | 79 |
| 2012 Ridge Dr | 0.10mi | 4/2.0 | 1,543 (-9%) | 8mo | $253,509 | $164 | 74 |
| 817 Brook St | 0.08mi | 3/2.0 (-1) | 1,488 (-12%) | 2mo | $257,000 | $173 | 70 |
| 2124 Carlisle St | 0.10mi | 3/2.5 (-1) | 1,498 (-11%) | 4mo | $254,500 | $170 | 66 |
| 2121 Carlisle St | 0.12mi | 3/2.0 (-1) | 1,490 (-12%) | 7mo | $260,000 | $174 | 64 |
Match score weights: distance 35% · size 25% · config 20% · recency 20%. Top-matched comps best support the ARV.
Projected returns pro-forma
10.0% appreciation · 3.0% rent growth · sell at horizon
- IRR
- 19.7%
- Equity multiple
- 2.60×
- Total profit
- $121,105
- Equity at exit
- $243,237
- IRR
- 18.1%
- Equity multiple
- 5.99×
- Total profit
- $376,888
- Equity at exit
- $524,551
Cash invested: $75,600 (down + closing). Projections, not guarantees.
Landlord ↔ Tenant lean methodology
- Overall (STATE)
- 92 Strongly Landlord-Friendly
- State Arkansas
- 92 Strongly Landlord-Friendly · R+14
- County
- — inherits STATE
- City
- — inherits STATE
ZIP-level market 72734
- Home prices YoY
- 12.2%
- Active inventory
- 255
- Price-to-rent
- 13.3×
Monthly cashflow live
- Estimated rent
- $1,686 medium interval (Pro) →
- Mortgage (P&I)
- −$1,416
- Tax from tax record
- −$210 /mo · $2,516/yr
- Insurance
- −$112
- HOA
- −$0
- Vacancy / Maint / Mgmt
- −$354
- Net cashflow
- $-407
Break-even live
UW: 25.0% down · 7.5% · 30yr · 1.5% tax · 5.0% vac · 8.0% maint · 8.0% mgmt
Financing live
Cash to close
- Down payment
- $67,500
- Closing costs
- $8,100
- Reserves months
- —
- Total cash needed
- —
Loan-product check · same deal, 3 products live
Conventional
25% down · 7.5% · 30yr
- Down + closing
- —
- Monthly P&I
- —
- Monthly cashflow
- —
- DSCR
- —
- Eligible?
- —
Personal DTI + credit; lowest rate.
DSCR
20% down · 8.5% · 30yr
- Down + closing
- —
- Monthly P&I
- —
- Monthly cashflow
- —
- DSCR
- —
- Eligible?
- —
No personal income docs; deal must DSCR.
Hard money
10% down · 12.0% · 12mo
- Down + closing
- —
- Monthly P&I
- —
- Monthly cashflow
- —
- DSCR
- —
- Eligible?
- —
Short-term bridge; refi at stabilization.
Rent comps 2 comps
| Address | Beds | Baths | Sqft | Rent | $/sqft | DOM | Units | Dist |
|---|---|---|---|---|---|---|---|---|
| 2013 Ridge St Gentry, AR | 4.0 | 2.0 | 1646 | $1,682 | $1.02 | 13d | 1 | 0.08mi |
| 2129 Brown Bear Ln Gentry, AR | 4.0 | 2.0 | 1664 | $1,695 | $1.02 | 14d | 1 | 0.32mi |
Listing history 5 events
-
2026-05-22status Pending
-
2026-05-14$270,000 Active
-
2022-02-09soldstatus $567,430
-
2022-02-03soldstatus $283,715 16-char remark
Show marketing remark (16 chars)
BEAUTIFUL HOUSE!
-
2022-02-03$283,715 16-char remark
Show marketing remark (16 chars)
BEAUTIFUL HOUSE!
ⓘ Source: listings_history table (triggers on properties + properties_extension) + one-shot
backfill from property_details.listing_events for pre-trigger history.
Tax reassessment forecast AR · Resets to sale price
- Current annual tax
- $2,516 · $210/mo
- Projected year-2 tax
- $2,516 · $210/mo
- Expected delta
- $0/yr ($0/mo · 0.0%)
ⓘ Screening estimate from a state-policy table — verify with the county assessor before closing.
Climate risk First Street
- Flood 1/10 Low FEMA zone X (unshaded) · 0% chance over 30 yrs
- Wildfire 6/10 Major
- Heat 5/10 Major 7 d/yr ≥105°F today · 20 d/yr by 30 yrs out
- Wind 2/10 Low 2% chance of damaging wind over 30 yrs
- Air quality 2/10 Low 0 unhealthy d/yr today · 1 by 30 yrs out
Nearby sold comps map
Loading sold comps map…
Walkable amenities ~0.75 mi
Loading nearby amenities…
Taxation est. · year 1
- Rental income
- $20,226
- − Mortgage interest
- −$15,124
- − Property taxes
- −$2,516
- − Insurance
- −$1,350
- − Repairs & maintenance
- −$1,618
- − Management
- −$1,618
- − Depreciation
- −$7,855
- Taxable loss
- −$9,855
- Est. tax savings @ 24.0%
- +$2,365
- After-tax cash flow
- $-2,513/yr
For passive investors: Depreciation is non-cash, so a rental often shows a tax loss while cash-flowing — sheltering income. Rental losses are passive: they offset passive income freely, and up to $25,000/yr can offset ordinary (W-2) income if you actively participate and your MAGI is under $100k (phasing out to $0 by $150k); unused losses carry forward. On sale, claimed depreciation is recaptured at up to 25%, and gains may owe capital-gains tax (a 1031 exchange can defer both). Figures are a year-1 estimate at your 24.0% rate — not tax advice; consult a CPA.
Schools (NCES district)
- District
- Gentry School District
- NCES district ID
- 0506540
- Math proficiency
- 36% ▼ -15.00%
- Reading proficiency
- 41% ▼ -5.00%
- Median HH income
- $45,160
- Composite
- 32.77/100
- National rank
- #5629
- State rank
- #71 of 238 in AR
Livability — Gentry
- Score
- 67/100
- State rank
- #95
- US rank
- #10230
Category grades
Schools grade is shown separately in the Schools card above.
Census & demographics
- Census place
- Gentry, AR
- Population (ZIP)
- 8,385
Population outlook (Benton County) Hauer SSP2
- Today (2025)
- 318,683 people
- By 2030
- 353,481 · +10.9%
- By 2040
- 425,280 · +33.4%
- By 2050
- 497,239 · +56.0%
- By 2075
- 662,114 · +107.8%
- By 2100
- 776,431 · +143.6%
Race, ethnicity, and origin ACS 2023
- Neighborhood character
- Diverse neighborhood (Simpson 0.62)
- Race & ethnicity
- White 60% Two or more races 25% Hispanic / Latino 13% Asian 5% Native American 2% Pacific Islander 1%
- Hispanic origin (detail)
- Mexican 6%
- Common ancestry
- Serbian 2% Lithuanian 1% Subsaharan African 1%
- Foreign-born
- 6% · Canada
- Languages at home
- 89% English-only · Other Asian/Pacific 6% Spanish 4% German/W. Germanic 1%
Political lean MEDSL · Benton
- 2024 margin
- Strong R (+27.0) · D 35.2% · R 62.1% · Other 2.7%
- 2008→2024 swing
- +9.6pp toward D · 2008: -36.5pp · 2024: -27.0pp
- All cycles
- 2024: R+27.0 2020: R+26.4 2016: R+34.9 2012: R+40.4 2008: R+36.5
Not yet ingested
- Civics
- —
Market trends
- HPI YoY
- ▲ 44.03%
- Current HPI
- 405.1448
- Rent YoY
- —
- Metro
- —
- State GDP YoY
- ▲ 3.80%
- F500 in state
- 10
Industry mix (Fortune 500 HQ in AR)
| Industry | F500 HQs | Revenue |
|---|---|---|
| Retail | 1 | $681B |
|
||
| Food / Agriculture | 1 | $53B |
|
||
| Retail / Energy | 1 | $22B |
|
||
| Transportation / Logistics | 1 | $12B |
|
||
| Energy | 1 | $4B |
|
||
Price history
-4.8% since first listed5 events — show timeline
- 2026-05-22 Pending — NWARMLS
- 2026-05-14 Listed $270,000 NWARMLS
- 2022-02-09 Sold (Public Records) $567,430 Public Records
- 2022-02-03 Listed $283,715 NWARMLS
- 2022-02-03 Sold (MLS) $283,715 NWARMLS
Property tax history
+44.2%/yrLatest (2025): $2,516 · +14.0% YoY. Source: county tax records.
Cash-flow waterfall
monthlySold comps — $/sqft
last 12 mo · ≤1 miLoading sold comps…