 🏷️ Likely Rental
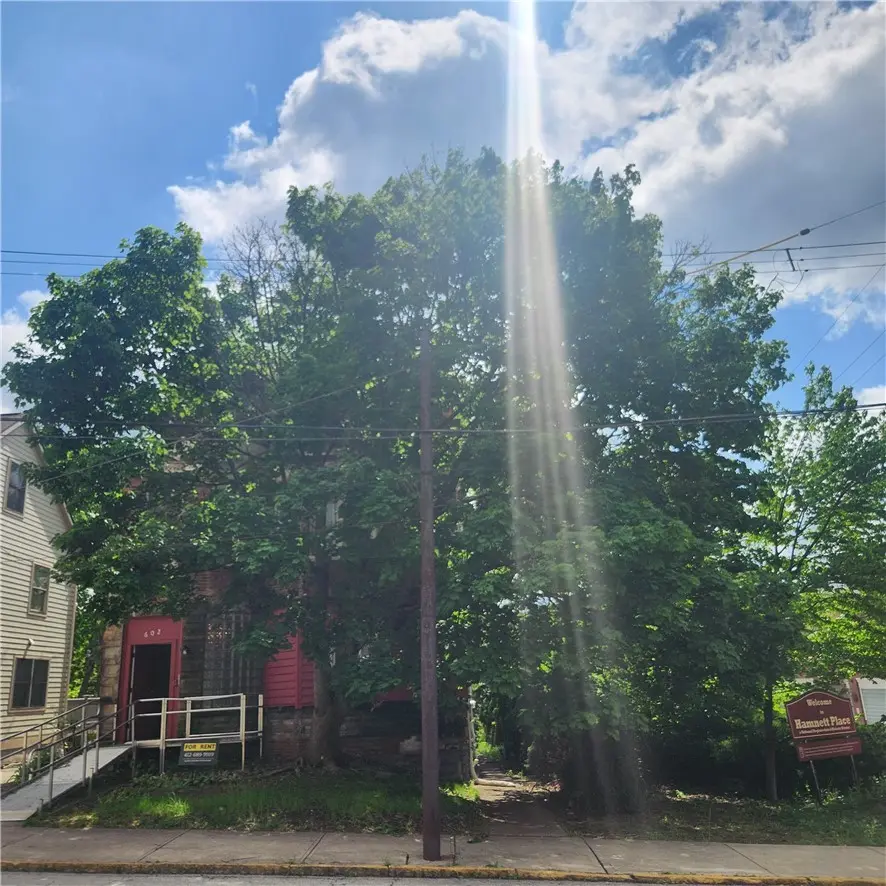
602 Mulberry St · Wilkinsburg, PA
Flood risk 9/10 · Severe
- FEMA flood zone
- X (unshaded)
- Chance of flooding over 30 yrs
- 0.99%
- Est. flood insurance / yr
- $473 – $860
Fire risk 1/10 · Minimal
- Est. fire insurance / yr
- $511 – $949
Heat risk 4/10 · Minor
- Hot days now (above 98°F)
- 7 days/yr
- Hot days in 30 yrs
- 18 days/yr
Wind risk 2/10 · Minimal
- Chance of severe wind over 30 yrs
- 0.0%
Air-quality risk 4/10 · Minor
- Unhealthy air days now
- 4 days/yr
- Unhealthy air days in 30 yrs
- 5 days/yr
Risk factors via First Street. Map © Google.
Why this score? — see what drove the D grade
The composite is a weighted blend of 9 inputs, each scored 0–100. Each bar is that input's sub-score; the figure is the points it added to the 100-point composite (weight × sub-score).
- Cash flow +15.0/30.0
- ARV discount +7.5/15.0
- 1% rule +5.0/10.0
- DSCR +5.0/10.0
- Livability +3.8/5.0
- Rent growth +3.5/5.0
- Condition / age +2.5/5.0
- Schools +1.5/10.0
- Appreciation +0.0/10.0
$1,110
🖨 Deal sheet (PDF) 📄 Offer letter ✓ Due diligence
Multi-family units
County records classify this as Multi-Family (2-4 Unit). Listing-text estimate: 1 unit. estimate disagrees with records
Listing remarks MLS
INVESTORS DELIGHT 3 UNIT VICTORIAN LOCATED IN THE HISTORICAL DISTRICT. SEPERATE GAS & ELECTRIC. NEW BREAKER BOXS, NEW ROOF, FRESHLY PAINTED MANY UPDATES. MONEYMAKER MUST SEE BRING OFFERS
Key facts
- Victorian charm
- Community garden
- 3,441 sq ft lot
Tags
Property features AI
Finance
- Financial info: Assessed value reported; Annual taxes reported
Exterior
- Parking: On-street parking
- Home design: Brick construction
- Construction: Composition roof; Brick exterior
- Exterior features: On-street parking
Neighborhood map
What this means for you Summary
Snapshot
- This is a 6-bed/3.0-bath multifamily listed at $1k.
Deal economics
- At list price, monthly cash flow is $3k ($30k/yr) — positive.
- The deal already cash-flows at list — no discount required.
- Meets the 1% rule at list price ($3k rent vs $1k).
- Cap rate 2810.4% vs local median 10.6% in Wilkinsburg — top-decile yield for the area; either an underpriced asset or a hidden risk that comps aren't pricing in. Stress-test before assuming the spread holds.
Location & tenants
- Location reads 76/100 on livability (#411 in PA, #3,754 nationally) — a middle-class / working-renter tenant base. Strengths: commute A+, cost of living A+, housing A+; Watch: schools D+, health & safety D+, crime F.
- Wilkinsburg Borough SD (suburban): math 14% / reading 23% proficiency, ranked #503 of 539 in PA (top 93%) — low school quality limits family demand, transient renter base, plan for 1-2y turnover; 96% free/reduced lunch — lower-income household profile, screen leases tightly.
- Market conditions: Rents rising (+3.9%/yr); 117 active listings in the ZIP; 1 comparable units currently listed for rent nearby; 2,996 units permitted in Allegheny County in 2024 (1,588 in 5+ unit buildings).
- At $3,293/mo this rent would consume 72% of the median local household income ($55k/yr) (locally 1933% of renters already pay >50% of income on rent) — very limited rent-growth headroom before tenants either downsize or default.
Forward outlook
- Local home prices are declining (-3.0%/yr); year-one equity from $8 of loan paydown is wiped out by about $33 of value loss. Plan a longer hold.
- At projected returns (-3.0% appreciation + 3.9% rent growth), your $311 cash investment doubles in ~1 year — after that, you're playing with house money.
Negotiation context
- Only 2 days on market — expect competitive offers; lowballing is unlikely to land.
- 3 sale attempts since 22y ago with the ask held roughly flat each time — persistent listings suggest the price (not the market) is what's stuck; bring a comps-based counter.
Risks & watch-outs
- Watch-outs: flood insurance adds $56/mo; built in 1910 — expect roof / HVAC / electrical / plumbing capex.
- Climate carrying-cost: severe flood risk — expect insurance premiums to compound above CPI over the hold.
Questions for the listing agent
- Built in 1910 — when were the roof, HVAC, electrical panel, plumbing, and water heater last replaced?
- What's the actual annual flood-insurance premium (NFIP or private), and is the property in a SFHA with mandatory coverage?
- Is there a deadline driving the sale (1031 exchange, divorce, estate, relocation)? That informs how much negotiation room exists.
- Schools are D-rated, which usually means shorter tenancies and higher turnover. Who's the typical renter profile here, and what's been the actual vacancy rate?
- Crime grade is F in this area — have there been break-ins, vandalism, or insurance claims at this property in the last 3 years? What carrier currently insures it and at what premium?
- The area grade is low — what's the realistic commute time and amenity access for the typical tenant pool here? Any planned neighborhood developments (good or bad) we should know about?
- What's the average days-on-market for RENTAL listings here right now (not sales)? A rising rental-DOM trend means longer vacancies and softer asking-rent achievability than the comps imply.
- What's the recent tenant-quality profile in this submarket — average credit score on applications, eviction rate, late-payment / NSF rate, and stable-employment percentage? A property-management company in the area should have these aggregated.
- How much new apartment / multifamily construction is in the pipeline within 1–3 miles? Heavy new supply (>2% of stock underway) typically softens rents 12–24 months out; light construction supports rent growth.
Investment metrics
- 1% rule
- 296.67% ✓
- Cap rate
- 2810.40%
- Cash-on-cash
- 10014.67%
- DSCR
- 446.60
- GRM
- 0.0
CMA / ARV
- ARV (on-the-fly)
- $66,194
- Comps found
- 1
Show comp detail 1 sale within ~0.75 mi
| Address | Dist | Beds/Ba | Sqft | Sold | Price | $/sf | Match |
|---|---|---|---|---|---|---|---|
| 419 Rebecca Ave | 0.31mi | 5/3.0 (-1) | 3,022 (+5%) | 21mo | $70,000 | $23 | 55 |
Match score weights: distance 35% · size 25% · config 20% · recency 20%. Top-matched comps best support the ARV.
Projected returns pro-forma
-3.0% appreciation · 3.86% rent growth · sell at horizon
- IRR
- —
- Equity multiple
- 530.09×
- Total profit
- $164,441
- Equity at exit
- $166
- IRR
- —
- Equity multiple
- 1171.21×
- Total profit
- $363,700
- Equity at exit
- $96
Cash invested: $311 (down + closing). Projections, not guarantees.
Landlord ↔ Tenant lean methodology
- Overall (STATE)
- 62 Landlord-Friendly
- State Pennsylvania
- 62 Landlord-Friendly · EVEN
- County
- — inherits STATE
- City
- — inherits STATE
ZIP-level market 15221
- Home prices YoY
- -32.3%
- Rents YoY
- 3.9%
- Active inventory
- 117
- Price-to-rent
- 0.1×
Monthly cashflow live
- Estimated rent
- $3,293 high interval (Pro) →
- Mortgage (P&I)
- −$6
- Tax est. 1.5%
- −$1 /mo · $17/yr
- Insurance
- −$0
- Flood insurance flood zone
- −$56 /mo · $666/yr
- HOA
- −$0
- Vacancy / Maint / Mgmt
- −$692
- Net cashflow
- $2,538
Break-even live
Sensitivity live
| Price | -10% $2,539 | -5% $2,539 | +0% $2,538 | +5% $2,538 | +10% $2,537 |
|---|---|---|---|---|---|
| Rent | -10% $2,278 | -5% $2,408 | +0% $2,538 | +5% $2,668 | +10% $2,798 |
| Rate | -1.0pp $2,539 | -0.5pp $2,539 | base $2,538 | +0.5pp $2,538 | +1.0pp $2,538 |
3-unit breakdown (identical units grouped — click to expand)
| Units | Beds | Baths | Est. rent |
|---|---|---|---|
| 3× units | 1 | 1 | $3,294 |
| #1 | 1 | 1 | $1,098 |
| #2 | 1 | 1 | $1,098 |
| #3 | 1 | 1 | $1,098 |
| Total (3 units) | $3,293 | ||
UW: 25.0% down · 7.5% · 30yr · 1.5% tax · 5.0% vac · 8.0% maint · 8.0% mgmt
Financing live
Cash to close
- Down payment
- $278
- Closing costs
- $33
- Reserves months
- —
- Total cash needed
- —
Loan-product check · same deal, 3 products live
Conventional
25% down · 7.5% · 30yr
- Down + closing
- —
- Monthly P&I
- —
- Monthly cashflow
- —
- DSCR
- —
- Eligible?
- —
Personal DTI + credit; lowest rate.
DSCR
20% down · 8.5% · 30yr
- Down + closing
- —
- Monthly P&I
- —
- Monthly cashflow
- —
- DSCR
- —
- Eligible?
- —
No personal income docs; deal must DSCR.
Hard money
10% down · 12.0% · 12mo
- Down + closing
- —
- Monthly P&I
- —
- Monthly cashflow
- —
- DSCR
- —
- Eligible?
- —
Short-term bridge; refi at stabilization.
Rent comps 1 comps
| Address | Beds | Baths | Sqft | Rent | $/sqft | DOM | Units | Dist |
|---|---|---|---|---|---|---|---|---|
| 7138 Race St Pittsburgh, PA | 5.0 | 2.0 | 2500 | $2,500 | $1.00 | 2d | 1 | 1.44mi |
Listing history 3 events
-
2026-06-05days on market $1,110 Active 2 DOM
-
2026-06-02remarks 675-char remark
-
2026-06-02$1,110 Active 1 DOM
ⓘ Source: listings_history table (triggers on properties + properties_extension) + one-shot
backfill from property_details.listing_events for pre-trigger history.
Climate risk First Street
- Flood 9/10 Extreme FEMA zone X (unshaded) · 99% chance over 30 yrs
- Wildfire 1/10 Low
- Heat 4/10 Moderate 7 d/yr ≥98°F today · 18 d/yr by 30 yrs out
- Wind 2/10 Low 0% chance of damaging wind over 30 yrs
- Air quality 4/10 Moderate 4 unhealthy d/yr today · 5 by 30 yrs out
Nearby sold comps map
Loading sold comps map…
Walkable amenities ~0.75 mi
Loading nearby amenities…
Taxation est. · year 1
- Rental income
- $39,516
- − Mortgage interest
- −$62
- − Property taxes
- −$17
- − Insurance
- −$672
- − Repairs & maintenance
- −$3,161
- − Management
- −$3,161
- − Depreciation
- −$32
- Taxable income
- $32,410
- Est. tax owed @ 24.0%
- −$7,778
- After-tax cash flow
- $22,681/yr
For passive investors: Depreciation is non-cash, so a rental often shows a tax loss while cash-flowing — sheltering income. Rental losses are passive: they offset passive income freely, and up to $25,000/yr can offset ordinary (W-2) income if you actively participate and your MAGI is under $100k (phasing out to $0 by $150k); unused losses carry forward. On sale, claimed depreciation is recaptured at up to 25%, and gains may owe capital-gains tax (a 1031 exchange can defer both). Figures are a year-1 estimate at your 24.0% rate — not tax advice; consult a CPA.
Schools (NCES district)
- District
- Wilkinsburg Borough SD
- NCES district ID
- 4226370
- Math proficiency
- 14% ▼ -8.00%
- Reading proficiency
- 23% ▼ -9.00%
- Median HH income
- $32,204
- Composite
- 14.94/100
- National rank
- #9368
- State rank
- #503 of 539 in PA
Livability — Wilkinsburg
- Score
- 76/100
- State rank
- #411
- US rank
- #3754
Category grades
Schools grade is shown separately in the Schools card above.
Census & demographics
- Census place
- Wilkinsburg, PA
- County
- Allegheny County · 1,022,028 people
- City population
- 29,513
- Metro
- Pittsburgh, PA
- Population (ZIP)
- 29,374
- Household income
- $55,028
- Rent vs Own
- Severe rent burden
- 1933.0
Population outlook (Allegheny County) Hauer SSP2
- Today (2025)
- 1,250,282 people
- By 2030
- 1,256,482 · +0.5%
- By 2040
- 1,256,318 · +0.5%
- By 2050
- 1,244,169 · -0.5%
- By 2075
- 1,197,693 · -4.2%
- By 2100
- 1,093,187 · -12.6%
Race, ethnicity, and origin ACS 2023
- Neighborhood character
- Diverse neighborhood (Simpson 0.60)
- Race & ethnicity
- White 47% Black 43% Two or more races 7% Hispanic / Latino 4% Asian 1%
- Common ancestry
- Romanian 4% Lithuanian 2% Serbian 1%
- Foreign-born
- 4% · Canada, South Korea, China
- Languages at home
- 93% English-only · Spanish 2% French/Haitian/Cajun 1% Other Indo-European 1%
Political lean MEDSL · Allegheny
- 2024 margin
- Strong D (+20.3) · D 59.7% · R 39.4%
- 2008→2024 swing
- +4.8pp toward D · 2008: 15.5pp · 2024: 20.3pp
- All cycles
- 2024: D+20.3 2020: D+20.4 2016: D+16.4 2012: D+14.4 2008: D+15.5
Not yet ingested
- Civics
- —
Market trends
- HPI YoY
- ▼ -109.77%
- Current HPI
- 230.0486
- Rent YoY
- ▲ 3.86%
- Metro
- Pittsburgh, PA
- State GDP YoY
- ▲ 1.68%
- F500 in state
- 34
Industry mix (Fortune 500 HQ in PA)
| Industry | F500 HQs | Revenue |
|---|---|---|
| Healthcare | 2 | $309B |
|
||
| Insurance | 2 | $27B |
|
||
| Telecommunications / Media | 1 | $124B |
|
||
| Industrial Distribution | 1 | $22B |
|
||
| Financial Services | 1 | $20B |
|
||
| Chemicals / Materials | 1 | $18B |
|
||
Price history
-95.1% since first listed7 events — show timeline
- 2026-06-02 Listed $1,110 West Penn MLS
- 2011-04-28 Listed $79,900 West Penn MLS
- 2005-01-20 Sold (Public Records) $66,000 Public Records
- 2004-11-13 Sold (MLS) $66,000 West Penn MLS
- 2004-07-10 Listed $69,900 West Penn MLS
- 1988-04-27 Sold (Public Records) $25,000 Public Records
- 1977-07-13 Sold (Public Records) $22,500 Public Records
Property tax history
-0.6%/yrLatest (2026): $1,202 · +3.0% YoY. Source: county tax records.
Cash-flow waterfall
monthlySold comps — $/sqft
last 12 mo · ≤1 miLoading sold comps…