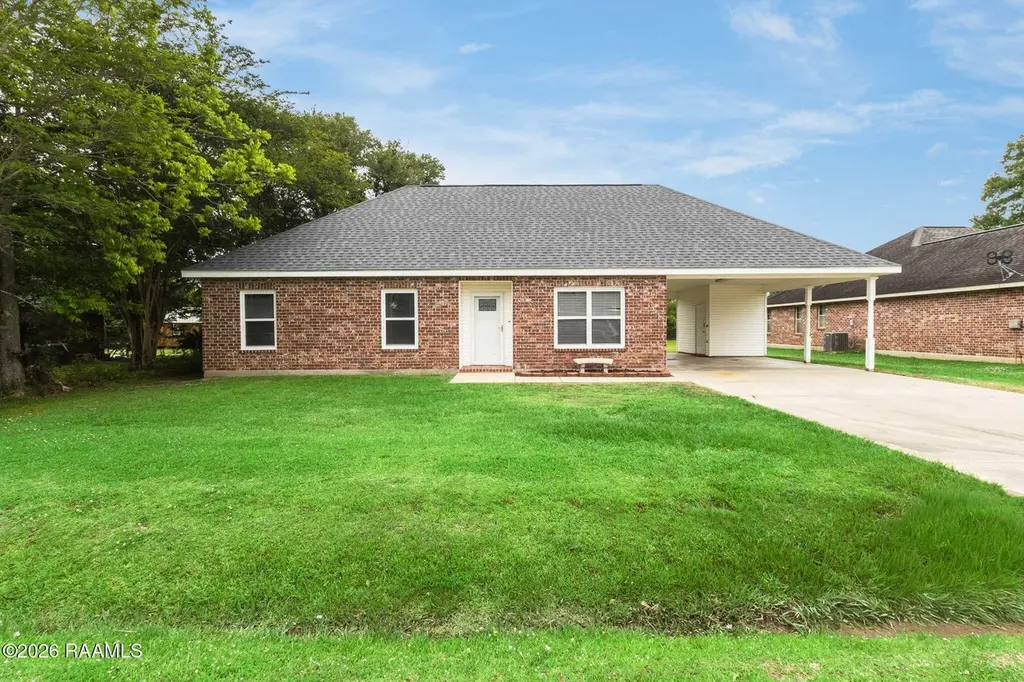
130 Herlil Cir · Cankton, LA
Flood risk 1/10 · Minimal
- FEMA flood zone
- X (shaded)
- Chance of flooding over 30 yrs
- 0.0%
- Est. flood insurance / yr
- $507 – $1,088
Fire risk 3/10 · Minor
- Est. fire insurance / yr
- $1,269 – $2,357
Heat risk 9/10 · Severe
- Hot days now (above 109°F)
- 7 days/yr
- Hot days in 30 yrs
- 21 days/yr
Wind risk 9/10 · Severe
- Chance of severe wind over 30 yrs
- 99.0%
Air-quality risk 2/10 · Minimal
- Unhealthy air days now
- 1 days/yr
- Unhealthy air days in 30 yrs
- 1 days/yr
Risk factors via First Street. Map © Google.
Why this score? — see what drove the C- grade
The composite is a weighted blend of 9 inputs, each scored 0–100. Each bar is that input's sub-score; the figure is the points it added to the 100-point composite (weight × sub-score).
- Cash flow +18.3/30.0
- ARV discount +15.0/15.0
- DSCR +5.7/10.0
- 1% rule +4.0/10.0
- Schools +3.6/10.0
- Livability +3.0/5.0
- Rent growth +2.5/5.0
- Condition / age +2.5/5.0
- Appreciation +0.0/10.0
$179,000
🖨 Deal sheet 📄 Offer letter ✓ Due diligence
Listing remarks MLS
Sold prior to listing
Key facts
- Newer roof
- Large yard
- Flood zone x
Tags
Property features AI
Exterior
- Parking: Covered carport for 2 vehicles; 2 total parking spaces
- Utilities: Public sewer; Electric service by SLEMCO
- Home design: Single family residence
- Construction: Brick veneer and vinyl siding with frame construction
- Exterior features: Composition roof; City street and paved road frontage
Interior
- Bathrooms: 2 full bathrooms
- Interior features: Central heating; Central air
- Laundry & utility: Washer hookup; Electric dryer hookup
Neighborhood map
What this means for you Summary
Snapshot
- This is a 3-bed/2.0-bath single-family listed at $179k.
Deal economics
- At list price, monthly cash flow is $162 ($2k/yr) — positive.
- The deal already cash-flows at list — no discount required.
- To meet the 1% rule (rent ≥ 1% of price), the offer needs to be $161k (10.2% below list).
- Recommended offer: $161k (10.2% below list) — sets the bar for 1% rule.
Location & tenants
- Location reads 60/100 on livability (#251 in LA) — a middle-class / working-renter tenant base. Strengths: cost of living A+, health & safety A+; Watch: employment D, crime F, amenities F.
- Lafayette Parish (urban): math 38% / reading 46% proficiency, ranked #19 of 98 in LA (top 19%) — families likely to look elsewhere, expect single-tenant / working-renter base with shorter leases.
- Zoned schools: Ossun Elementary School (math 35% / reading 38%, grade F, #269 of 646 statewide, top 42%, 519 students, 76% FRL); Carencro Middle School (math 18% / reading 28%, grade F, #145 of 218 statewide, top 69%, 665 students, 75% FRL); Carencro High School (math 30% / reading 29%, grade F, #127 of 265 statewide, top 49%, 1,096 students, 69% FRL) — zoned schools average 73% FRL vs 56% district-wide (17 pts higher); higher-poverty schools than district average — tighter screening recommended.
- Zoned-school proficiency averages 30% at this address vs 42% district-wide (-12 pts) — the specific schools serving this property underperform the Lafayette Parish average; the district grade overstates school quality for this exact location.
- Market conditions: 280 active listings in the ZIP; 1,585 units permitted in Lafayette Parish in 2024 (10 in 5+ unit buildings).
Forward outlook
- Local home prices are declining (-3.0%/yr); year-one equity from $1k of loan paydown is wiped out by about $5k of value loss. Plan a longer hold.
- Lafayette County population projected at +34% by 2050 — long-run rental-demand tailwind backs the buy-and-hold thesis.
Negotiation context
- It's been on market 48 days — a 3% lower offer ($174k) is reasonable based on typical stale-listing flexibility.
- 5 sale attempts since 17y ago with the ask held roughly flat each time — persistent listings suggest the price (not the market) is what's stuck; bring a comps-based counter.
- Current owner paid $122k; 47% above their basis — modest negotiation headroom, anchor on the comps not their cost.
Risks & watch-outs
- Climate carrying-cost: severe wind risk, 99% chance of damaging wind over 30y; extreme-heat days projected 7→21/yr by 2055 (HVAC capex compounding) — expect insurance premiums to compound above CPI over the hold.
Questions for the listing agent
- It's been on market 48 days. Have you received any prior offers? Is the seller open to a 10% concession, seller financing, or rate buy-down credit?
- Is there a deadline driving the sale (1031 exchange, divorce, estate, relocation)? That informs how much negotiation room exists.
- Schools are B-rated — typically a magnet for longer-tenancy family renters. What's the average tenant stay here, and is there a school-zone premium baked into asking?
- Crime grade is F in this area — have there been break-ins, vandalism, or insurance claims at this property in the last 3 years? What carrier currently insures it and at what premium?
- What's the average days-on-market for RENTAL listings here right now (not sales)? A rising rental-DOM trend means longer vacancies and softer asking-rent achievability than the comps imply.
- What's the recent tenant-quality profile in this submarket — average credit score on applications, eviction rate, late-payment / NSF rate, and stable-employment percentage? A property-management company in the area should have these aggregated.
- How much new for-sale + rental construction is in the pipeline within 1–3 miles? Heavy new supply typically softens prices + rents 12–24 months out; constrained supply supports both.
Investment metrics
- 1% rule
- 0.90% ✗
- Cap rate
- 7.38%
- Cash-on-cash
- 3.89%
- DSCR
- 1.17
- GRM
- 9.3
CMA / ARV
- ARV (median comp)
- $234,529
- List price
- $179,000
- Delta
- -23.68%
- Verdict
- UNDERPRICED
- Comps
- 20 within 1.0 mi
Show comp detail 6 sales within ~0.75 mi
| Address | Dist | Beds/Ba | Sqft | Sold | Price | $/sf | Match |
|---|---|---|---|---|---|---|---|
| 117 Collins Dr | 0.67mi | 3/1.0 | 1,107 (-9%) | 4mo | $123,500 | $112 | 47 |
| 107 Spanish Oak Dr | 0.71mi | 3/2.0 | 1,324 (+9%) | 6mo | $225,000 | $170 | 46 |
| 126 Lindsey Cir | 0.61mi | 3/2.0 | 1,367 (+13%) | 10mo | $153,000 | $112 | 42 |
| 108 Lindsey Cir | 0.73mi | 3/1.0 | 1,180 (-3%) | 23mo | $110,000 | $93 | 38 |
| 117 Old Heritage Ln | 0.59mi | 3/2.0 | 1,390 (+14%) | 15mo | $230,000 | $165 | 36 |
| 127 Collins Dr | 0.60mi | 3/1.0 | 1,100 (-9%) | 20mo | $138,000 | $125 | 36 |
Match score weights: distance 35% · size 25% · config 20% · recency 20%. Top-matched comps best support the ARV.
Projected returns pro-forma
-3.0% appreciation · 3.0% rent growth · sell at horizon
- IRR
- -10.2%
- Equity multiple
- 0.63×
- Total profit
- $-18,720
- Equity at exit
- $26,689
- IRR
- -0.9%
- Equity multiple
- 0.94×
- Total profit
- $-3,210
- Equity at exit
- $15,477
Cash invested: $50,120 (down + closing). Projections, not guarantees.
Landlord ↔ Tenant lean methodology
- Overall (STATE)
- 90 Strongly Landlord-Friendly
- State Louisiana
- 90 Strongly Landlord-Friendly · R+12
- County
- — inherits STATE
- City
- — inherits STATE
ZIP-level market 70520
- Home prices YoY
- -17.6%
- Active inventory
- 280
- Price-to-rent
- 9.3×
Monthly cashflow live
- Estimated rent
- $1,608 medium interval (Pro) →
- Mortgage (P&I)
- −$939
- Tax from tax record
- −$94 /mo · $1,134/yr
- Insurance
- −$75
- HOA
- −$0
- Vacancy / Maint / Mgmt
- −$338
- Net cashflow
- $162
Break-even live
UW: 25.0% down · 7.5% · 30yr · 1.5% tax · 5.0% vac · 8.0% maint · 8.0% mgmt
Financing live
Cash to close
- Down payment
- $44,750
- Closing costs
- $5,370
- Reserves months
- —
- Total cash needed
- —
Loan-product check · same deal, 3 products live
Conventional
25% down · 7.5% · 30yr
- Down + closing
- —
- Monthly P&I
- —
- Monthly cashflow
- —
- DSCR
- —
- Eligible?
- —
Personal DTI + credit; lowest rate.
DSCR
20% down · 8.5% · 30yr
- Down + closing
- —
- Monthly P&I
- —
- Monthly cashflow
- —
- DSCR
- —
- Eligible?
- —
No personal income docs; deal must DSCR.
Hard money
10% down · 12.0% · 12mo
- Down + closing
- —
- Monthly P&I
- —
- Monthly cashflow
- —
- DSCR
- —
- Eligible?
- —
Short-term bridge; refi at stabilization.
Listing history 26 events
-
2026-06-18days on market $179,000 Active 48 DOM
-
2026-06-17days on market $179,000 Active 47 DOM
-
2026-06-16days on market $179,000 Active 46 DOM
-
2026-06-15days on market $179,000 Active 45 DOM
-
2026-06-14days on market $179,000 Active 43 DOM
-
2026-06-13days on market $179,000 Active 42 DOM
-
2026-06-10days on market $179,000 Active 40 DOM
-
2026-06-09days on market $179,000 Active 39 DOM
-
2026-06-08days on market $179,000 Active 38 DOM
-
2026-06-07days on market $179,000 Active 37 DOM
-
2026-06-05days on market $179,000 Active 34 DOM
-
2026-06-03days on market $179,000 Active 33 DOM
-
2026-06-02days on market $179,000 Active 32 DOM
-
2026-06-01days on market $179,000 Active 31 DOM
-
2026-05-31days on market $179,000 Active 30 DOM
-
2026-05-30days on market $179,000 Active 29 DOM
-
2026-04-30$185,000 Active 313-char remark
-
2022-06-13$178,000
-
2015-07-17soldstatus $121,900
Show marketing remark (21 chars)
Sold prior to listing
-
2015-07-16$121,900
Show marketing remark (21 chars)
Sold prior to listing
-
2015-07-07soldstatus $121,900
-
2015-06-25soldstatus $95,000
-
2014-09-26$121,900
-
2010-05-28soldstatus $135,000
-
2010-05-27soldstatus $135,000
-
2009-11-03$139,000
ⓘ Source: listings_history table (triggers on properties + properties_extension) + one-shot
backfill from property_details.listing_events for pre-trigger history.
Tax reassessment forecast LA · Resets to sale price
- Current annual tax
- $1,134 · $94/mo
- Projected year-2 tax
- $1,134 · $94/mo
- Expected delta
- $0/yr ($0/mo · 0.0%)
ⓘ Screening estimate from a state-policy table — verify with the county assessor before closing.
Climate risk First Street
- Flood 1/10 Low FEMA zone X (shaded) · 0% chance over 30 yrs
- Wildfire 3/10 Moderate
- Heat 9/10 Extreme 7 d/yr ≥109°F today · 21 d/yr by 30 yrs out
- Wind 9/10 Extreme 99% chance of damaging wind over 30 yrs
- Air quality 2/10 Low 1 unhealthy d/yr today · 1 by 30 yrs out
Nearby sold comps map
Loading sold comps map…
Walkable amenities ~0.75 mi
Loading nearby amenities…
Taxation est. · year 1
- Rental income
- $19,293
- − Mortgage interest
- −$10,027
- − Property taxes
- −$1,134
- − Insurance
- −$895
- − Repairs & maintenance
- −$1,543
- − Management
- −$1,543
- − Depreciation
- −$5,207
- Taxable loss
- −$1,057
- Est. tax savings @ 24.0%
- +$254
- After-tax cash flow
- $2,202/yr
For passive investors: Depreciation is non-cash, so a rental often shows a tax loss while cash-flowing — sheltering income. Rental losses are passive: they offset passive income freely, and up to $25,000/yr can offset ordinary (W-2) income if you actively participate and your MAGI is under $100k (phasing out to $0 by $150k); unused losses carry forward. On sale, claimed depreciation is recaptured at up to 25%, and gains may owe capital-gains tax (a 1031 exchange can defer both). Figures are a year-1 estimate at your 24.0% rate — not tax advice; consult a CPA.
Schools (NCES district)
- District
- Lafayette Parish
- NCES district ID
- 2200870
- Math proficiency
- 38% ▼ -32.00%
- Reading proficiency
- 46% ▼ -24.00%
- Median HH income
- $50,238
- Composite
- 36.15/100
- National rank
- #4741
- State rank
- #19 of 98 in LA
Livability — Cankton
- Score
- 60/100
- State rank
- #251
- US rank
- #18822
Category grades
Schools grade is shown separately in the Schools card above.
Census & demographics
- Population (ZIP)
- 20,134
Population outlook (Lafayette County) Hauer SSP2
- Today (2025)
- 280,930 people
- By 2030
- 301,092 · +7.2%
- By 2040
- 339,456 · +20.8%
- By 2050
- 375,156 · +33.5%
- By 2075
- 451,672 · +60.8%
- By 2100
- 497,203 · +77.0%
Race, ethnicity, and origin ACS 2023
- Neighborhood character
- Diverse neighborhood (Simpson 0.56)
- Race & ethnicity
- White 58% Black 32% Two or more races 5% Hispanic / Latino 3% Asian 2%
- Common ancestry
- Lithuanian 13% Scotch-Irish 2% Italian 1%
- Foreign-born
- 2% · Canada
- Languages at home
- 92% English-only · French/Haitian/Cajun 5% Spanish 1% Other Indo-European 1%
Political lean MEDSL · Lafayette
- 2024 margin
- Solid R (+31.4) · D 33.5% · R 64.8% · Other 1.7%
- 2008→2024 swing
- -0.1pp no change · 2008: -31.3pp · 2024: -31.4pp
- All cycles
- 2024: R+31.4 2020: R+28.7 2016: R+33.6 2012: R+33.7 2008: R+31.3
Not yet ingested
- Civics
- —
Market trends
- HPI YoY
- ▼ -33.62%
- Current HPI
- 157.0194
- Rent YoY
- —
- Metro
- —
- State GDP YoY
- ▲ 3.29%
- F500 in state
- 10
Industry mix (Fortune 500 HQ in LA)
| Industry | F500 HQs | Revenue |
|---|---|---|
| Telecommunications | 2 | $23B |
|
||
| Utilities | 1 | $12B |
|
||
| Wholesale / Distribution | 1 | $5B |
|
||
| Advertising | 1 | $2B |
|
||
Price history
+28.8% since first listed11 events — show timeline
- 2026-05-28 Price Changed $179,000 AcadianaMLS
- 2026-04-30 Listed $185,000 AcadianaMLS
- 2022-06-13 Listed $178,000 AcadianaMLS
- 2015-07-17 Sold (MLS) $121,900 AcadianaMLS
- 2015-07-16 Listed $121,900 AcadianaMLS
- 2015-07-07 Sold (Public Records) $121,900 Public Records
- 2015-06-25 Sold (MLS) $95,000 AcadianaMLS
- 2014-09-26 Listed $121,900 AcadianaMLS
- 2010-05-28 Sold (Public Records) $135,000 Public Records
- 2010-05-27 Sold (MLS) $135,000 AcadianaMLS
- 2009-11-03 Listed $139,000 AcadianaMLS
Property tax history
+9.8%/yrLatest (2025): $1,134 · -1.3% YoY. Source: county tax records.
Cash-flow waterfall
monthlySold comps — $/sqft
last 12 mo · ≤1 miLoading sold comps…