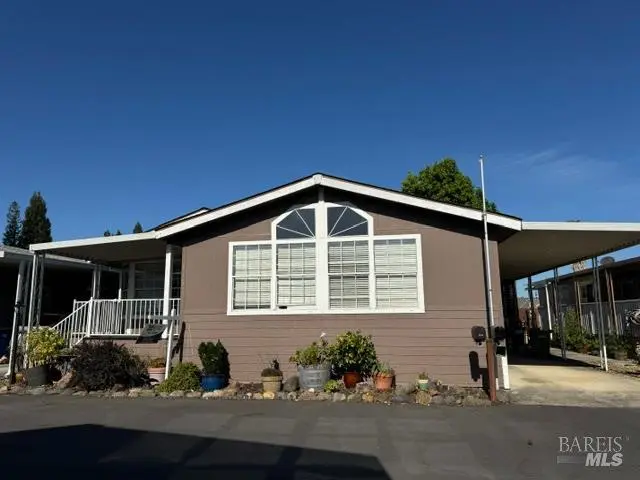
8149 D St · Windsor, CA
Flood risk 6/10 · Moderate
- FEMA flood zone
- X (unshaded)
- Chance of flooding over 30 yrs
- 0.68%
- Est. flood insurance / yr
- $507 – $1,088
Fire risk 5/10 · Moderate
- Est. fire insurance / yr
- $659 – $1,223
Heat risk 4/10 · Minor
- Hot days now (above 92°F)
- 7 days/yr
- Hot days in 30 yrs
- 16 days/yr
Wind risk 1/10 · Minimal
- Chance of severe wind over 30 yrs
- —
Air-quality risk 9/10 · Severe
- Unhealthy air days now
- 18 days/yr
- Unhealthy air days in 30 yrs
- 20 days/yr
Risk factors via First Street. Map © Google.
Why this score? — see what drove the C grade
The composite is a weighted blend of 9 inputs, each scored 0–100. Each bar is that input's sub-score; the figure is the points it added to the 100-point composite (weight × sub-score).
- Cash flow +26.2/30.0
- DSCR +8.9/10.0
- 1% rule +7.0/10.0
- ARV discount +5.1/15.0
- Livability +3.6/5.0
- Rent growth +2.5/5.0
- Schools +2.5/10.0
- Condition / age +2.5/5.0
- Appreciation +0.0/10.0
$318,000
🖨 Deal sheet (PDF) 📄 Offer letter ✓ Due diligence
Listing remarks
Welcome to this spacious 1989 manufactured home offering approximately 1960 square feet of comfortable living space. This three bedroom, two bath home features a practical floor plan with generous living areas and plenty of storage throughout. The open living, dining, and family room areas are filled with natural light from the many windows throughout the home, creating a bright and inviting atmosphere. The home is carpeted throughout the living room and bedrooms, with carpeting installed less than 10 years ago. The kitchen, bathrooms, and laundry room feature durable linoleum flooring for easy maintenance. In the kitchen, Formica countertops provide a functional workspace with ample cabine
Key facts
- Soaking tub
- Walk-in shower
- Formica countertops
Tags
Property features AI
Finance
- Financial info: Land lease amount $929
- HOA & community: No homeowners association
Exterior
- Parking: 2 parking spaces; Attached parking; Off-street parking; RV storage
- Security: Carbon monoxide detector; Smoke detector
- Utilities: Individual gas meter; Public sewer
- Home design: Manufactured in park (triple wide); Land-lease community; Located in a senior community
- Construction: Composition roof; Skirt: Other; Manufacturer: Fleetwood; Make: Barrington
- Exterior features: Covered deck; Carport awning; Patio awning; Shed(s); Workshop
Interior
- Kitchen: Gas cook top; Disposal; Pantry closet; Breakfast area
- Bedrooms: 3 bedrooms
- Flooring: Carpet; Linoleum; Vinyl
- Bathrooms: 2 full bathrooms; Double sinks; Sunken tub
- Heating & cooling: Central heating; Ceiling fans
- Interior features: Cathedral ceiling; One fireplace with gas piping and gas starter; Updated/remodeled condition
- Laundry & utility: Washer and dryer included; Gas water heater; Double-strapped water heater
Neighborhood map
What this means for you Summary
Snapshot
- This is a 3-bed/2.0-bath manufactured listed at $318k.
Deal economics
- At list price, monthly cash flow is $810 ($10k/yr) — positive.
- The deal already cash-flows at list — no discount required.
- Meets the 1% rule at list price ($4k rent vs $318k).
- Recommended offer: $308k (3.0% below list) — sets the bar for market timing.
- Cap rate 9.3% vs local median 3.1% in Windsor — top-decile yield for the area; either an underpriced asset or a hidden risk that comps aren't pricing in. Stress-test before assuming the spread holds.
Location & tenants
- Location reads 71/100 on livability (#210 in CA) — a middle-class / working-renter tenant base. Strengths: employment A+, housing A+, health & safety A+; Watch: amenities F, commute F, cost of living F.
- Windsor Unified (suburban): math 25% / reading 25% proficiency, ranked #362 of 517 in CA (top 70%) — low school quality limits family demand, transient renter base, plan for 1-2y turnover.
- Zoned schools: Mattie Washburn Elementary (514 students, 49% FRL); Windsor Middle (725 students, 50% FRL); Windsor High (1,603 students, 46% FRL) — zoned schools average 48% FRL vs 33% district-wide (16 pts higher); higher-poverty schools than district average — tighter screening recommended.
- Market conditions: 106 active listings in the ZIP; 8 comparable units currently listed for rent nearby; rentals lingering (median 46d on market — plan ~5-8 weeks vacancy on turnover, expect pricing pressure); 50% of comp listings sitting > 30 days — soft ceiling on asking rent; high-income renter base; 1,039 units permitted in Sonoma County in 2024 (185 in 5+ unit buildings).
- This rent runs 34% of the median local income ($134k/yr) — at the standard rent-burdened threshold; future hikes will face affordability resistance.
Forward outlook
- Local home prices are declining (-3.0%/yr); year-one equity from $2k of loan paydown is wiped out by about $10k of value loss. Plan a longer hold.
- Sonoma County population projected at +8% by 2050 — modest demand growth; plan on rents tracking national, not racing it.
- At projected returns (-3.0% appreciation + 3.0% rent growth), your $89k cash investment doubles in ~10 years — after that, you're playing with house money.
Negotiation context
- It's been on market 36 days — a 3% lower offer ($308k) is reasonable based on typical stale-listing flexibility.
Risks & watch-outs
- Climate carrying-cost: major flood risk; moderate wildfire risk — expect insurance premiums to compound above CPI over the hold.
Questions for the listing agent
- It's been on market 36 days. Have you received any prior offers? Is the seller open to a 3% concession, seller financing, or rate buy-down credit?
- Is there a deadline driving the sale (1031 exchange, divorce, estate, relocation)? That informs how much negotiation room exists.
- What's the average days-on-market for RENTAL listings here right now (not sales)? A rising rental-DOM trend means longer vacancies and softer asking-rent achievability than the comps imply.
- What's the recent tenant-quality profile in this submarket — average credit score on applications, eviction rate, late-payment / NSF rate, and stable-employment percentage? A property-management company in the area should have these aggregated.
- How much new for-sale + rental construction is in the pipeline within 1–3 miles? Heavy new supply typically softens prices + rents 12–24 months out; constrained supply supports both.
Investment metrics
- 1% rule
- 1.20% ✓
- Cap rate
- 9.35%
- Cash-on-cash
- 10.91%
- DSCR
- 1.49
- GRM
- 7.0
CMA / ARV
- ARV (on-the-fly)
- $301,840
- Comps found
- 5
Show comp detail 5 sales within ~0.75 mi
| Address | Dist | Beds/Ba | Sqft | Sold | Price | $/sf | Match |
|---|---|---|---|---|---|---|---|
| 8330 Blue Spruce Way | 0.20mi | 3/2.0 | 1,824 (-7%) | 17mo | $210,000 | $115 | 65 |
| 1056 Maple Dr | 0.08mi | 2/2.0 (-1) | 1,750 (-11%) | 12mo | $425,000 | $243 | 63 |
| 830 Joshua Dr | 0.20mi | 2/2.0 (-1) | 1,780 (-9%) | 13mo | $349,000 | $196 | 60 |
| 1047 Maple Dr | 0.08mi | 2/2.0 (-1) | 1,680 (-14%) | 13mo | $173,000 | $103 | 57 |
| 8178 Willow St #8178 | 0.12mi | 3/2.0 | 1,678 (-14%) | 21mo | $259,000 | $154 | 53 |
Match score weights: distance 35% · size 25% · config 20% · recency 20%. Top-matched comps best support the ARV.
Projected returns pro-forma
-3.0% appreciation · 3.0% rent growth · sell at horizon
- IRR
- 0.0%
- Equity multiple
- 1.00×
- Total profit
- $104
- Equity at exit
- $47,415
- IRR
- 9.7%
- Equity multiple
- 1.75×
- Total profit
- $66,737
- Equity at exit
- $27,495
Cash invested: $89,040 (down + closing). Projections, not guarantees.
Landlord ↔ Tenant lean methodology
- Overall (STATE)
- 18 Strongly Tenant-Friendly
- State California
- 18 Strongly Tenant-Friendly · D+13
- County
- — inherits STATE
- City
- — inherits STATE
ZIP-level market 95492
- Active inventory
- 106
- Price-to-rent
- 7.0×
Monthly cashflow live
- Estimated rent
- $3,807 high interval (Pro) →
- Mortgage (P&I)
- −$1,668
- Tax est. 1.5%
- −$398 /mo · $4,770/yr
- Insurance
- −$132
- HOA
- −$0
- Vacancy / Maint / Mgmt
- −$799
- Net cashflow
- $810
Break-even live
Sensitivity live
| Price | -10% $1,030 | -5% $920 | +0% $810 | +5% $700 | +10% $590 |
|---|---|---|---|---|---|
| Rent | -10% $509 | -5% $659 | +0% $810 | +5% $960 | +10% $1,111 |
| Rate | -1.0pp $970 | -0.5pp $891 | base $810 | +0.5pp $727 | +1.0pp $644 |
UW: 25.0% down · 7.5% · 30yr · 1.5% tax · 5.0% vac · 8.0% maint · 8.0% mgmt
Financing live
Cash to close
- Down payment
- $79,500
- Closing costs
- $9,540
- Reserves months
- —
- Total cash needed
- —
Loan-product check · same deal, 3 products live
Conventional
25% down · 7.5% · 30yr
- Down + closing
- —
- Monthly P&I
- —
- Monthly cashflow
- —
- DSCR
- —
- Eligible?
- —
Personal DTI + credit; lowest rate.
DSCR
20% down · 8.5% · 30yr
- Down + closing
- —
- Monthly P&I
- —
- Monthly cashflow
- —
- DSCR
- —
- Eligible?
- —
No personal income docs; deal must DSCR.
Hard money
10% down · 12.0% · 12mo
- Down + closing
- —
- Monthly P&I
- —
- Monthly cashflow
- —
- DSCR
- —
- Eligible?
- —
Short-term bridge; refi at stabilization.
Rent comps 8 comps
| Address | Beds | Baths | Sqft | Rent | $/sqft | DOM | Units | Dist |
|---|---|---|---|---|---|---|---|---|
| 7924 Ferrari Way Windsor, CA | 3.0 | 2.0 | 1476 | $3,400 | $2.30 | 45d | 1 | 0.54mi |
| 185 Johnson St Windsor, CA | 3.0 | 2.5 | 1796 | $3,300 | $1.84 | 45d | 1 | 0.65mi |
| 236 Windsor River Rd Windsor, CA | 3.0 | 2.5 | 1925 | $3,100 | $1.61 | 15d | 1 | 0.69mi |
| 776 McClelland Dr Windsor, CA | 2.0 | 2.5 | 1344 | $2,900 | $2.16 | 45d | 1 | 0.77mi |
| 1145 Shiloh Rd Windsor, CA | 3.0 | 1.0–2.0 | 776 | $4,395 | $5.66 | 9d | 14 | 0.94mi |
| 904 Bond Pl Windsor, CA | 3.0 | 3.0 | 1587 | $1,275 | $0.80 | 45d | 1 | 1.01mi |
| 9609 Lord Dr Windsor, CA | 4.0 | 3.0 | 2264 | $4,200 | $1.86 | 15d | 1 | 1.21mi |
| 112 Knight Ct Windsor, CA | 4.0 | 2.5 | 2202 | $4,250 | $1.93 | 14d | 1 | 1.24mi |
Listing history 18 events
-
2026-06-21days on market $318,000 Active 36 DOM
-
2026-06-18days on market $318,000 Active 33 DOM
-
2026-06-17days on market $318,000 Active 32 DOM
-
2026-06-16days on market $318,000 Active 31 DOM
-
2026-06-15days on market $318,000 Active 30 DOM
-
2026-06-14days on market $318,000 Active 28 DOM
-
2026-06-13days on market $318,000 Active 27 DOM
-
2026-06-10days on market $318,000 Active 25 DOM
-
2026-06-09days on market $318,000 Active 24 DOM
-
2026-06-08days on market $318,000 Active 23 DOM
-
2026-06-07days on market $318,000 Active 22 DOM
-
2026-06-05days on market $318,000 Active 19 DOM
-
2026-06-03days on market $318,000 Active 18 DOM
-
2026-06-02days on market $318,000 Active 17 DOM
-
2026-06-01days on market $318,000 Active 16 DOM
-
2026-05-31days on market $318,000 Active 15 DOM
-
2026-05-30days on market $318,000 Active 14 DOM
-
2026-05-16$318,000 Active
ⓘ Source: listings_history table (triggers on properties + properties_extension) + one-shot
backfill from property_details.listing_events for pre-trigger history.
Climate risk First Street
- Flood 6/10 Major FEMA zone X (unshaded) · 68% chance over 30 yrs
- Wildfire 5/10 Major
- Heat 4/10 Moderate 7 d/yr ≥92°F today · 16 d/yr by 30 yrs out
- Wind 1/10 Low
- Air quality 9/10 Extreme 18 unhealthy d/yr today · 20 by 30 yrs out
Nearby sold comps map
Loading sold comps map…
Walkable amenities ~0.75 mi
Loading nearby amenities…
Taxation est. · year 1
- Rental income
- $45,682
- − Mortgage interest
- −$17,813
- − Property taxes
- −$4,770
- − Insurance
- −$1,590
- − Repairs & maintenance
- −$3,655
- − Management
- −$3,655
- − Depreciation
- −$9,251
- Taxable income
- $4,949
- Est. tax owed @ 24.0%
- −$1,188
- After-tax cash flow
- $8,530/yr
For passive investors: Depreciation is non-cash, so a rental often shows a tax loss while cash-flowing — sheltering income. Rental losses are passive: they offset passive income freely, and up to $25,000/yr can offset ordinary (W-2) income if you actively participate and your MAGI is under $100k (phasing out to $0 by $150k); unused losses carry forward. On sale, claimed depreciation is recaptured at up to 25%, and gains may owe capital-gains tax (a 1031 exchange can defer both). Figures are a year-1 estimate at your 24.0% rate — not tax advice; consult a CPA.
Schools (NCES district)
- District
- Windsor Unified
- NCES district ID
- 0600034
- Math proficiency
- 25% ▼ -10.00%
- Reading proficiency
- 25% ▼ -22.00%
- Median HH income
- $81,297
- Composite
- 25.06/100
- National rank
- #7541
- State rank
- #362 of 517 in CA
Livability — Windsor
- Score
- 71/100
- State rank
- #210
- US rank
- #6671
Category grades
Schools grade is shown separately in the Schools card above.
Census & demographics
- Census place
- Windsor, CA
- County
- Sonoma County · 449,805 people
- City population
- 27,429
- Metro
- Santa Rosa-Petaluma, CA
- Population (ZIP)
- 27,429
- Household income
- $134,211
- Rent vs Own
- Severe rent burden
- 628.0
Population outlook (Sonoma County) Hauer SSP2
- Today (2025)
- 539,935 people
- By 2030
- 554,870 · +2.8%
- By 2040
- 573,262 · +6.2%
- By 2050
- 580,715 · +7.6%
- By 2075
- 579,229 · +7.3%
- By 2100
- 547,835 · +1.5%
Race, ethnicity, and origin ACS 2023
- Neighborhood character
- Majority White (59%)
- Race & ethnicity
- White 59% Hispanic / Latino 33% Two or more races 13% Native American 4% Asian 2% Black 1%
- Hispanic origin (detail)
- Mexican 28%
- Common ancestry
- Italian 4% Slovak 3% Lithuanian 2%
- Foreign-born
- 14% · Canada
- Languages at home
- 72% English-only · Spanish 25% French/Haitian/Cajun 1% Vietnamese 1%
Political lean MEDSL · Sonoma
- 2024 margin
- Solid D (+46.2) · D 71.4% · R 25.2% · Other 3.3%
- 2008→2024 swing
- -3.4pp toward R · 2008: 49.6pp · 2024: 46.2pp
- All cycles
- 2024: D+46.2 2020: D+51.5 2016: D+47.9 2012: D+44.9 2008: D+49.6
Not yet ingested
- Civics
- —
Market trends
- HPI YoY
- ▼ -348.03%
- Current HPI
- 249.6052
- Rent YoY
- —
- Metro
- Santa Rosa-Petaluma, CA
- State GDP YoY
- ▲ 3.21%
- F500 in state
- 116
Industry mix (Fortune 500 HQ in CA)
| Industry | F500 HQs | Revenue |
|---|---|---|
| Technology | 27 | $1,492B |
|
||
| Financial Services | 3 | $174B |
|
||
| Retail | 3 | $44B |
|
||
| Insurance | 3 | $26B |
|
||
| Media / Entertainment | 2 | $115B |
|
||
| Pharmaceuticals / Biotech | 2 | $62B |
|
||
Price history
1 event — show timeline
- 2026-05-16 Listed $318,000 BAREIS
Property tax history
-3.0%/yrLatest (2025): $411 · +0.3% YoY. Source: county tax records.
Cash-flow waterfall
monthlySold comps — $/sqft
last 12 mo · ≤1 miLoading sold comps…