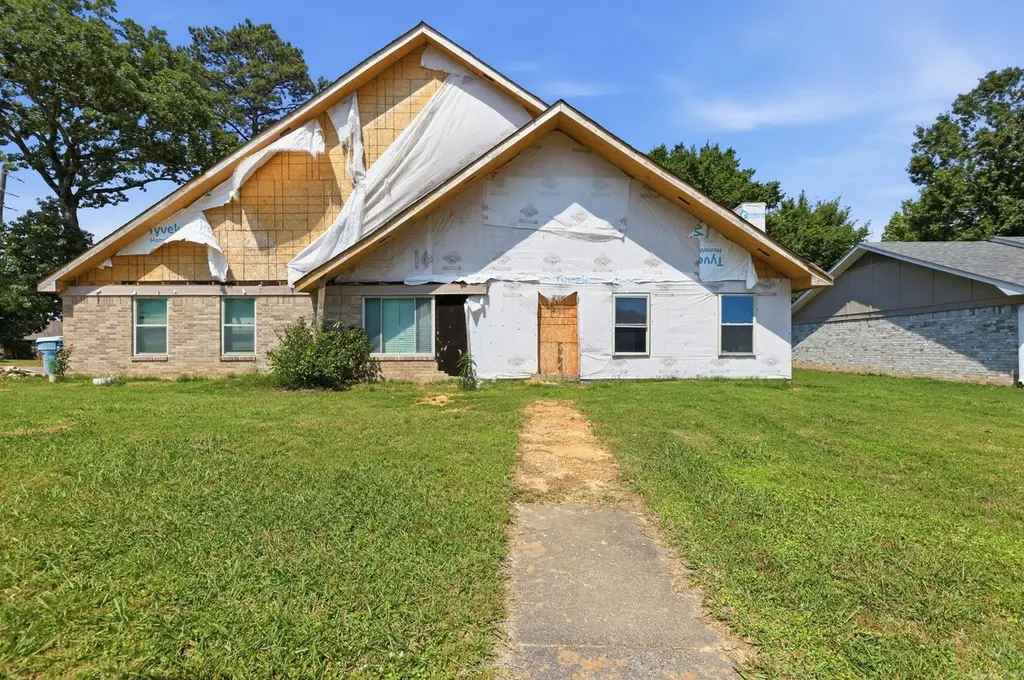
6018 Timberside Rd · Little Rock, AR
Flood risk 1/10 · Minimal
- FEMA flood zone
- X (unshaded)
- Chance of flooding over 30 yrs
- 0.0%
- Est. flood insurance / yr
- $507 – $1,088
Fire risk 3/10 · Minor
- Est. fire insurance / yr
- $1,499 – $2,785
Heat risk 7/10 · Major
- Hot days now (above 110°F)
- 7 days/yr
- Hot days in 30 yrs
- 20 days/yr
Wind risk 4/10 · Minor
- Chance of severe wind over 30 yrs
- 10.0%
Air-quality risk 2/10 · Minimal
- Unhealthy air days now
- 0 days/yr
- Unhealthy air days in 30 yrs
- 1 days/yr
Risk factors via First Street. Map © Google.
Why this score? — see what drove the B- grade
The composite is a weighted blend of 9 inputs, each scored 0–100. Each bar is that input's sub-score; the figure is the points it added to the 100-point composite (weight × sub-score).
- Cash flow +26.4/30.0
- ARV discount +15.0/15.0
- DSCR +9.0/10.0
- 1% rule +6.5/10.0
- Rent growth +3.7/5.0
- Livability +3.7/5.0
- Condition / age +2.5/5.0
- Schools +2.1/10.0
- Appreciation +0.0/10.0
$140,000
🖨 Deal sheet (PDF) 📄 Offer letter ✓ Due diligence
Listing remarks
Unique opportunity in Little Rock! This 3-bedroom, 2-bath home offers approximately 2,000 sqft of living space with much of the property already completed and move-in ready. A portion of the home is still under development, as the seller has decided not to continue the project—creating excellent potential for buyers or investors looking to step in and finish the remaining work to their vision. The home features spacious living areas, functional layout potential, and the opportunity to add immediate value through completion of the unfinished portion. This property is ideal for investors, builders, or buyers looking for a customizable project with substantial progress already made. An a
Key facts
- Move-in ready
- 0.29 acre lot
- 2 garage spots
Tags
Property features AI
Finance
- Other: Lot approx. 112' x 97' x 127' x 99' (0.29 acre)
- Financial info: Financing: Conventional or cash
Exterior
- Parking: Detached garage for 2 cars
- Utilities: Public sewer; Public water; Solar panels / solar power
- Home design: Brick exterior
- Construction: Slab foundation; Composition roof
- Exterior features: Patio; Outside storage area; Chain link fence; Level lot; Inside city limits
Interior
- Kitchen: Free-standing stove; Microwave; Dishwasher
- Flooring: Tile; Luxury vinyl
- Bathrooms: 2 full bathrooms
- Heating & cooling: Central heat (gas); Central electric cooling
- Interior features: Washer connection; Window treatments; Ceiling fans; Walk-in shower; Breakfast bar
- Laundry & utility: Laundry room
Neighborhood map
What this means for you Summary
Snapshot
- This is a 3-bed/2.0-bath single-family listed at $140k.
Deal economics
- At list price, monthly cash flow is $367 ($4k/yr) — positive.
- The deal already cash-flows at list — no discount required.
- Meets the 1% rule at list price ($2k rent vs $140k).
- Recommended offer: $136k (3.0% below list) — sets the bar for market timing.
- Cap rate 9.4% vs local median 4.1% in Little Rock — top-decile yield for the area; either an underpriced asset or a hidden risk that comps aren't pricing in. Stress-test before assuming the spread holds.
Location & tenants
- Location reads 73/100 on livability (#22 in AR) — a middle-class / working-renter tenant base. Strengths: commute A+, cost of living A+, housing A+; Watch: crime F.
- Little Rock School District (urban): math 23% / reading 26% proficiency, ranked #183 of 238 in AR (top 77%) — low school quality limits family demand, transient renter base, plan for 1-2y turnover; 69% free/reduced lunch — lower-income household profile, screen leases tightly.
- Market conditions: Rents rising fast (+4.9%/yr); 190 active listings in the ZIP; 2 comparable units currently listed for rent nearby; lower-income renter base — watch delinquency; 1,006 units permitted in Pulaski County in 2024 (0 in 5+ unit buildings).
- At $1,614/mo this rent would consume 47% of the median local household income ($41k/yr) (locally 1553% of renters already pay >50% of income on rent) — very limited rent-growth headroom before tenants either downsize or default.
Forward outlook
- Local home prices are declining (-3.0%/yr); year-one equity from $968 of loan paydown is wiped out by about $4k of value loss. Plan a longer hold.
- Pulaski County population projected at +6% by 2050 — modest demand growth; plan on rents tracking national, not racing it.
- At projected returns (-3.0% appreciation + 4.9% rent growth), your $39k cash investment doubles in ~9 years — after that, you're playing with house money.
Negotiation context
- It's been on market 35 days — a 3% lower offer ($136k) is reasonable based on typical stale-listing flexibility.
- 2 sale attempts with the ask held roughly flat each time — persistent listings suggest the price (not the market) is what's stuck; bring a comps-based counter.
Risks & watch-outs
- Climate carrying-cost: extreme-heat days projected 7→20/yr by 2055 (HVAC capex compounding) — expect insurance premiums to compound above CPI over the hold.
Questions for the listing agent
- It's been on market 35 days. Have you received any prior offers? Is the seller open to a 3% concession, seller financing, or rate buy-down credit?
- Built in 1975 — when were the roof, HVAC, electrical panel, plumbing, and water heater last replaced?
- Is there a deadline driving the sale (1031 exchange, divorce, estate, relocation)? That informs how much negotiation room exists.
- Crime grade is F in this area — have there been break-ins, vandalism, or insurance claims at this property in the last 3 years? What carrier currently insures it and at what premium?
- What's the average days-on-market for RENTAL listings here right now (not sales)? A rising rental-DOM trend means longer vacancies and softer asking-rent achievability than the comps imply.
- What's the recent tenant-quality profile in this submarket — average credit score on applications, eviction rate, late-payment / NSF rate, and stable-employment percentage? A property-management company in the area should have these aggregated.
- How much new for-sale + rental construction is in the pipeline within 1–3 miles? Heavy new supply typically softens prices + rents 12–24 months out; constrained supply supports both.
Investment metrics
- 1% rule
- 1.15% ✓
- Cap rate
- 9.44%
- Cash-on-cash
- 11.23%
- DSCR
- 1.50
- GRM
- 7.2
CMA / ARV
- ARV (median comp)
- $225,258
- List price
- $140,000
- Delta
- -37.85%
- Verdict
- UNDERPRICED
- Comps
- 20 within 1.0 mi
Show comp detail 5 sales within ~0.75 mi
| Address | Dist | Beds/Ba | Sqft | Sold | Price | $/sf | Match |
|---|---|---|---|---|---|---|---|
| 9422 Herndon Rd | 0.07mi | 3/2.5 | 1,986 (-2%) | 9mo | $219,000 | $110 | 84 |
| 9314 Timber Valley Rd | 0.27mi | 3/2.0 | 2,220 (+10%) | 4mo | $140,000 | $63 | 68 |
| 5718 Forest View Rd | 0.43mi | 3/2.5 | 1,800 (-11%) | 5mo | $130,000 | $72 | 55 |
| 9502 Timber Valley Rd | 0.29mi | 3/2.0 | 1,747 (-14%) | 13mo | $145,000 | $83 | 52 |
| 9410 Tall Timber Blvd | 0.40mi | 3/2.5 | 2,143 (+6%) | 24mo | $275,000 | $128 | 50 |
Match score weights: distance 35% · size 25% · config 20% · recency 20%. Top-matched comps best support the ARV.
Projected returns pro-forma
-3.0% appreciation · 4.91% rent growth · sell at horizon
- IRR
- 2.5%
- Equity multiple
- 1.10×
- Total profit
- $3,827
- Equity at exit
- $20,874
- IRR
- 13.8%
- Equity multiple
- 2.20×
- Total profit
- $46,857
- Equity at exit
- $12,105
Cash invested: $39,200 (down + closing). Projections, not guarantees.
Landlord ↔ Tenant lean methodology
- Overall (STATE)
- 92 Strongly Landlord-Friendly
- State Arkansas
- 92 Strongly Landlord-Friendly · R+14
- County
- — inherits STATE
- City
- — inherits STATE
ZIP-level market 72204
- Home prices YoY
- -21.5%
- Rents YoY
- 4.9%
- Active inventory
- 190
- Price-to-rent
- 7.2×
Monthly cashflow live
- Estimated rent
- $1,614 medium interval (Pro) →
- Mortgage (P&I)
- −$734
- Tax from tax record
- −$116 /mo · $1,389/yr
- Insurance
- −$58
- HOA
- −$0
- Vacancy / Maint / Mgmt
- −$339
- Net cashflow
- $367
Break-even live
Sensitivity live
| Price | -10% $446 | -5% $406 | +0% $367 | +5% $327 | +10% $288 |
|---|---|---|---|---|---|
| Rent | -10% $239 | -5% $303 | +0% $367 | +5% $431 | +10% $494 |
| Rate | -1.0pp $437 | -0.5pp $402 | base $367 | +0.5pp $331 | +1.0pp $294 |
UW: 25.0% down · 7.5% · 30yr · 1.5% tax · 5.0% vac · 8.0% maint · 8.0% mgmt
Financing live
Cash to close
- Down payment
- $35,000
- Closing costs
- $4,200
- Reserves months
- —
- Total cash needed
- —
Loan-product check · same deal, 3 products live
Conventional
25% down · 7.5% · 30yr
- Down + closing
- —
- Monthly P&I
- —
- Monthly cashflow
- —
- DSCR
- —
- Eligible?
- —
Personal DTI + credit; lowest rate.
DSCR
20% down · 8.5% · 30yr
- Down + closing
- —
- Monthly P&I
- —
- Monthly cashflow
- —
- DSCR
- —
- Eligible?
- —
No personal income docs; deal must DSCR.
Hard money
10% down · 12.0% · 12mo
- Down + closing
- —
- Monthly P&I
- —
- Monthly cashflow
- —
- DSCR
- —
- Eligible?
- —
Short-term bridge; refi at stabilization.
Rent comps 2 comps
| Address | Beds | Baths | Sqft | Rent | $/sqft | DOM | Units | Dist |
|---|---|---|---|---|---|---|---|---|
| 5721 Old Hickory Rd Little Rock, AR | 3.0 | 2.5 | 1972 | $1,725 | $0.87 | 45d | 1 | 0.42mi |
| 8018 Mabelvale Pike Little Rock, AR | 4.0 | 3.0 | 2500 | $1,875 | $0.75 | 45d | 1 | 1.25mi |
Listing history 23 events
-
2026-06-18status $140,000 Under Contract 35 DOM
-
2026-06-18days on market $140,000 Active 35 DOM
-
2026-06-17days on market $140,000 Active 34 DOM
-
2026-06-16days on market $140,000 Active 33 DOM
-
2026-06-15days on market $140,000 Active 32 DOM
-
2026-06-14days on market $140,000 Active 30 DOM
-
2026-06-13days on market $140,000 Active 29 DOM
-
2026-06-10days on market $140,000 Active 27 DOM
-
2026-06-09days on market $140,000 Active 26 DOM
-
2026-06-08days on market $140,000 Active 25 DOM
-
2026-06-05days on market $140,000 Active 21 DOM
-
2026-06-03days on market $140,000 Active 20 DOM
-
2026-06-02days on market $140,000 Active 19 DOM
-
2026-06-01days on market $140,000 Active 18 DOM
-
2026-05-31days on market $140,000 Active 17 DOM
-
2026-05-31days on market $140,000 Active 16 DOM
-
2026-05-14$140,000 New Listing 880-char remark
-
2026-02-12historical
-
2026-01-09price $162,000
-
2025-12-22price $170,000
-
2025-12-17price $175,000
-
2025-12-10price $180,000
-
2025-11-24$190,000 New Listing
ⓘ Source: listings_history table (triggers on properties + properties_extension) + one-shot
backfill from property_details.listing_events for pre-trigger history.
Tax reassessment forecast AR · Resets to sale price
- Current annual tax
- $1,389 · $116/mo
- Projected year-2 tax
- $1,389 · $116/mo
- Expected delta
- $0/yr ($0/mo · 0.0%)
ⓘ Screening estimate from a state-policy table — verify with the county assessor before closing.
Climate risk First Street
- Flood 1/10 Low FEMA zone X (unshaded) · 0% chance over 30 yrs
- Wildfire 3/10 Moderate
- Heat 7/10 Severe 7 d/yr ≥110°F today · 20 d/yr by 30 yrs out
- Wind 4/10 Moderate 10% chance of damaging wind over 30 yrs
- Air quality 2/10 Low 0 unhealthy d/yr today · 1 by 30 yrs out
Nearby sold comps map
Loading sold comps map…
Walkable amenities ~0.75 mi
Loading nearby amenities…
Taxation est. · year 1
- Rental income
- $19,369
- − Mortgage interest
- −$7,842
- − Property taxes
- −$1,389
- − Insurance
- −$700
- − Repairs & maintenance
- −$1,550
- − Management
- −$1,550
- − Depreciation
- −$4,073
- Taxable income
- $2,266
- Est. tax owed @ 24.0%
- −$544
- After-tax cash flow
- $3,858/yr
For passive investors: Depreciation is non-cash, so a rental often shows a tax loss while cash-flowing — sheltering income. Rental losses are passive: they offset passive income freely, and up to $25,000/yr can offset ordinary (W-2) income if you actively participate and your MAGI is under $100k (phasing out to $0 by $150k); unused losses carry forward. On sale, claimed depreciation is recaptured at up to 25%, and gains may owe capital-gains tax (a 1031 exchange can defer both). Figures are a year-1 estimate at your 24.0% rate — not tax advice; consult a CPA.
Schools (NCES district)
- District
- Little Rock School District
- NCES district ID
- 0509000
- Math proficiency
- 23% ▼ -12.00%
- Reading proficiency
- 26% ▼ -8.00%
- Median HH income
- $43,346
- Composite
- 21.0/100
- National rank
- #8457
- State rank
- #183 of 238 in AR
Livability — Little Rock
- Score
- 73/100
- State rank
- #22
- US rank
- #5295
Category grades
Schools grade is shown separately in the Schools card above.
Census & demographics
- Census place
- Little Rock, AR
- County
- Pulaski County · 372,764 people
- City population
- 218,896
- Metro
- Little Rock-North Little Rock-Conway, AR
- Population (ZIP)
- 30,525
- Household income
- $40,882
- Rent vs Own
- Severe rent burden
- 1553.0
Population outlook (Pulaski County) Hauer SSP2
- Today (2025)
- 415,378 people
- By 2030
- 423,720 · +2.0%
- By 2040
- 435,182 · +4.8%
- By 2050
- 440,904 · +6.1%
- By 2075
- 445,521 · +7.3%
- By 2100
- 419,173 · +0.9%
Race, ethnicity, and origin ACS 2023
- Neighborhood character
- Predominantly Black (66%)
- Race & ethnicity
- Black 66% White 18% Hispanic / Latino 12% Two or more races 6%
- Hispanic origin (detail)
- Mexican 9%
- Common ancestry
- Slovak 1%
- Foreign-born
- 7% · Canada, Vietnam
- Languages at home
- 89% English-only · Spanish 9% Vietnamese 1%
Political lean MEDSL · Pulaski
- 2024 margin
- Strong D (+22.1) · D 59.8% · R 37.7% · Other 2.5%
- 2008→2024 swing
- +10.6pp toward D · 2008: 11.6pp · 2024: 22.1pp
- All cycles
- 2024: D+22.1 2020: D+22.5 2016: D+17.9 2012: D+11.4 2008: D+11.6
Not yet ingested
- Civics
- —
Market trends
- HPI YoY
- ▼ -47.17%
- Current HPI
- 172.3977
- Rent YoY
- ▲ 4.91%
- Metro
- Little Rock-North Little Rock-Conway, AR
- State GDP YoY
- ▲ 3.80%
- F500 in state
- 10
Industry mix (Fortune 500 HQ in AR)
| Industry | F500 HQs | Revenue |
|---|---|---|
| Retail | 1 | $681B |
|
||
| Food / Agriculture | 1 | $53B |
|
||
| Retail / Energy | 1 | $22B |
|
||
| Transportation / Logistics | 1 | $12B |
|
||
| Energy | 1 | $4B |
|
||
Price history
-26.3% since first listed7 events — show timeline
- 2026-05-14 Listed $140,000 CARMLS
- 2026-02-12 Listing Removed — CARMLS
- 2026-01-09 Price Changed $162,000 CARMLS
- 2025-12-22 Price Changed $170,000 CARMLS
- 2025-12-17 Price Changed $175,000 CARMLS
- 2025-12-10 Price Changed $180,000 CARMLS
- 2025-11-24 Listed $190,000 CARMLS
Property tax history
+0.6%/yrLatest (2025): $1,389 · +0.0% YoY. Source: county tax records.
Cash-flow waterfall
monthlySold comps — $/sqft
last 12 mo · ≤1 miLoading sold comps…