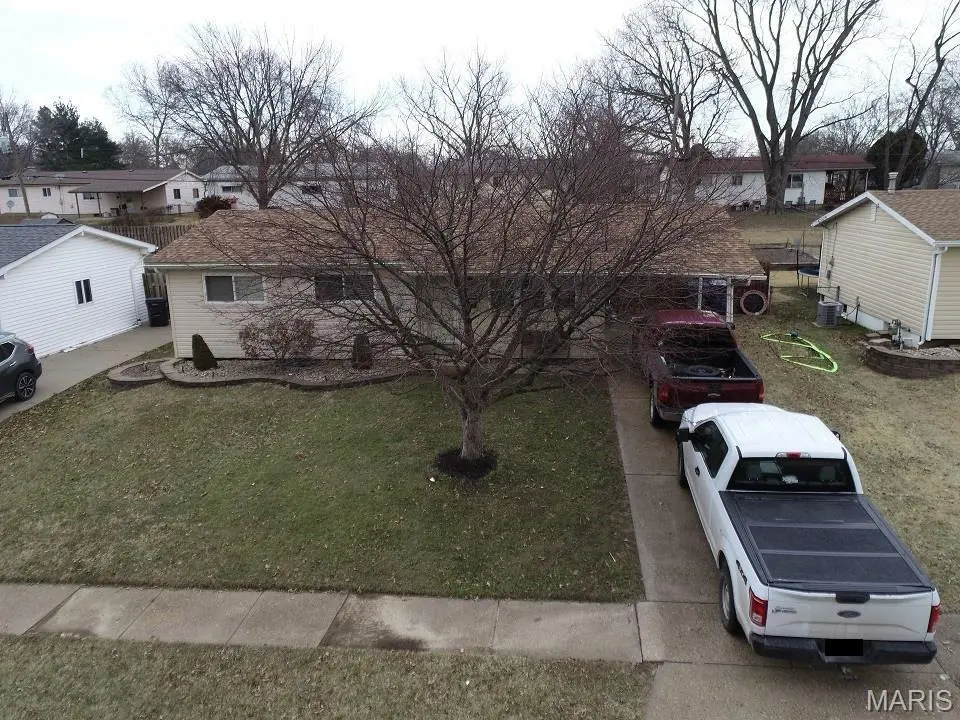
1495 Yaqui Dr · Florissant, MO
Flood risk 1/10 · Minimal
- FEMA flood zone
- X (unshaded)
- Chance of flooding over 30 yrs
- 0.0%
- Est. flood insurance / yr
- $473 – $860
Fire risk 1/10 · Minimal
- Est. fire insurance / yr
- $1,054 – $1,958
Heat risk 4/10 · Minor
- Hot days now (above 106°F)
- 7 days/yr
- Hot days in 30 yrs
- 21 days/yr
Wind risk 2/10 · Minimal
- Chance of severe wind over 30 yrs
- 1.0%
Air-quality risk 2/10 · Minimal
- Unhealthy air days now
- 2 days/yr
- Unhealthy air days in 30 yrs
- 2 days/yr
Risk factors via First Street. Map © Google.
Why this score? — see what drove the C grade
The composite is a weighted blend of 9 inputs, each scored 0–100. Each bar is that input's sub-score; the figure is the points it added to the 100-point composite (weight × sub-score).
- Cash flow +20.6/30.0
- ARV discount +15.0/15.0
- DSCR +6.6/10.0
- 1% rule +5.4/10.0
- Livability +3.7/5.0
- Rent growth +3.6/5.0
- Condition / age +2.5/5.0
- Schools +1.7/10.0
- Appreciation +0.0/10.0
$127,900
🖨 Deal sheet 📄 Offer letter ✓ Due diligence
Listing remarks MLS
Great Opportunity to own this single-family home oozing with potential. This home was built in 1962 and features 3 bedrooms and 1 bathroom, with plenty of living space. ***SPECIAL NOTES: (1) This is a CASH ONLY transaction. (2) Seller to pay Taxes, HOA, and Municipal/Utility Liens. (3) Please read the Auction disclaimers carefully before placing a bid or submitting an offer. *** REO Auction property.
Key facts
- 7,405 sq ft lot
- Parking
- Built 1962
Neighborhood map
What this means for you Summary
Snapshot
- This is a 3-bed/1.0-bath single-family listed at $128k.
Deal economics
- At list price, monthly cash flow is $172 ($2k/yr) — positive.
- The deal already cash-flows at list — no discount required.
- Meets the 1% rule at list price ($1k rent vs $128k).
- Recommended offer: $113k (12.0% below list) — sets the bar for market timing.
- Cap rate 7.9% vs local median 6.3% in Florissant — meaningfully above typical; check what's discounted (condition, days-on-market, listing class) to confirm the premium yield is real.
Location & tenants
- Location reads 73/100 on livability (#82 in MO) — a middle-class / working-renter tenant base. Strengths: cost of living A+, housing A+, health & safety B+; Watch: crime C-, amenities D+, schools D.
- Hazelwood (suburban): math 11% / reading 26% proficiency, ranked #306 of 324 in MO (top 94%) — low school quality limits family demand, transient renter base, plan for 1-2y turnover.
- Market conditions: Rents rising fast (+4.3%/yr); 271 active listings in the ZIP; 22 comparable units currently listed for rent nearby; rentals at typical pace (median 24d on market — plan ~3-4 weeks tenant-placement turnaround); 45% of comp listings sitting > 30 days — soft ceiling on asking rent; 920 units permitted in St. Louis County in 2024 (250 in 5+ unit buildings).
Forward outlook
- Local home prices are declining (-3.0%/yr); year-one equity from $884 of loan paydown is wiped out by about $4k of value loss. Plan a longer hold.
Negotiation context
- It's been on market 602 days — a 12% lower offer ($113k) is reasonable based on typical stale-listing flexibility.
Questions for the listing agent
- It's been on market 602 days. Have you received any prior offers? Is the seller open to a 12% concession, seller financing, or rate buy-down credit?
- Built in 1962 — when were the roof, HVAC, electrical panel, plumbing, and water heater last replaced?
- Why hasn't it sold? Are there any deal-killer items the seller is aware of (foundation, flood, title, zoning, code violations)?
- Is there a deadline driving the sale (1031 exchange, divorce, estate, relocation)? That informs how much negotiation room exists.
- Schools are D-rated, which usually means shorter tenancies and higher turnover. Who's the typical renter profile here, and what's been the actual vacancy rate?
- What's the average days-on-market for RENTAL listings here right now (not sales)? A rising rental-DOM trend means longer vacancies and softer asking-rent achievability than the comps imply.
- What's the recent tenant-quality profile in this submarket — average credit score on applications, eviction rate, late-payment / NSF rate, and stable-employment percentage? A property-management company in the area should have these aggregated.
- How much new for-sale + rental construction is in the pipeline within 1–3 miles? Heavy new supply typically softens prices + rents 12–24 months out; constrained supply supports both.
Investment metrics
- 1% rule
- 1.04% ✓
- Cap rate
- 7.90%
- Cash-on-cash
- 5.75%
- DSCR
- 1.26
- GRM
- 8.0
CMA / ARV
- ARV (median comp)
- $192,604
- List price
- $127,900
- Delta
- -33.59%
- Verdict
- UNDERPRICED
- Comps
- 20 within 1.0 mi
Show comp detail 12 sales within ~0.75 mi
| Address | Dist | Beds/Ba | Sqft | Sold | Price | $/sf | Match |
|---|---|---|---|---|---|---|---|
| 1782 Oliveto Ln | 0.23mi | 3/2.0 | 950 (-1%) | 3mo | $209,000 | $220 | 82 |
| 7443 Foxfield Dr | 0.33mi | 3/1.0 | 974 (+2%) | 2mo | $169,990 | $175 | 80 |
| 10 Garnier Ct | 0.40mi | 3/1.5 | 960 (+0%) | 3mo | $125,000 | $130 | 76 |
| 1035 Kostka Ln | 0.40mi | 3/1.0 | 912 (-5%) | 2mo | $175,000 | $192 | 71 |
| 518 Fox Crest Dr | 0.51mi | 3/2.0 | 974 (+2%) | 5mo | $160,000 | $164 | 65 |
| 1890 Caposele Ln | 0.43mi | 3/1.0 | 1,025 (+7%) | 5mo | $175,000 | $171 | 64 |
| 608 Holiday Ave | 0.62mi | 3/1.0 | 912 (-5%) | 3mo | $165,000 | $181 | 61 |
| 506 Impala Ln | 0.74mi | 3/1.0 | 988 (+3%) | 3mo | $159,000 | $161 | 58 |
| 1065 Keeven Ln | 0.67mi | 3/1.0 | 888 (-7%) | 1mo | $198,575 | $224 | 56 |
| 875 Flora Ln | 0.70mi | 2/1.5 (-1) | 960 (+0%) | 6mo | $163,000 | $170 | 54 |
| 7240 Howdershell | 0.54mi | 4/2.0 (+1) | 1,032 (+8%) | 4mo | $130,000 | $126 | 49 |
| 715 Gonzaga Ln | 0.74mi | 3/2.5 | 1,092 (+14%) | 2mo | $200,000 | $183 | 34 |
Match score weights: distance 35% · size 25% · config 20% · recency 20%. Top-matched comps best support the ARV.
Projected returns pro-forma
-3.0% appreciation · 4.27% rent growth · sell at horizon
- IRR
- -6.0%
- Equity multiple
- 0.78×
- Total profit
- $-8,055
- Equity at exit
- $19,070
- IRR
- 5.1%
- Equity multiple
- 1.40×
- Total profit
- $14,369
- Equity at exit
- $11,058
Cash invested: $35,812 (down + closing). Projections, not guarantees.
Landlord ↔ Tenant lean methodology
- Overall (STATE)
- 81 Strongly Landlord-Friendly
- State Missouri
- 81 Strongly Landlord-Friendly · R+10
- County
- — inherits STATE
- City
- — inherits STATE
ZIP-level market 63031
- Rents YoY
- 4.3%
- Active inventory
- 271
- Price-to-rent
- 8.0×
Monthly cashflow live
- Estimated rent
- $1,328 high interval (Pro) →
- Mortgage (P&I)
- −$671
- Tax from tax record
- −$153 /mo · $1,839/yr
- Insurance
- −$53
- HOA
- −$0
- Vacancy / Maint / Mgmt
- −$279
- Net cashflow
- $172
Break-even live
UW: 25.0% down · 7.5% · 30yr · 1.5% tax · 5.0% vac · 8.0% maint · 8.0% mgmt
Financing live
Cash to close
- Down payment
- $31,975
- Closing costs
- $3,837
- Reserves months
- —
- Total cash needed
- —
Loan-product check · same deal, 3 products live
Conventional
25% down · 7.5% · 30yr
- Down + closing
- —
- Monthly P&I
- —
- Monthly cashflow
- —
- DSCR
- —
- Eligible?
- —
Personal DTI + credit; lowest rate.
DSCR
20% down · 8.5% · 30yr
- Down + closing
- —
- Monthly P&I
- —
- Monthly cashflow
- —
- DSCR
- —
- Eligible?
- —
No personal income docs; deal must DSCR.
Hard money
10% down · 12.0% · 12mo
- Down + closing
- —
- Monthly P&I
- —
- Monthly cashflow
- —
- DSCR
- —
- Eligible?
- —
Short-term bridge; refi at stabilization.
Rent comps 22 comps
| Address | Beds | Baths | Sqft | Rent | $/sqft | DOM | Units | Dist |
|---|---|---|---|---|---|---|---|---|
| 858 Hazelvalley Dr Hazelwood, MO | 3.0 | 1.5 | 912 | $1,450 | $1.59 | 43d | 1 | 0.39mi |
| 446 Olian Dr Hazelwood, MO | 2.0 | 1.0 | 880 | $975 | $1.11 | 2d | 1 | 0.58mi |
| 7404 Olian Dr Hazelwood, MO | 2.0 | 1.0 | 870 | $925 | $1.06 | 43d | 1 | 0.64mi |
| 532 Holiday Ave Hazelwood, MO | 3.0 | 1.0 | 912 | $1,350 | $1.48 | 43d | 1 | 0.68mi |
| 785 Florland Dr Florissant, MO | 3.0 | 1.0 | 1100 | $1,700 | $1.55 | 17d | 1 | 0.75mi |
| 508 Saratoga Ln Hazelwood, MO | 3.0 | 1.0 | 988 | $1,306 | $1.32 | 23d | 1 | 0.76mi |
| 651 Southwell Ln Florissant, MO | 2.0 | 1.0 | 694 | $1,100 | $1.59 | 17d | 1 | 0.84mi |
| 1052 Teson Rd Unit 1064D Hazelwood, MO | 2.0 | 1.0 | 800 | $1,000 | $1.25 | 43d | 1 | 0.90mi |
| 1052 Teson Rd Unit 1048A Hazelwood, MO | 2.0 | 1.0 | 800 | $995 | $1.24 | 43d | 1 | 0.90mi |
| 1052 Teson Rd Unit 1068D Hazelwood, MO | 2.0 | 1.0 | 800 | $1,000 | $1.25 | 16d | 1 | 0.90mi |
| 2280 Keeven Ln Florissant, MO | 1.0–3.0 | 1.0–1.5 | 805 | $1,290 | $1.60 | 1d | 14 | 1.00mi |
| 14 Bruce Dr Unit Bruce 14-4 Florissant, MO | 2.0 | 1.0 | 880 | $975 | $1.11 | 43d | 1 | 1.12mi |
| 13 Bruce Dr Florissant, MO | 2.0 | 1.0 | 880 | $975 | $1.11 | 23d | 1 | 1.13mi |
| 13 Bruce Dr Unit Bruce 13-2 Florissant, MO | 2.0 | 1.0 | 880 | $975 | $1.11 | 43d | 1 | 1.13mi |
| 1015 Lindsay Ln Florissant, MO | 3.0 | 2.0 | 988 | $1,600 | $1.62 | 23d | 1 | 1.21mi |
| 21 Quick Dr Apt 1 Florissant, MO | 2.0 | 1.0 | 850 | $1,100 | $1.29 | 43d | 1 | 1.37mi |
| 21 Quick Dr Apt 3 Florissant, MO | 2.0 | 1.0 | 850 | $995 | $1.17 | 23d | 1 | 1.37mi |
| 23 Quick Dr Apt 2 Florissant, MO | 2.0 | 1.0 | 850 | $1,100 | $1.29 | 43d | 1 | 1.38mi |
| 155 Reeb Ln Apt 2 Florissant, MO | 2.0 | 1.0 | 850 | $995 | $1.17 | 43d | 1 | 1.39mi |
| 167 Reeb Ln Florissant, MO | 1.0–2.0 | 1.0 | 850 | $1,300 | $1.53 | 2d | 4 | 1.41mi |
| 2485 Jenkee Dr Florissant, MO | 3.0 | 1.0 | 960 | $1,376 | $1.43 | 1d | 1 | 1.41mi |
| 7437 Hazelcrest Dr Unit H Hazelwood, MO | 3.0 | 1.0 | 1000 | $1,000 | $1.00 | 7d | 1 | 1.44mi |
Listing history 18 events
-
2026-06-18days on market $127,900 Active 602 DOM
-
2026-06-17days on market $127,900 Active 601 DOM
-
2026-06-16days on market $127,900 Active 600 DOM
-
2026-06-15days on market $127,900 Active 599 DOM
-
2026-06-13days on market $127,900 Active 597 DOM
-
2026-06-13days on market $127,900 Active 596 DOM
-
2026-06-09days on market $127,900 Active 593 DOM
-
2026-06-08days on market $127,900 Active 592 DOM
-
2026-06-07days on market $127,900 Active 591 DOM
-
2026-06-05days on market $127,900 Active 588 DOM
-
2026-06-03days on market $127,900 Active 587 DOM
-
2026-06-02days on market $127,900 Active 586 DOM
-
2026-06-01days on market $127,900 Active 585 DOM
-
2026-05-31days on market $127,900 Active 584 DOM
-
2024-10-24$127,900 Active 403-char remark
Show marketing remark (403 chars)
Great Opportunity to own this single-family home oozing with potential. This home was built in 1962 and features 3 bedrooms and 1 bathroom, with plenty of living space. ***SPECIAL NOTES: (1) This is a CASH ONLY transaction. (2) Seller to pay Taxes, HOA, and Municipal/Utility Liens. (3) Please read the Auction disclaimers carefully before placing a bid or submitting an offer. *** REO Auction property.
-
2006-06-30soldstatus $126,500
-
1999-05-10soldstatus $69,900
-
1994-03-17soldstatus
ⓘ Source: listings_history table (triggers on properties + properties_extension) + one-shot
backfill from property_details.listing_events for pre-trigger history.
Tax reassessment forecast MO · Resets to sale price
- Current annual tax
- $1,839 · $153/mo
- Projected year-2 tax
- $1,839 · $153/mo
- Expected delta
- $0/yr ($0/mo · 0.0%)
ⓘ Screening estimate from a state-policy table — verify with the county assessor before closing.
Climate risk First Street
- Flood 1/10 Low FEMA zone X (unshaded) · 0% chance over 30 yrs
- Wildfire 1/10 Low
- Heat 4/10 Moderate 7 d/yr ≥106°F today · 21 d/yr by 30 yrs out
- Wind 2/10 Low 100% chance of damaging wind over 30 yrs
- Air quality 2/10 Low 2 unhealthy d/yr today · 2 by 30 yrs out
Nearby sold comps map
Loading sold comps map…
Walkable amenities ~0.75 mi
Loading nearby amenities…
Taxation est. · year 1
- Rental income
- $15,934
- − Mortgage interest
- −$7,164
- − Property taxes
- −$1,839
- − Insurance
- −$640
- − Repairs & maintenance
- −$1,275
- − Management
- −$1,275
- − Depreciation
- −$3,721
- Taxable income
- $21
- Est. tax owed @ 24.0%
- −$5
- After-tax cash flow
- $2,056/yr
For passive investors: Depreciation is non-cash, so a rental often shows a tax loss while cash-flowing — sheltering income. Rental losses are passive: they offset passive income freely, and up to $25,000/yr can offset ordinary (W-2) income if you actively participate and your MAGI is under $100k (phasing out to $0 by $150k); unused losses carry forward. On sale, claimed depreciation is recaptured at up to 25%, and gains may owe capital-gains tax (a 1031 exchange can defer both). Figures are a year-1 estimate at your 24.0% rate — not tax advice; consult a CPA.
Schools (NCES district)
- District
- Hazelwood
- NCES district ID
- 2913830
- Math proficiency
- 11% ▼ -13.00%
- Reading proficiency
- 26% ▼ -6.00%
- Median HH income
- $51,621
- Composite
- 16.77/100
- National rank
- #9156
- State rank
- #306 of 324 in MO
Livability — Florissant
- Score
- 73/100
- State rank
- #82
- US rank
- #5406
Category grades
Schools grade is shown separately in the Schools card above.
Census & demographics
- Census place
- Florissant, MO
- County
- Saint Louis County · 888,823 people
- City population
- 69,104
- Metro
- St. Louis, MO-IL
- Population (ZIP)
- 50,196
- Household income
- $70,811
- Rent vs Own
- Severe rent burden
- 1279.0
Population outlook (St. Louis County) Hauer SSP2
- Today (2025)
- 1,025,227 people
- By 2030
- 1,028,023 · +0.3%
- By 2040
- 1,020,940 · -0.4%
- By 2050
- 1,007,280 · -1.8%
- By 2075
- 987,277 · -3.7%
- By 2100
- 921,984 · -10.1%
Race, ethnicity, and origin ACS 2023
- Neighborhood character
- Diverse neighborhood (Simpson 0.58)
- Race & ethnicity
- White 49% Black 41% Two or more races 7% Hispanic / Latino 2%
- Common ancestry
- Romanian 3% Lithuanian 3% Swedish 1%
- Foreign-born
- 5% · Canada, Jamaica
- Languages at home
- 94% English-only · Spanish 2% Arabic 1%
Political lean MEDSL · St. Louis
- 2024 margin
- Strong D (+23.4) · D 60.8% · R 37.4% · Other 1.7%
- 2008→2024 swing
- +3.5pp toward D · 2008: 19.9pp · 2024: 23.4pp
- All cycles
- 2024: D+23.4 2020: D+24.0 2016: D+16.2 2012: D+13.7 2008: D+19.9
Not yet ingested
- Civics
- —
Market trends
- HPI YoY
- ▼ -223.57%
- Current HPI
- 202.7192
- Rent YoY
- ▲ 4.27%
- Metro
- St. Louis, MO-IL
- State GDP YoY
- ▲ 1.84%
- F500 in state
- 20
Industry mix (Fortune 500 HQ in MO)
| Industry | F500 HQs | Revenue |
|---|---|---|
| Healthcare | 1 | $163B |
|
||
| Insurance | 1 | $21B |
|
||
| Industrial Technology | 1 | $17B |
|
||
| Retail | 1 | $16B |
|
||
| Industrial Distribution | 1 | $10B |
|
||
| Utilities | 1 | $9B |
|
||
Price history
+83.0% since first listed4 events — show timeline
- 2024-10-24 Listed $127,900 MARIS as Distributed by MLS Grid
- 2006-06-30 Sold (Public Records) $126,500 Public Records
- 1999-05-10 Sold (Public Records) $69,900 Public Records
- 1994-03-17 Sold (Public Records) — Public Records
Property tax history
+2.0%/yrLatest (2022): $1,839 · +2.7% YoY. Source: county tax records.
Cash-flow waterfall
monthlySold comps — $/sqft
last 12 mo · ≤1 miLoading sold comps…