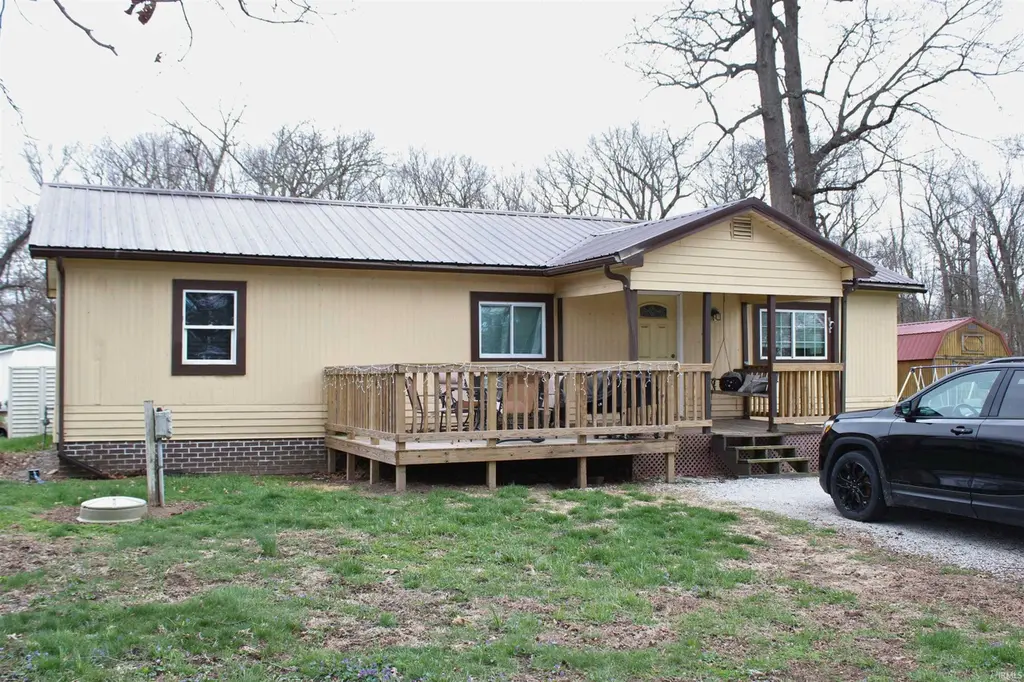
5957 E Redwood Ct · Buffalo, IN
Flood risk 1/10 · Minimal
- FEMA flood zone
- X (unshaded)
- Chance of flooding over 30 yrs
- 0.0%
- Est. flood insurance / yr
- $507 – $1,088
Fire risk 1/10 · Minimal
- Est. fire insurance / yr
- $717 – $1,331
Heat risk 2/10 · Minimal
- Hot days now (above 101°F)
- 7 days/yr
- Hot days in 30 yrs
- 17 days/yr
Wind risk 2/10 · Minimal
- Chance of severe wind over 30 yrs
- —
Air-quality risk 2/10 · Minimal
- Unhealthy air days now
- 1 days/yr
- Unhealthy air days in 30 yrs
- 2 days/yr
Risk factors via First Street. Map © Google.
Why this score? — see what drove the D grade
The composite is a weighted blend of 9 inputs, each scored 0–100. Each bar is that input's sub-score; the figure is the points it added to the 100-point composite (weight × sub-score).
- Cash flow +14.9/30.0
- ARV discount +7.5/15.0
- DSCR +4.6/10.0
- 1% rule +4.1/10.0
- Livability +3.4/5.0
- Rent growth +2.5/5.0
- Schools +2.5/10.0
- Condition / age +2.5/5.0
- Appreciation +0.0/10.0
$155,500
🖨 Deal sheet (PDF) 📄 Offer letter ✓ Due diligence
Listing remarks MLS
Looking for an affordable 3-bedroom home with access to the Tippecanoe River. Then this home is for you. This homes offer 1500 square feet of living space that includes a man cave/family room and ample parking in the from and back of the home. Schedule your showing today!
Key facts
- Ample parking
- 0.94 acre lot
- Built 1970
Tags
Neighborhood map
What this means for you Summary
Snapshot
- This is a 3-bed/1.0-bath single-family listed at $156k.
Deal economics
- At list price, monthly cash flow is $47 ($564/yr) — positive.
- The deal already cash-flows at list — no discount required.
- To meet the 1% rule (rent ≥ 1% of price), the offer needs to be $142k (8.7% below list).
- Recommended offer: $142k (8.7% below list) — sets the bar for 1% rule.
- Cap rate 6.7% vs local median 2.3% in Buffalo — top-decile yield for the area; either an underpriced asset or a hidden risk that comps aren't pricing in. Stress-test before assuming the spread holds.
Location & tenants
- Location reads 68/100 on livability (#232 in IN) — a middle-class / working-renter tenant base. Strengths: employment A+, cost of living A+, housing A+; Watch: amenities F, commute F, health & safety F.
- North White School Corporation (rural): math 25% / reading 34% proficiency, ranked #245 of 301 in IN (top 81%) — low school quality limits family demand, transient renter base, plan for 1-2y turnover.
- Zoned schools: North White Elementary School (math 29% / reading 28%, grade F, #727 of 994 statewide, top 73%, 433 students, 83% FRL); North White Middle School (math 17% / reading 32%, grade F, #251 of 330 statewide, top 77%, 201 students, 76% FRL); North White High School (math 34% / reading 64%, grade D, #123 of 369 statewide, top 36%, 266 students, 79% FRL) — zoned schools average 79% FRL vs 58% district-wide (21 pts higher); higher-poverty schools than district average — tighter screening recommended.
- Market conditions: 225 active listings in the ZIP; 47 units permitted in White County in 2024 (0 in 5+ unit buildings).
Forward outlook
- Local home prices are declining (-3.0%/yr); year-one equity from $1k of loan paydown is wiped out by about $5k of value loss. Plan a longer hold.
- White County population projected at -19% by 2050 — secular population decline; favor cash flow + early exit over multi-decade hold.
Negotiation context
- It's been on market 76 days — a 6% lower offer ($146k) is reasonable based on typical stale-listing flexibility.
- 2 sale attempts since 5y ago with the ask held roughly flat each time — persistent listings suggest the price (not the market) is what's stuck; bring a comps-based counter.
- Current owner paid $81k; list at $156k implies a 92% gain — meaningful room to come down on a strong offer.
Questions for the listing agent
- It's been on market 76 days. Have you received any prior offers? Is the seller open to a 9% concession, seller financing, or rate buy-down credit?
- Built in 1970 — when were the roof, HVAC, electrical panel, plumbing, and water heater last replaced?
- Why hasn't it sold? Are there any deal-killer items the seller is aware of (foundation, flood, title, zoning, code violations)?
- Is there a deadline driving the sale (1031 exchange, divorce, estate, relocation)? That informs how much negotiation room exists.
- Schools are F-rated, which usually means shorter tenancies and higher turnover. Who's the typical renter profile here, and what's been the actual vacancy rate?
- The area grade is low — what's the realistic commute time and amenity access for the typical tenant pool here? Any planned neighborhood developments (good or bad) we should know about?
- What's the average days-on-market for RENTAL listings here right now (not sales)? A rising rental-DOM trend means longer vacancies and softer asking-rent achievability than the comps imply.
- What's the recent tenant-quality profile in this submarket — average credit score on applications, eviction rate, late-payment / NSF rate, and stable-employment percentage? A property-management company in the area should have these aggregated.
- How much new for-sale + rental construction is in the pipeline within 1–3 miles? Heavy new supply typically softens prices + rents 12–24 months out; constrained supply supports both.
Investment metrics
- 1% rule
- 0.91% ✗
- Cap rate
- 6.66%
- Cash-on-cash
- 1.29%
- DSCR
- 1.06
- GRM
- 9.1
CMA / ARV
- ARV (median comp)
- $344,859
- List price
- $155,500
- Delta
- -54.91%
- Verdict
- UNDERPRICED
- Comps
- 14 within 1.0 mi
Show comp detail 3 sales within ~0.75 mi
| Address | Dist | Beds/Ba | Sqft | Sold | Price | $/sf | Match |
|---|---|---|---|---|---|---|---|
| 6019 E Liberty Dr | 0.11mi | 3/1.5 | 1,560 (-2%) | 13mo | $270,000 | $173 | 80 |
| 8176 N Hickman Rd | 0.27mi | 2/1.0 (-1) | 1,512 (-4%) | 9mo | $295,000 | $195 | 67 |
| 8379 N Kiger Dr | 0.43mi | 2/2.0 (-1) | 1,416 (-11%) | 21mo | $390,000 | $275 | 36 |
Match score weights: distance 35% · size 25% · config 20% · recency 20%. Top-matched comps best support the ARV.
Projected returns pro-forma
-3.0% appreciation · 3.0% rent growth · sell at horizon
- IRR
- -14.2%
- Equity multiple
- 0.49×
- Total profit
- $-22,185
- Equity at exit
- $23,186
- IRR
- -5.4%
- Equity multiple
- 0.65×
- Total profit
- $-15,379
- Equity at exit
- $13,445
Cash invested: $43,540 (down + closing). Projections, not guarantees.
Landlord ↔ Tenant lean methodology
- Overall (STATE)
- 90 Strongly Landlord-Friendly
- State Indiana
- 90 Strongly Landlord-Friendly · R+11
- County
- — inherits STATE
- City
- — inherits STATE
ZIP-level market 47960
- Home prices YoY
- -17.8%
- Active inventory
- 225
- Price-to-rent
- 9.1×
Monthly cashflow live
- Estimated rent
- $1,420 medium interval (Pro) →
- Mortgage (P&I)
- −$815
- Tax est. 1.5%
- −$194 /mo · $2,332/yr
- Insurance
- −$65
- HOA
- −$0
- Lot rent
- −$0
- Vacancy / Maint / Mgmt
- −$298
- Net cashflow
- $47
Break-even live
Sensitivity live
| Price | -10% $154 | -5% $101 | +0% $47 | +5% $-7 | +10% $-60 |
|---|---|---|---|---|---|
| Rent | -10% $-65 | -5% $-9 | +0% $47 | +5% $103 | +10% $159 |
| Rate | -1.0pp $125 | -0.5pp $87 | base $47 | +0.5pp $7 | +1.0pp $-34 |
UW: 25.0% down · 7.5% · 30yr · 1.5% tax · 5.0% vac · 8.0% maint · 8.0% mgmt
Financing live
Cash to close
- Down payment
- $38,875
- Closing costs
- $4,665
- Reserves months
- —
- Total cash needed
- —
Loan-product check · same deal, 3 products live
Conventional
25% down · 7.5% · 30yr
- Down + closing
- —
- Monthly P&I
- —
- Monthly cashflow
- —
- DSCR
- —
- Eligible?
- —
Personal DTI + credit; lowest rate.
DSCR
20% down · 8.5% · 30yr
- Down + closing
- —
- Monthly P&I
- —
- Monthly cashflow
- —
- DSCR
- —
- Eligible?
- —
No personal income docs; deal must DSCR.
Hard money
10% down · 12.0% · 12mo
- Down + closing
- —
- Monthly P&I
- —
- Monthly cashflow
- —
- DSCR
- —
- Eligible?
- —
Short-term bridge; refi at stabilization.
Listing history 22 events
-
2026-06-22days on market $155,500 Active 76 DOM
-
2026-06-21days on market $155,500 Active 75 DOM
-
2026-06-21days on market $155,500 Active 74 DOM
-
2026-06-18days on market $155,500 Active 72 DOM
-
2026-06-17days on market $155,500 Active 71 DOM
-
2026-06-16days on market $155,500 Active 70 DOM
-
2026-06-15days on market $155,500 Active 69 DOM
-
2026-06-13days on market $155,500 Active 67 DOM
-
2026-06-12days on market $155,500 Active 66 DOM
-
2026-06-09days on market $155,500 Active 63 DOM
-
2026-06-08days on market $155,500 Active 62 DOM
-
2026-06-07days on market $155,500 Active 61 DOM
-
2026-06-07days on market $155,500 Active 60 DOM
-
2026-06-04days on market $155,500 Active 57 DOM
-
2026-06-02days on market $155,500 Active 56 DOM
-
2026-06-01days on market $155,500 Active 55 DOM
-
2026-05-31days on market $155,500 Active 54 DOM
-
2026-05-31days on market $155,500 Active 53 DOM
-
2026-05-03price $155,500 272-char remark
Show marketing remark (272 chars)
Looking for an affordable 3-bedroom home with access to the Tippecanoe River. Then this home is for you. This homes offer 1500 square feet of living space that includes a man cave/family room and ample parking in the from and back of the home. Schedule your showing today!
-
2026-04-07$162,500 Active 272-char remark
Show marketing remark (272 chars)
Looking for an affordable 3-bedroom home with access to the Tippecanoe River. Then this home is for you. This homes offer 1500 square feet of living space that includes a man cave/family room and ample parking in the from and back of the home. Schedule your showing today!
-
2022-05-27soldstatus $80,900 251-char remark
Show marketing remark (251 chars)
Three bedroom, 1 bath home waiting for a new owner. Large parking area in front and back of house. Bonus room has many possibilities. Metal roof less than seven years old. Optional small yearly HOA will allow access to community grounds and boat ramp.
-
2021-12-17$109,900 251-char remark
Show marketing remark (251 chars)
Three bedroom, 1 bath home waiting for a new owner. Large parking area in front and back of house. Bonus room has many possibilities. Metal roof less than seven years old. Optional small yearly HOA will allow access to community grounds and boat ramp.
ⓘ Source: listings_history table (triggers on properties + properties_extension) + one-shot
backfill from property_details.listing_events for pre-trigger history.
Climate risk First Street
- Flood 1/10 Low FEMA zone X (unshaded) · 0% chance over 30 yrs
- Wildfire 1/10 Low
- Heat 2/10 Low 7 d/yr ≥101°F today · 17 d/yr by 30 yrs out
- Wind 2/10 Low
- Air quality 2/10 Low 1 unhealthy d/yr today · 2 by 30 yrs out
Nearby sold comps map
Loading sold comps map…
Walkable amenities ~0.75 mi
Loading nearby amenities…
Taxation est. · year 1
- Rental income
- $17,037
- − Mortgage interest
- −$8,710
- − Property taxes
- −$2,332
- − Insurance
- −$778
- − Repairs & maintenance
- −$1,363
- − Management
- −$1,363
- − Depreciation
- −$4,524
- Taxable loss
- −$2,033
- Est. tax savings @ 24.0%
- +$488
- After-tax cash flow
- $1,052/yr
For passive investors: Depreciation is non-cash, so a rental often shows a tax loss while cash-flowing — sheltering income. Rental losses are passive: they offset passive income freely, and up to $25,000/yr can offset ordinary (W-2) income if you actively participate and your MAGI is under $100k (phasing out to $0 by $150k); unused losses carry forward. On sale, claimed depreciation is recaptured at up to 25%, and gains may owe capital-gains tax (a 1031 exchange can defer both). Figures are a year-1 estimate at your 24.0% rate — not tax advice; consult a CPA.
Schools (NCES district)
- District
- North White School Corporation
- NCES district ID
- 1808130
- Math proficiency
- 25% ▼ -15.00%
- Reading proficiency
- 34% ▼ -9.00%
- Median HH income
- $42,460
- Composite
- 25.03/100
- National rank
- #7550
- State rank
- #245 of 301 in IN
Livability — Buffalo
- Score
- 68/100
- State rank
- #232
- US rank
- #10015
Category grades
Schools grade is shown separately in the Schools card above.
Census & demographics
- City population
- 22
- Population (ZIP)
- 15,313
Population outlook (White County) Hauer SSP2
- Today (2025)
- 23,006 people
- By 2030
- 22,204 · -3.5%
- By 2040
- 20,441 · -11.1%
- By 2050
- 18,711 · -18.7%
- By 2075
- 14,989 · -34.8%
- By 2100
- 10,896 · -52.6%
Race, ethnicity, and origin ACS 2023
- Neighborhood character
- Predominantly White (92%)
- Race & ethnicity
- White 92% Hispanic / Latino 6% Two or more races 3%
- Hispanic origin (detail)
- Mexican 5%
- Common ancestry
- Romanian 4% Iranian 3% Lithuanian 2%
- Foreign-born
- 4% · Canada
- Languages at home
- 94% English-only · Spanish 4%
Political lean MEDSL · White
- 2024 margin
- Solid R (+45.0) · D 26.4% · R 71.4% · Other 2.2%
- 2008→2024 swing
- -36.7pp toward R · 2008: -8.3pp · 2024: -45.0pp
- All cycles
- 2024: R+45.0 2020: R+44.1 2016: R+42.9 2012: R+23.6 2008: R+8.3
Not yet ingested
- Civics
- —
Market trends
- HPI YoY
- ▼ -52.85%
- Current HPI
- 243.8468
- Rent YoY
- —
- Metro
- —
- State GDP YoY
- ▲ 2.90%
- F500 in state
- 18
Industry mix (Fortune 500 HQ in IN)
| Industry | F500 HQs | Revenue |
|---|---|---|
| Industrial Machinery | 2 | $37B |
|
||
| Healthcare | 1 | $177B |
|
||
| Pharmaceuticals | 1 | $45B |
|
||
| Metals / Steel | 1 | $18B |
|
||
| Agriculture | 1 | $17B |
|
||
| Packaging | 1 | $12B |
|
||
Price history
+41.5% since first listed4 events — show timeline
- 2026-05-03 Price Changed $155,500 IRMLS
- 2026-04-07 Listed $162,500 IRMLS
- 2022-05-27 Sold (MLS) $80,900 IRMLS
- 2021-12-17 Listed $109,900 IRMLS
Property tax history
+5.7%/yrLatest (2024): $143 · +47.9% YoY. Source: county tax records.
Cash-flow waterfall
monthlySold comps — $/sqft
last 12 mo · ≤1 miLoading sold comps…