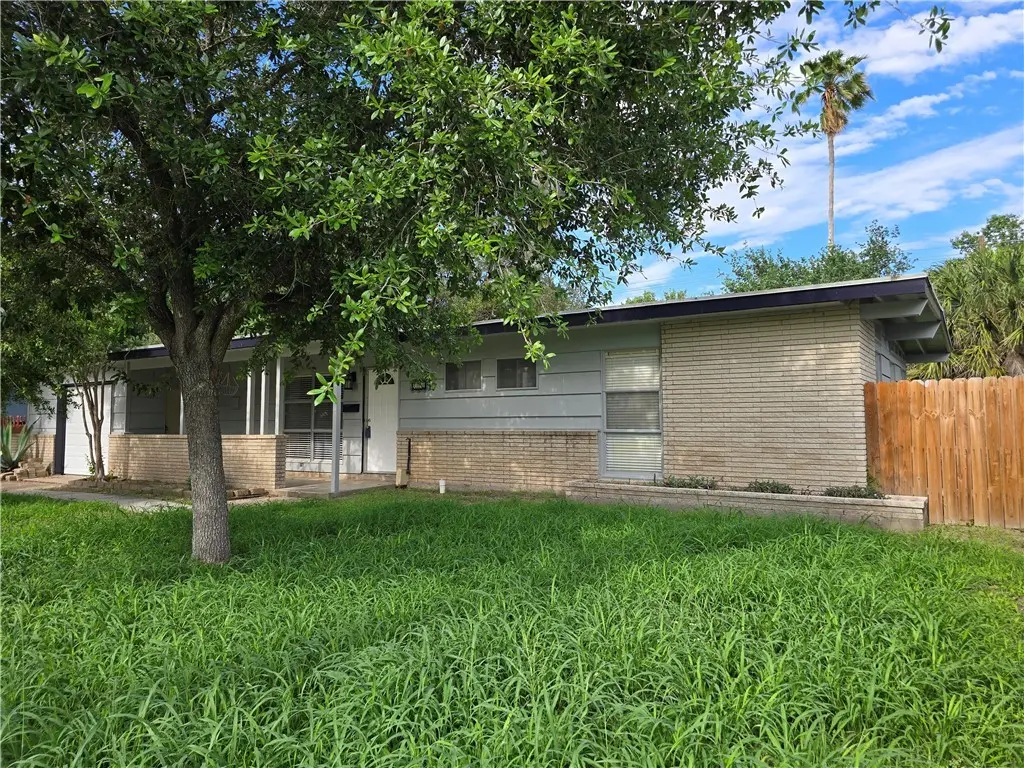
730 Santa Anita Dr · Kingsville, TX
Flood risk 1/10 · Minimal
- FEMA flood zone
- X (unshaded)
- Chance of flooding over 30 yrs
- 0.0%
- Est. flood insurance / yr
- $507 – $1,088
Fire risk 5/10 · Moderate
- Est. fire insurance / yr
- $1,222 – $2,270
Heat risk 9/10 · Severe
- Hot days now (above 111°F)
- 7 days/yr
- Hot days in 30 yrs
- 22 days/yr
Wind risk 8/10 · Major
- Chance of severe wind over 30 yrs
- 99.0%
Air-quality risk 1/10 · Minimal
- Unhealthy air days now
- 0 days/yr
- Unhealthy air days in 30 yrs
- 0 days/yr
Risk factors via First Street. Map © Google.
Why this score? — see what drove the D grade
The composite is a weighted blend of 9 inputs, each scored 0–100. Each bar is that input's sub-score; the figure is the points it added to the 100-point composite (weight × sub-score).
- Cash flow +14.3/30.0
- ARV discount +6.5/15.0
- 1% rule +4.8/10.0
- DSCR +4.4/10.0
- Rent growth +4.3/5.0
- Livability +3.5/5.0
- Condition / age +2.5/5.0
- Schools +1.5/10.0
- Appreciation +0.0/10.0
$180,000
🖨 Deal sheet 📄 Offer letter ✓ Due diligence
Listing remarks
Location is everything! 730 Santa Anita is in a prime location, adjacent to Texas A & M University, Kingsville and close to Naval Air Station, Kingsville. If you are looking for an investment opportunity, to gain progressive income, this property will not disappoint. Notable updates: New Gas stove, facia boards replaced, freshley painted exterior & a few other repairs. The 4 bedroom, 2 bath home offers Saltillo flooring throughout, spacious bedrooms, plenty of living & dining room space, oversized backyard perfect for entertaining under the mature beautiful trees or enjoy the large, covered patio. Newer fence has been installed, Newer AC (approx 3 yrs). There is also a bon
Key facts
- Large covered patio
- New gas stove
- Oversized backyard
Tags
Property features AI
Finance
- HOA & community: Gutter(s) listed as a community feature
Exterior
- Parking: Concrete parking; Front entry; Garage; 1 covered space; 3 total parking spaces; 1-car garage
- Security: Smoke detector(s)
- Utilities: Municipal utilities; Public sewer / Sewer available
- Home design: Single-story; Pillar/post/pier foundation; Interior lot; City street frontage
- Construction: Asbestos construction material
- Exterior features: Rain gutters; Covered patio; Patio; Workshop; Wood fencing
Interior
- Kitchen: Gas cooktop; Gas oven; Gas range; Disposal; Refrigerator
- Flooring: Tile
- Bathrooms: 2 full bathrooms
- Heating & cooling: Central heating; Electric heating; Window unit heating; Central air conditioning; Window unit air conditioning
- Interior features: Breakfast bar; Ceiling fan(s)
- Laundry & utility: Washer hookup; Dryer hookup
Neighborhood map
What this means for you Summary
Snapshot
- This is a 4-bed/2.0-bath single-family listed at $180k.
Deal economics
- At list price, monthly cash flow is $34 ($408/yr) — positive.
- The deal already cash-flows at list — no discount required.
- To meet the 1% rule (rent ≥ 1% of price), the offer needs to be $176k (2.1% below list).
- Recommended offer: $175k (3.0% below list) — sets the bar for market timing.
Location & tenants
- Location reads 70/100 on livability (#364 in TX) — a middle-class / working-renter tenant base. Strengths: cost of living A+, housing A+, health & safety A+; Watch: schools D+, employment D, amenities F.
- Kingsville ISD (town): math 13% / reading 22% proficiency, ranked #800 of 826 in TX (top 97%) — low school quality limits family demand, transient renter base, plan for 1-2y turnover; 71% free/reduced lunch — lower-income household profile, screen leases tightly.
- Market conditions: Rents rising fast (+7.2%/yr); 216 active listings in the ZIP; 5 comparable units currently listed for rent nearby; rentals lingering (median 44d on market — plan ~5-8 weeks vacancy on turnover, expect pricing pressure); 80% of comp listings sitting > 30 days — soft ceiling on asking rent; 24 units permitted in Kleberg County in 2024 (0 in 5+ unit buildings).
- This rent runs 35% of the median local income ($61k/yr) — at the standard rent-burdened threshold; future hikes will face affordability resistance.
Forward outlook
- Local home prices are declining (-3.0%/yr); year-one equity from $1k of loan paydown is wiped out by about $5k of value loss. Plan a longer hold.
- Kleberg County population projected at +9% by 2050 — modest demand growth; plan on rents tracking national, not racing it.
Negotiation context
- It's been on market 44 days — a 3% lower offer ($175k) is reasonable based on typical stale-listing flexibility.
- 5 sale attempts since 8y ago with the ask held roughly flat each time — persistent listings suggest the price (not the market) is what's stuck; bring a comps-based counter.
Risks & watch-outs
- Watch-outs: built in 1955 — expect roof / HVAC / electrical / plumbing capex.
- Climate carrying-cost: severe wind risk, 99% chance of damaging wind over 30y; moderate wildfire risk; extreme-heat days projected 7→22/yr by 2055 (HVAC capex compounding) — expect insurance premiums to compound above CPI over the hold.
Questions for the listing agent
- It's been on market 44 days. Have you received any prior offers? Is the seller open to a 3% concession, seller financing, or rate buy-down credit?
- Built in 1955 — when were the roof, HVAC, electrical panel, plumbing, and water heater last replaced?
- Is there a deadline driving the sale (1031 exchange, divorce, estate, relocation)? That informs how much negotiation room exists.
- Schools are D-rated, which usually means shorter tenancies and higher turnover. Who's the typical renter profile here, and what's been the actual vacancy rate?
- The area grade is low — what's the realistic commute time and amenity access for the typical tenant pool here? Any planned neighborhood developments (good or bad) we should know about?
- What's the average days-on-market for RENTAL listings here right now (not sales)? A rising rental-DOM trend means longer vacancies and softer asking-rent achievability than the comps imply.
- What's the recent tenant-quality profile in this submarket — average credit score on applications, eviction rate, late-payment / NSF rate, and stable-employment percentage? A property-management company in the area should have these aggregated.
- How much new for-sale + rental construction is in the pipeline within 1–3 miles? Heavy new supply typically softens prices + rents 12–24 months out; constrained supply supports both.
Investment metrics
- 1% rule
- 0.98% ✗
- Cap rate
- 6.52%
- Cash-on-cash
- 0.81%
- DSCR
- 1.04
- GRM
- 8.5
CMA / ARV
- ARV (median comp)
- $176,122
- List price
- $180,000
- Delta
- 2.20%
- Verdict
- FAIR
- Comps
- 20 within 1.0 mi
Show comp detail 12 sales within ~0.75 mi
| Address | Dist | Beds/Ba | Sqft | Sold | Price | $/sf | Match |
|---|---|---|---|---|---|---|---|
| 1719 Santa Fe | 0.41mi | 3/2.0 (-1) | 1,524 (-1%) | 1mo | $227,000 | $149 | 73 |
| 708 Santa Anita Dr | 0.16mi | 3/2.0 (-1) | 1,415 (-8%) | 2mo | $237,800 | $168 | 72 |
| 1635 Santa Cecilia Dr | 0.37mi | 3/2.0 (-1) | 1,554 (+1%) | 6mo | $209,000 | $134 | 71 |
| 728 Santa Anita Dr | 0.01mi | 3/2.0 (-1) | 1,698 (+10%) | 8mo | $199,900 | $118 | 70 |
| 1506 Santa Cecilia Dr | 0.21mi | 3/2.0 (-1) | 1,714 (+11%) | 5mo | $220,000 | $128 | 62 |
| 722 Santa Elena Dr | 0.23mi | 3/2.0 (-1) | 1,440 (-6%) | 16mo | $199,900 | $139 | 60 |
| 713 Santa Anita | 0.06mi | 3/2.0 (-1) | 1,360 (-12%) | 18mo | $99,950 | $73 | 58 |
| 1605 Santa Cecilia Dr | 0.29mi | 3/2.0 (-1) | 1,722 (+12%) | 9mo | $219,000 | $127 | 54 |
| 1615 Santa Cecilia | 0.31mi | 3/2.0 (-1) | 1,704 (+11%) | 15mo | $249,000 | $146 | 50 |
| 625 W Richard Ave | 0.70mi | 3/1.0 (-1) | 1,577 (+2%) | 10mo | $165,000 | $105 | 46 |
| 714 E Avenue C Ave | 0.57mi | 3/2.0 (-1) | 1,328 (-14%) | 2mo | $75,000 | $56 | 43 |
| 530 W Richard Ave | 0.73mi | 3/2.0 (-1) | 1,764 (+15%) | 12mo | $39,900 | $23 | 26 |
Match score weights: distance 35% · size 25% · config 20% · recency 20%. Top-matched comps best support the ARV.
Projected returns pro-forma
-3.0% appreciation · 7.18% rent growth · sell at horizon
- IRR
- -10.0%
- Equity multiple
- 0.62×
- Total profit
- $-19,182
- Equity at exit
- $26,839
- IRR
- 4.7%
- Equity multiple
- 1.42×
- Total profit
- $21,034
- Equity at exit
- $15,563
Cash invested: $50,400 (down + closing). Projections, not guarantees.
Landlord ↔ Tenant lean methodology
- Overall (STATE)
- 87 Strongly Landlord-Friendly
- State Texas
- 87 Strongly Landlord-Friendly · R+5
- County
- — inherits STATE
- City
- — inherits STATE
ZIP-level market 78363
- Rents YoY
- 7.2%
- Active inventory
- 216
- Price-to-rent
- 8.5×
Monthly cashflow live
- Estimated rent
- $1,763 high interval (Pro) →
- Mortgage (P&I)
- −$944
- Tax from tax record
- −$340 /mo · $4,075/yr
- Insurance
- −$75
- HOA
- −$0
- Vacancy / Maint / Mgmt
- −$370
- Net cashflow
- $34
Break-even live
UW: 25.0% down · 7.5% · 30yr · 1.5% tax · 5.0% vac · 8.0% maint · 8.0% mgmt
Financing live
Cash to close
- Down payment
- $45,000
- Closing costs
- $5,400
- Reserves months
- —
- Total cash needed
- —
Loan-product check · same deal, 3 products live
Conventional
25% down · 7.5% · 30yr
- Down + closing
- —
- Monthly P&I
- —
- Monthly cashflow
- —
- DSCR
- —
- Eligible?
- —
Personal DTI + credit; lowest rate.
DSCR
20% down · 8.5% · 30yr
- Down + closing
- —
- Monthly P&I
- —
- Monthly cashflow
- —
- DSCR
- —
- Eligible?
- —
No personal income docs; deal must DSCR.
Hard money
10% down · 12.0% · 12mo
- Down + closing
- —
- Monthly P&I
- —
- Monthly cashflow
- —
- DSCR
- —
- Eligible?
- —
Short-term bridge; refi at stabilization.
Rent comps 5 comps
| Address | Beds | Baths | Sqft | Rent | $/sqft | DOM | Units | Dist |
|---|---|---|---|---|---|---|---|---|
| 1204 W Lee Ave Kingsville, TX | 4.0 | 2.5 | 1970 | $1,825 | $0.93 | 43d | 1 | 0.35mi |
| 629 W Nettie Ave Kingsville, TX | 3.0 | 2.0 | 1762 | $1,495 | $0.85 | 43d | 1 | 0.60mi |
| 614 W Alice Ave Kingsville, TX | 3.0 | 2.0 | 1713 | $1,599 | $0.93 | 43d | 1 | 0.69mi |
| 503 W Mesquite Ave Kingsville, TX | 3.0 | 2.0 | 1400 | $1,500 | $1.07 | 13d | 1 | 0.79mi |
| 307 W Alice Ave Kingsville, TX | 3.0 | 2.0 | 1600 | $1,500 | $0.94 | 43d | 1 | 0.97mi |
Listing history 30 events
-
2026-06-19days on market $180,000 Active 44 DOM
-
2026-06-18days on market $180,000 Active 43 DOM
-
2026-06-17days on market $180,000 Active 42 DOM
-
2026-06-16days on market $180,000 Active 41 DOM
-
2026-06-15days on market $180,000 Active 40 DOM
-
2026-06-14days on market $180,000 Active 38 DOM
-
2026-06-12days on market $180,000 Active 37 DOM
-
2026-06-09days on market $180,000 Active 34 DOM
-
2026-06-08days on market $180,000 Active 33 DOM
-
2026-06-07days on market $180,000 Active 32 DOM
-
2026-06-05days on market $180,000 Active 29 DOM
-
2026-06-03days on market $180,000 Active 28 DOM
-
2026-06-02days on market $180,000 Active 27 DOM
-
2026-06-01days on market $180,000 Active 26 DOM
-
2026-05-31days on market $180,000 Active 25 DOM
-
2026-05-30days on market $180,000 Active 24 DOM
-
2026-05-06$180,000 Active 961-char remark
-
2026-03-20status Active
-
2026-03-17status Pending
-
2026-03-10historical
-
2025-09-29price $180,000
-
2025-08-21price $193,000
-
2025-06-17status Active
-
2025-05-05status Pending
-
2025-05-05price $198,000
-
2025-02-24$185,000 Active
-
2018-10-01soldstatus
-
2018-07-06$118,500
-
2012-08-01soldstatus
-
2010-05-13soldstatus
ⓘ Source: listings_history table (triggers on properties + properties_extension) + one-shot
backfill from property_details.listing_events for pre-trigger history.
Tax reassessment forecast TX · Resets to sale price
- Current annual tax
- $4,075 · $340/mo
- Projected year-2 tax
- $4,075 · $340/mo
- Expected delta
- $0/yr ($0/mo · 0.0%)
ⓘ Screening estimate from a state-policy table — verify with the county assessor before closing.
Climate risk First Street
- Flood 1/10 Low FEMA zone X (unshaded) · 0% chance over 30 yrs
- Wildfire 5/10 Major
- Heat 9/10 Extreme 7 d/yr ≥111°F today · 22 d/yr by 30 yrs out
- Wind 8/10 Severe 99% chance of damaging wind over 30 yrs
- Air quality 1/10 Low 0 unhealthy d/yr today · 0 by 30 yrs out
Nearby sold comps map
Loading sold comps map…
Walkable amenities ~0.75 mi
Loading nearby amenities…
Taxation est. · year 1
- Rental income
- $21,152
- − Mortgage interest
- −$10,083
- − Property taxes
- −$4,075
- − Insurance
- −$900
- − Repairs & maintenance
- −$1,692
- − Management
- −$1,692
- − Depreciation
- −$5,236
- Taxable loss
- −$2,527
- Est. tax savings @ 24.0%
- +$606
- After-tax cash flow
- $1,014/yr
For passive investors: Depreciation is non-cash, so a rental often shows a tax loss while cash-flowing — sheltering income. Rental losses are passive: they offset passive income freely, and up to $25,000/yr can offset ordinary (W-2) income if you actively participate and your MAGI is under $100k (phasing out to $0 by $150k); unused losses carry forward. On sale, claimed depreciation is recaptured at up to 25%, and gains may owe capital-gains tax (a 1031 exchange can defer both). Figures are a year-1 estimate at your 24.0% rate — not tax advice; consult a CPA.
Schools (NCES district)
- District
- Kingsville ISD
- NCES district ID
- 4825680
- Math proficiency
- 13% ▼ -22.00%
- Reading proficiency
- 22% ▼ -7.00%
- Median HH income
- $36,308
- Composite
- 14.5/100
- National rank
- #9425
- State rank
- #800 of 826 in TX
Livability — Kingsville
- Score
- 70/100
- State rank
- #364
- US rank
- #7787
Category grades
Schools grade is shown separately in the Schools card above.
Census & demographics
- Census place
- Kingsville, TX
- County
- Kleberg County · 28,920 people
- City population
- 28,920
- Metro
- Kingsville, TX
- Population (ZIP)
- 28,920
- Household income
- $60,574
- Rent vs Own
- Severe rent burden
- 1663.0
Population outlook (Kleberg County) Hauer SSP2
- Today (2025)
- 31,615 people
- By 2030
- 32,054 · +1.4%
- By 2040
- 33,008 · +4.4%
- By 2050
- 34,536 · +9.2%
- By 2075
- 40,931 · +29.5%
- By 2100
- 46,001 · +45.5%
Race, ethnicity, and origin ACS 2023
- Neighborhood character
- Predominantly Hispanic (72%)
- Race & ethnicity
- Hispanic / Latino 72% Two or more races 36% White 20% Black 3% Asian 1% Native American 1%
- Hispanic origin (detail)
- Mexican 67%
- Common ancestry
- Italian 2% Slovak 1% Portuguese 1%
- Foreign-born
- 7% · Canada, China
- Languages at home
- 65% English-only · Spanish 32% Other Indo-European 1%
Political lean MEDSL · Kleberg
- 2024 margin
- R (+12.7) · D 43.3% · R 56.1%
- 2008→2024 swing
- -20.0pp toward R · 2008: 7.2pp · 2024: -12.7pp
- All cycles
- 2024: R+12.7 2020: R+1.7 2016: D+3.7 2012: D+7.8 2008: D+7.2
Not yet ingested
- Civics
- —
Market trends
- HPI YoY
- ▼ -87.12%
- Current HPI
- 147.6473
- Rent YoY
- ▲ 7.18%
- Metro
- Kingsville, TX
- State GDP YoY
- ▲ 3.95%
- F500 in state
- 110
Industry mix (Fortune 500 HQ in TX)
| Industry | F500 HQs | Revenue |
|---|---|---|
| Energy | 16 | $1,198B |
|
||
| Technology | 5 | $198B |
|
||
| Engineering / Construction | 4 | $72B |
|
||
| Energy Services | 3 | $60B |
|
||
| Utilities | 3 | $41B |
|
||
| Healthcare | 2 | $330B |
|
||
Price history
+51.9% since first listed14 events — show timeline
- 2026-05-06 Listed $180,000 CBMLS
- 2026-03-20 Relisted — CBMLS
- 2026-03-17 Pending — CBMLS
- 2026-03-10 Delisted — CBMLS
- 2025-09-29 Price Changed $180,000 CBMLS
- 2025-08-21 Price Changed $193,000 CBMLS
- 2025-06-17 Relisted — CBMLS
- 2025-05-05 Pending — CBMLS
- 2025-05-05 Price Changed $198,000 CBMLS
- 2025-02-24 Listed $185,000 CBMLS
- 2018-10-01 Sold (Public Records) — Public Records
- 2018-07-06 Listed $118,500 CBMLS
- 2012-08-01 Sold (Public Records) — Public Records
- 2010-05-13 Sold (Public Records) — Public Records
Property tax history
+2.3%/yrLatest (2025): $4,075 · -1.6% YoY. Source: county tax records.
Cash-flow waterfall
monthlySold comps — $/sqft
last 12 mo · ≤1 miLoading sold comps…