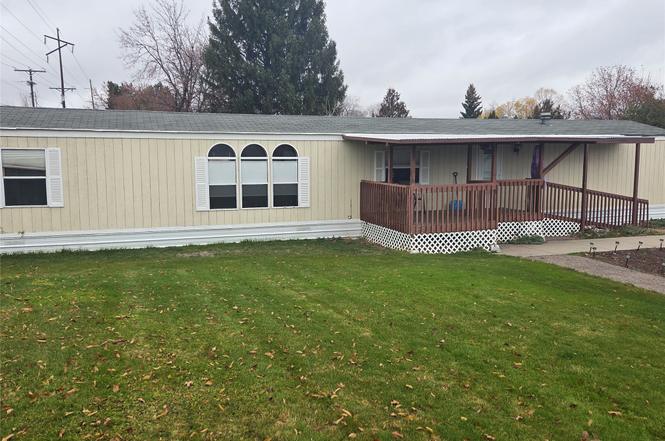
112 S Travois St · Missoula, MT
Flood risk 3/10 · Minor
- FEMA flood zone
- X (unshaded)
- Chance of flooding over 30 yrs
- 0.1%
- Est. flood insurance / yr
- $507 – $1,088
Fire risk 8/10 · Major
- Est. fire insurance / yr
- $918 – $1,706
Heat risk 3/10 · Minor
- Hot days now (above 92°F)
- 7 days/yr
- Hot days in 30 yrs
- 15 days/yr
Wind risk 1/10 · Minimal
- Chance of severe wind over 30 yrs
- —
Air-quality risk 10/10 · Severe
- Unhealthy air days now
- 26 days/yr
- Unhealthy air days in 30 yrs
- 32 days/yr
Risk factors via First Street. Map © Google.
Why this score? — see what drove the C+ grade
The composite is a weighted blend of 9 inputs, each scored 0–100. Each bar is that input's sub-score; the figure is the points it added to the 100-point composite (weight × sub-score).
- Cash flow +30.0/30.0
- 1% rule +10.0/10.0
- DSCR +10.0/10.0
- Livability +4.0/5.0
- Schools +3.5/10.0
- Rent growth +3.1/5.0
- Condition / age +2.5/5.0
- ARV discount +0.0/15.0
- Appreciation +0.0/10.0
$121,000
🖨 Deal sheet 📄 Offer letter ✓ Due diligence
Key facts
- Corner lot
- Built 1996
- Listed 209 days
Tags
Property features AI
Finance
- Financial info: Land is leased; Annual tax amount listed
Exterior
- Home design: Manufactured home (Single Wide); Residential property
- Construction: Foundation: See remarks
- Exterior features: Located in a mobile court
Interior
- Kitchen: Range; Dishwasher; Refrigerator
- Bathrooms: 1 full bathroom; 1 three-quarter bathroom
- Interior features: Dryer; Dishwasher; Range; Refrigerator; Washer; No basement
- Laundry & utility: Washer and Dryer
Neighborhood map
What this means for you Summary
Snapshot
- This is a 3-bed/2.0-bath manufactured listed at $121k.
Deal economics
- At list price, monthly cash flow is $1k ($14k/yr) — positive.
- The deal already cash-flows at list — no discount required.
- Meets the 1% rule at list price ($3k rent vs $121k).
- Recommended offer: $106k (12.0% below list) — sets the bar for market timing.
- Cap rate 18.1% vs local median 1.7% in Missoula — top-decile yield for the area; either an underpriced asset or a hidden risk that comps aren't pricing in. Stress-test before assuming the spread holds.
Location & tenants
- Location reads 79/100 on livability (#17 in MT, #2,351 nationally) — a middle-class / working-renter tenant base. Strengths: amenities A+, commute A+, health & safety A+; Watch: employment C-, crime F.
- Missoula H S (urban): math 31% / reading 52% proficiency, ranked #53 of 116 in MT (top 46%) — families likely to look elsewhere, expect single-tenant / working-renter base with shorter leases.
- Market conditions: Rents rising (+2.4%/yr); 248 active listings in the ZIP; 3 comparable units currently listed for rent nearby; rentals lingering (median 44d on market — plan ~5-8 weeks vacancy on turnover, expect pricing pressure); 100% of comp listings sitting > 30 days — soft ceiling on asking rent; solid renter incomes; 773 units permitted in Missoula County in 2024 (354 in 5+ unit buildings).
- This rent runs 38% of the median local income ($80k/yr) — at the standard rent-burdened threshold; future hikes will face affordability resistance.
Forward outlook
- Local home prices are declining (-3.0%/yr); year-one equity from $837 of loan paydown is wiped out by about $4k of value loss. Plan a longer hold.
- Missoula County population projected at +23% by 2050 — long-run rental-demand tailwind backs the buy-and-hold thesis.
- At projected returns (-3.0% appreciation + 2.4% rent growth), your $34k cash investment doubles in ~3 years — after that, you're playing with house money.
Negotiation context
- It's been on market 210 days — a 12% lower offer ($106k) is reasonable based on typical stale-listing flexibility.
Risks & watch-outs
- Climate carrying-cost: severe wildfire risk — expect insurance premiums to compound above CPI over the hold.
Questions for the listing agent
- It's been on market 210 days. Have you received any prior offers? Is the seller open to a 12% concession, seller financing, or rate buy-down credit?
- Why hasn't it sold? Are there any deal-killer items the seller is aware of (foundation, flood, title, zoning, code violations)?
- Is there a deadline driving the sale (1031 exchange, divorce, estate, relocation)? That informs how much negotiation room exists.
- Schools are B-rated — typically a magnet for longer-tenancy family renters. What's the average tenant stay here, and is there a school-zone premium baked into asking?
- Crime grade is F in this area — have there been break-ins, vandalism, or insurance claims at this property in the last 3 years? What carrier currently insures it and at what premium?
- What's the average days-on-market for RENTAL listings here right now (not sales)? A rising rental-DOM trend means longer vacancies and softer asking-rent achievability than the comps imply.
- What's the recent tenant-quality profile in this submarket — average credit score on applications, eviction rate, late-payment / NSF rate, and stable-employment percentage? A property-management company in the area should have these aggregated.
- How much new for-sale + rental construction is in the pipeline within 1–3 miles? Heavy new supply typically softens prices + rents 12–24 months out; constrained supply supports both.
Investment metrics
- 1% rule
- 2.12% ✓
- Cap rate
- 18.14%
- Cash-on-cash
- 42.30%
- DSCR
- 2.88
- GRM
- 3.9
CMA / ARV
- ARV (on-the-fly)
- $89,600
- Comps found
- 6
Show comp detail 6 sales within ~0.75 mi
| Address | Dist | Beds/Ba | Sqft | Sold | Price | $/sf | Match |
|---|---|---|---|---|---|---|---|
| 230 N Travois | 0.10mi | 3/2.0 | 1,280 (0%) | 15mo | $99,900 | $78 | 83 |
| 407 Surrey Ln N | 0.16mi | 2/2.0 (-1) | 1,300 (+2%) | 3mo | $79,999 | $62 | 82 |
| 705 E Travois St | 0.15mi | 2/2.0 (-1) | 1,216 (-5%) | 0mo | $50,000 | $41 | 79 |
| 507 S Caravan St | 0.17mi | 2/2.0 (-1) | 1,352 (+6%) | 1mo | $95,000 | $70 | 77 |
| 225 N Travois | 0.18mi | 3/2.0 | 1,216 (-5%) | 13mo | $139,900 | $115 | 73 |
| 540 S Caravan St | 0.20mi | 2/2.0 (-1) | 1,120 (-12%) | 20mo | $69,000 | $62 | 48 |
Match score weights: distance 35% · size 25% · config 20% · recency 20%. Top-matched comps best support the ARV.
Projected returns pro-forma
-3.0% appreciation · 2.35% rent growth · sell at horizon
- IRR
- 38.3%
- Equity multiple
- 2.62×
- Total profit
- $54,824
- Equity at exit
- $18,041
- IRR
- 44.4%
- Equity multiple
- 5.10×
- Total profit
- $139,076
- Equity at exit
- $10,462
Cash invested: $33,880 (down + closing). Projections, not guarantees.
Landlord ↔ Tenant lean methodology
- Overall (STATE)
- 82 Strongly Landlord-Friendly
- State Montana
- 82 Strongly Landlord-Friendly · R+11
- County
- — inherits STATE
- City
- — inherits STATE
ZIP-level market 59808
- Rents YoY
- 2.4%
- Active inventory
- 248
- Price-to-rent
- 3.9×
Monthly cashflow live
- Estimated rent
- $2,570 medium interval (Pro) →
- Mortgage (P&I)
- −$635
- Tax est. 1.5%
- −$151 /mo · $1,815/yr
- Insurance
- −$50
- HOA
- −$0
- Vacancy / Maint / Mgmt
- −$540
- Net cashflow
- $1,194
Break-even live
UW: 25.0% down · 7.5% · 30yr · 1.5% tax · 5.0% vac · 8.0% maint · 8.0% mgmt
Financing live
Cash to close
- Down payment
- $30,250
- Closing costs
- $3,630
- Reserves months
- —
- Total cash needed
- —
Loan-product check · same deal, 3 products live
Conventional
25% down · 7.5% · 30yr
- Down + closing
- —
- Monthly P&I
- —
- Monthly cashflow
- —
- DSCR
- —
- Eligible?
- —
Personal DTI + credit; lowest rate.
DSCR
20% down · 8.5% · 30yr
- Down + closing
- —
- Monthly P&I
- —
- Monthly cashflow
- —
- DSCR
- —
- Eligible?
- —
No personal income docs; deal must DSCR.
Hard money
10% down · 12.0% · 12mo
- Down + closing
- —
- Monthly P&I
- —
- Monthly cashflow
- —
- DSCR
- —
- Eligible?
- —
Short-term bridge; refi at stabilization.
Rent comps 3 comps
| Address | Beds | Baths | Sqft | Rent | $/sqft | DOM | Units | Dist |
|---|---|---|---|---|---|---|---|---|
| 3705 England Blvd Missoula, MT | 3.0 | 2.0 | 1275 | $2,525 | $1.98 | 44d | 1 | 1.08mi |
| 4000 Mullan Rd Missoula, MT | 1.0–3.0 | 1.0–2.0 | 1041 | $2,995 | $2.88 | 44d | 8 | 1.19mi |
| 2175 Sagebrush Rd Missoula, MT | 1.0–3.0 | 1.0–2.0 | 1055 | $3,116 | $2.95 | 44d | 128 | 1.32mi |
Listing history 22 events
-
2026-06-19days on market $121,000 Active 210 DOM
-
2026-06-18days on market $121,000 Active 209 DOM
-
2026-06-17days on market $121,000 Active 208 DOM
-
2026-06-16days on market $121,000 Active 207 DOM
-
2026-06-15days on market $121,000 Active 206 DOM
-
2026-06-14days on market $121,000 Active 204 DOM
-
2026-06-13days on market $121,000 Active 203 DOM
-
2026-06-10days on market $121,000 Active 201 DOM
-
2026-06-09days on market $121,000 Active 200 DOM
-
2026-06-08days on market $121,000 Active 199 DOM
-
2026-06-07days on market $121,000 Active 198 DOM
-
2026-06-05days on market $121,000 Active 195 DOM
-
2026-06-03days on market $121,000 Active 194 DOM
-
2026-06-02days on market $121,000 Active 193 DOM
-
2026-06-01days on market $121,000 Active 192 DOM
-
2026-05-31days on market $121,000 Active 191 DOM
-
2026-05-30days on market $121,000 Active 190 DOM
-
2026-05-14price $121,000
-
2026-04-07price $124,500
-
2026-03-08price $129,500
-
2026-01-02price $135,000
-
2025-11-21$140,000 Active
ⓘ Source: listings_history table (triggers on properties + properties_extension) + one-shot
backfill from property_details.listing_events for pre-trigger history.
Climate risk First Street
- Flood 3/10 Moderate FEMA zone X (unshaded) · 10% chance over 30 yrs
- Wildfire 8/10 Severe
- Heat 3/10 Moderate 7 d/yr ≥92°F today · 15 d/yr by 30 yrs out
- Wind 1/10 Low
- Air quality 10/10 Extreme 26 unhealthy d/yr today · 32 by 30 yrs out
Nearby sold comps map
Loading sold comps map…
Walkable amenities ~0.75 mi
Loading nearby amenities…
Taxation est. · year 1
- Rental income
- $30,842
- − Mortgage interest
- −$6,778
- − Property taxes
- −$1,815
- − Insurance
- −$605
- − Repairs & maintenance
- −$2,467
- − Management
- −$2,467
- − Depreciation
- −$3,520
- Taxable income
- $13,190
- Est. tax owed @ 24.0%
- −$3,166
- After-tax cash flow
- $11,166/yr
For passive investors: Depreciation is non-cash, so a rental often shows a tax loss while cash-flowing — sheltering income. Rental losses are passive: they offset passive income freely, and up to $25,000/yr can offset ordinary (W-2) income if you actively participate and your MAGI is under $100k (phasing out to $0 by $150k); unused losses carry forward. On sale, claimed depreciation is recaptured at up to 25%, and gains may owe capital-gains tax (a 1031 exchange can defer both). Figures are a year-1 estimate at your 24.0% rate — not tax advice; consult a CPA.
Schools (NCES district)
- District
- Missoula H S
- NCES district ID
- 3018540
- Math proficiency
- 31% ▼ -8.00%
- Reading proficiency
- 52% ▼ -1.00%
- Median HH income
- $41,814
- Composite
- 34.87/100
- National rank
- #5087
- State rank
- #53 of 116 in MT
Livability — Missoula
- Score
- 79/100
- State rank
- #17
- US rank
- #2351
Category grades
Schools grade is shown separately in the Schools card above.
Census & demographics
- Census place
- Missoula, MT
- County
- Missoula County · 100,878 people
- City population
- 100,878
- Metro
- Missoula, MT
- Population (ZIP)
- 23,574
- Household income
- $80,239
- Rent vs Own
- Severe rent burden
- 1022.0
Population outlook (Missoula County) Hauer SSP2
- Today (2025)
- 127,248 people
- By 2030
- 133,571 · +5.0%
- By 2040
- 144,833 · +13.8%
- By 2050
- 156,753 · +23.2%
- By 2075
- 189,373 · +48.8%
- By 2100
- 217,637 · +71.0%
Race, ethnicity, and origin ACS 2023
- Neighborhood character
- Predominantly White (87%)
- Race & ethnicity
- White 87% Two or more races 5% Hispanic / Latino 3% Asian 3% Native American 2%
- Common ancestry
- Portuguese 6% Lithuanian 3% Italian 3%
- Foreign-born
- 3% · Canada
- Languages at home
- 94% English-only · Other Asian/Pacific 2% Spanish 2% Russian/Polish/Slavic 1%
Political lean MEDSL · Missoula
- 2024 margin
- Strong D (+21.4) · D 59.0% · R 37.5% · Other 3.5%
- 2008→2024 swing
- -5.3pp toward R · 2008: 26.7pp · 2024: 21.4pp
- All cycles
- 2024: D+21.4 2020: D+23.6 2016: D+15.8 2012: D+18.7 2008: D+26.7
Not yet ingested
- Civics
- —
Market trends
- HPI YoY
- ▼ -165.87%
- Current HPI
- 269.9288
- Rent YoY
- ▲ 2.35%
- Metro
- Missoula, MT
- State GDP YoY
- ▲ 3.41%
- F500 in state
- 2
Industry mix (Fortune 500 HQ in MT)
| Industry | F500 HQs | Revenue |
|---|---|---|
| Technology / Analytics | 1 | $2B |
|
||
Price history
-13.6% since first listed5 events — show timeline
- 2026-05-14 Price Changed $121,000 MRMLS
- 2026-04-07 Price Changed $124,500 MRMLS
- 2026-03-08 Price Changed $129,500 MRMLS
- 2026-01-02 Price Changed $135,000 MRMLS
- 2025-11-21 Listed $140,000 MRMLS
Cash-flow waterfall
monthlySold comps — $/sqft
last 12 mo · ≤1 miLoading sold comps…