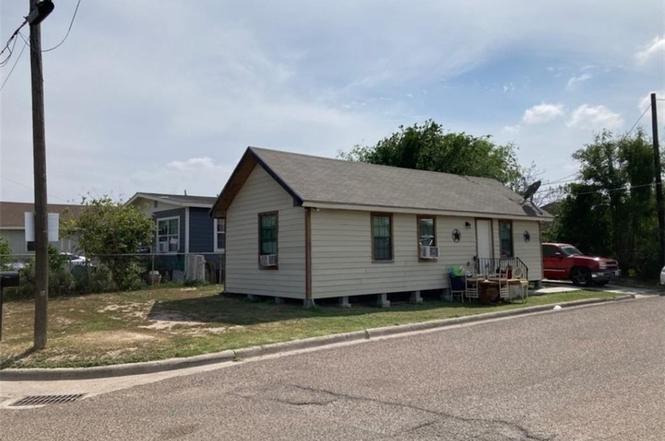
100 S Cedro · Weslaco, TX
Flood risk 3/10 · Minor
- FEMA flood zone
- X
- Chance of flooding over 30 yrs
- 0.2%
- Est. flood insurance / yr
- $507 – $1,088
Fire risk 1/10 · Minimal
- Est. fire insurance / yr
- $1,222 – $2,270
Heat risk 9/10 · Severe
- Hot days now (above 111°F)
- 7 days/yr
- Hot days in 30 yrs
- 24 days/yr
Wind risk 8/10 · Major
- Chance of severe wind over 30 yrs
- 99.0%
Air-quality risk 1/10 · Minimal
- Unhealthy air days now
- 0 days/yr
- Unhealthy air days in 30 yrs
- 0 days/yr
Risk factors via First Street. Map © Google.
Why this score? — see what drove the D- grade
The composite is a weighted blend of 9 inputs, each scored 0–100. Each bar is that input's sub-score; the figure is the points it added to the 100-point composite (weight × sub-score).
- Cash flow +9.3/30.0
- ARV discount +7.5/15.0
- Appreciation +4.7/10.0
- 1% rule +4.1/10.0
- Livability +3.6/5.0
- DSCR +2.6/10.0
- Rent growth +2.5/5.0
- Condition / age +2.5/5.0
- Schools +2.2/10.0
$79,500
🖨 Deal sheet (PDF) 📄 Offer letter ✓ Due diligence
Listing remarks
Cozy home conveniently in the center of Weslaco, Texas. This home is a 2 bedrrom, 1 bath sitting on . 05 of an acre corner lot. walking distance from local shops, restaruants, grocery stores, and vocational college.
Key facts
- Minutes away
- Center of weslaco
- Corner lot
Tags
Neighborhood map
What this means for you Summary
Snapshot
- This is a 2-bed/1.0-bath single-family listed at $80k.
Deal economics
- At list price, monthly cash flow is $-58 ($-696/yr) — negative.
- To cash-flow at today's rent, offer at most $69k (12.9% below list).
- To meet the 1% rule (rent ≥ 1% of price), the offer needs to be $73k (8.5% below list).
- Recommended offer: $69k (12.9% below list) — sets the bar for cash-flow.
- Cap rate 5.4% vs local median 4.1% in Weslaco — top-decile yield for the area; either an underpriced asset or a hidden risk that comps aren't pricing in. Stress-test before assuming the spread holds.
Location & tenants
- Location reads 72/100 on livability (#277 in TX) — a middle-class / working-renter tenant base. Strengths: cost of living A+, housing A+, health & safety A+; Watch: employment D+, crime F, amenities F.
- Weslaco ISD (suburban): math 23% / reading 31% proficiency, ranked #705 of 826 in TX (top 85%) — low school quality limits family demand, transient renter base, plan for 1-2y turnover.
- Zoned schools: Sam Houston El (math 22% / reading 37%, grade F, #2,525 of 4,322 statewide, top 62%, 745 students, 87% FRL); Central Middle (math 33% / reading 40%, grade F, #786 of 1,662 statewide, top 48%, 974 students, 70% FRL); Weslaco H S (math 25% / reading 33%, grade F, #1,147 of 1,632 statewide, top 71%, 2,553 students, 73% FRL) — zoned schools average 77% FRL vs 59% district-wide (17 pts higher); higher-poverty schools than district average — tighter screening recommended.
- Market conditions: 712 active listings in the ZIP; 11 comparable units currently listed for rent nearby; rentals lingering (median 46d on market — plan ~5-8 weeks vacancy on turnover, expect pricing pressure); 100% of comp listings sitting > 30 days — soft ceiling on asking rent; 7,378 units permitted in Hidalgo County in 2024 (641 in 5+ unit buildings).
Forward outlook
- In year one you build about $86 of equity ($550 loan paydown + $-464 appreciation (-0.6% local appreciation)).
- Hidalgo County population projected at +28% by 2050 — long-run rental-demand tailwind backs the buy-and-hold thesis.
Negotiation context
- It's been on market 128 days — a 12% lower offer ($70k) is reasonable based on typical stale-listing flexibility.
Risks & watch-outs
- Watch-outs: property tax is 2.8% of price.
- Climate carrying-cost: severe wind risk, 99% chance of damaging wind over 30y; extreme-heat days projected 7→24/yr by 2055 (HVAC capex compounding) — expect insurance premiums to compound above CPI over the hold.
Questions for the listing agent
- What do current leases actually rent for vs. the listed asking? Can we see a recent rent roll and the last 12 months of T-12 income?
- It's been on market 128 days. Have you received any prior offers? Is the seller open to a 13% concession, seller financing, or rate buy-down credit?
- Property tax is high relative to price — has the assessment been appealed recently, and will the sale trigger a re-assessment?
- Why hasn't it sold? Are there any deal-killer items the seller is aware of (foundation, flood, title, zoning, code violations)?
- Is there a deadline driving the sale (1031 exchange, divorce, estate, relocation)? That informs how much negotiation room exists.
- Crime grade is F in this area — have there been break-ins, vandalism, or insurance claims at this property in the last 3 years? What carrier currently insures it and at what premium?
- The area grade is low — what's the realistic commute time and amenity access for the typical tenant pool here? Any planned neighborhood developments (good or bad) we should know about?
- What's the average days-on-market for RENTAL listings here right now (not sales)? A rising rental-DOM trend means longer vacancies and softer asking-rent achievability than the comps imply.
- What's the recent tenant-quality profile in this submarket — average credit score on applications, eviction rate, late-payment / NSF rate, and stable-employment percentage? A property-management company in the area should have these aggregated.
- How much new for-sale + rental construction is in the pipeline within 1–3 miles? Heavy new supply typically softens prices + rents 12–24 months out; constrained supply supports both.
Investment metrics
- 1% rule
- 0.91% ✗
- Cap rate
- 5.42%
- Cash-on-cash
- -3.13%
- DSCR
- 0.86
- GRM
- 9.1
CMA / ARV
- ARV (on-the-fly)
- $47,970
- Comps found
- 2
Show comp detail 2 sales within ~0.75 mi
| Address | Dist | Beds/Ba | Sqft | Sold | Price | $/sf | Match |
|---|---|---|---|---|---|---|---|
| 112 N Pino St | 0.06mi | 1/1.0 (-1) | 550 (-6%) | 18mo | $45,000 | $82 | 68 |
| 404 E Esplanada St | 0.54mi | 2/1.0 | 640 (+9%) | 21mo | $45,000 | $70 | 41 |
Match score weights: distance 35% · size 25% · config 20% · recency 20%. Top-matched comps best support the ARV.
Projected returns pro-forma
-0.58% appreciation · 3.0% rent growth · sell at horizon
- IRR
- -8.1%
- Equity multiple
- 0.64×
- Total profit
- $-8,116
- Equity at exit
- $20,789
- IRR
- -1.6%
- Equity multiple
- 0.84×
- Total profit
- $-3,518
- Equity at exit
- $23,224
Cash invested: $22,260 (down + closing). Projections, not guarantees.
Landlord ↔ Tenant lean methodology
- Overall (STATE)
- 87 Strongly Landlord-Friendly
- State Texas
- 87 Strongly Landlord-Friendly · R+5
- County
- — inherits STATE
- City
- — inherits STATE
ZIP-level market 78596
- Home prices YoY
- -0.2%
- Active inventory
- 712
- Price-to-rent
- 9.1×
Monthly cashflow live
- Estimated rent
- $727 high interval (Pro) →
- Mortgage (P&I)
- −$417
- Tax from tax record
- −$182 /mo · $2,189/yr
- Insurance
- −$33
- HOA
- −$0
- Vacancy / Maint / Mgmt
- −$153
- Net cashflow
- $-58
Break-even live
Sensitivity live
| Price | -10% $-13 | -5% $-36 | +0% $-58 | +5% $-81 | +10% $-103 |
|---|---|---|---|---|---|
| Rent | -10% $-115 | -5% $-87 | +0% $-58 | +5% $-29 | +10% $-1 |
| Rate | -1.0pp $-18 | -0.5pp $-38 | base $-58 | +0.5pp $-79 | +1.0pp $-100 |
UW: 25.0% down · 7.5% · 30yr · 1.5% tax · 5.0% vac · 8.0% maint · 8.0% mgmt
Financing live
Cash to close
- Down payment
- $19,875
- Closing costs
- $2,385
- Reserves months
- —
- Total cash needed
- —
Loan-product check · same deal, 3 products live
Conventional
25% down · 7.5% · 30yr
- Down + closing
- —
- Monthly P&I
- —
- Monthly cashflow
- —
- DSCR
- —
- Eligible?
- —
Personal DTI + credit; lowest rate.
DSCR
20% down · 8.5% · 30yr
- Down + closing
- —
- Monthly P&I
- —
- Monthly cashflow
- —
- DSCR
- —
- Eligible?
- —
No personal income docs; deal must DSCR.
Hard money
10% down · 12.0% · 12mo
- Down + closing
- —
- Monthly P&I
- —
- Monthly cashflow
- —
- DSCR
- —
- Eligible?
- —
Short-term bridge; refi at stabilization.
Rent comps 11 comps
| Address | Beds | Baths | Sqft | Rent | $/sqft | DOM | Units | Dist |
|---|---|---|---|---|---|---|---|---|
| 301 E 4th St Unit 5 Weslaco, TX | 1.0 | 1.0 | 700 | $670 | $0.96 | 45d | 1 | 0.38mi |
| 518 N Cantu St Weslaco, TX | 2.0 | 1.0 | 648 | $900 | $1.39 | 46d | 1 | 0.58mi |
| 1409 W Business 83 Unit 00 722 Weslaco, TX | 1.0 | 1.0 | 550 | $855 | $1.55 | 45d | 1 | 0.64mi |
| 705 E 6th St Unit 21 Weslaco, TX | 1.0 | 1.0 | 700 | $595 | $0.85 | 45d | 1 | 0.69mi |
| 705 E 6th St Apt 4 Weslaco, TX | 1.0 | 1.0 | 700 | $695 | $0.99 | 45d | 1 | 0.69mi |
| 222 S Westgate Dr Apt 6 Weslaco, TX | 1.0 | 1.0 | 700 | $680 | $0.97 | 45d | 1 | 0.90mi |
| 222 S Westgate Dr Weslaco, TX | 1.0 | 1.0 | 650 | $670 | $1.03 | 45d | 1 | 0.90mi |
| 222 S Westgate Dr Weslaco, TX | 1.0 | 1.0 | 700 | $680 | $0.97 | 46d | 1 | 0.90mi |
| 610 S Hospital Dr Unit A9 Weslaco, TX | 1.0 | 1.0 | 600 | $795 | $1.32 | 45d | 1 | 1.03mi |
| 1006 Lilia Dr Weslaco, TX | 1.0 | 1.0 | 720 | $650 | $0.90 | 45d | 1 | 1.18mi |
| 1601 S Airport Dr Unit 231 Weslaco, TX | 1.0 | 1.0 | 385 | $1,200 | $3.12 | 45d | 1 | 1.33mi |
Listing history 9 events
-
2025-04-22soldstatus
-
2024-10-07soldstatus
-
2024-08-28status Pending
-
2024-07-31price $79,500
-
2024-06-18price $83,500
-
2024-05-22price $89,500
-
2024-04-22$92,000 Active
-
2018-07-11soldstatus
-
2018-07-11soldstatus
ⓘ Source: listings_history table (triggers on properties + properties_extension) + one-shot
backfill from property_details.listing_events for pre-trigger history.
Tax reassessment forecast TX · Resets to sale price
- Current annual tax
- $2,189 · $182/mo
- Projected year-2 tax
- $2,189 · $182/mo
- Expected delta
- $0/yr ($0/mo · 0.0%)
ⓘ Screening estimate from a state-policy table — verify with the county assessor before closing.
Climate risk First Street
- Flood 3/10 Moderate FEMA zone X · 20% chance over 30 yrs
- Wildfire 1/10 Low
- Heat 9/10 Extreme 7 d/yr ≥111°F today · 24 d/yr by 30 yrs out
- Wind 8/10 Severe 99% chance of damaging wind over 30 yrs
- Air quality 1/10 Low 0 unhealthy d/yr today · 0 by 30 yrs out
Nearby sold comps map
Loading sold comps map…
Walkable amenities ~0.75 mi
Loading nearby amenities…
Taxation est. · year 1
- Rental income
- $8,725
- − Mortgage interest
- −$4,453
- − Property taxes
- −$2,189
- − Insurance
- −$398
- − Repairs & maintenance
- −$698
- − Management
- −$698
- − Depreciation
- −$2,313
- Taxable loss
- −$2,023
- Est. tax savings @ 24.0%
- +$486
- After-tax cash flow
- $-211/yr
For passive investors: Depreciation is non-cash, so a rental often shows a tax loss while cash-flowing — sheltering income. Rental losses are passive: they offset passive income freely, and up to $25,000/yr can offset ordinary (W-2) income if you actively participate and your MAGI is under $100k (phasing out to $0 by $150k); unused losses carry forward. On sale, claimed depreciation is recaptured at up to 25%, and gains may owe capital-gains tax (a 1031 exchange can defer both). Figures are a year-1 estimate at your 24.0% rate — not tax advice; consult a CPA.
Schools (NCES district)
- District
- Weslaco ISD
- NCES district ID
- 4844960
- Math proficiency
- 23% ▼ -29.00%
- Reading proficiency
- 31% ▼ -9.00%
- Median HH income
- $32,867
- Composite
- 22.05/100
- National rank
- #8196
- State rank
- #705 of 826 in TX
Livability — Weslaco
- Score
- 72/100
- State rank
- #277
- US rank
- #6469
Category grades
Schools grade is shown separately in the Schools card above.
Census & demographics
- Census place
- Weslaco, TX
- Population (ZIP)
- 38,942
Population outlook (Hidalgo County) Hauer SSP2
- Today (2025)
- 955,232 people
- By 2030
- 1,009,774 · +5.7%
- By 2040
- 1,120,332 · +17.3%
- By 2050
- 1,225,036 · +28.2%
- By 2075
- 1,439,189 · +50.7%
- By 2100
- 1,533,429 · +60.5%
Race, ethnicity, and origin ACS 2023
- Neighborhood character
- Predominantly Hispanic (86%)
- Race & ethnicity
- Hispanic / Latino 86% Two or more races 38% White 13%
- Hispanic origin (detail)
- Mexican 82%
- Common ancestry
- Slovak 1%
- Foreign-born
- 17% · Canada
- Languages at home
- 27% English-only · Spanish 72%
Political lean MEDSL · Hidalgo
- 2024 margin
- Toss-up / Even · D 48.1% · R 51.0%
- 2008→2024 swing
- -41.6pp toward R · 2008: 38.7pp · 2024: -2.9pp
- All cycles
- 2024: R+2.9 2020: D+17.1 2016: D+40.5 2012: D+41.8 2008: D+38.7
Not yet ingested
- Civics
- —
Market trends
- HPI YoY
- ▼ -0.58%
- Current HPI
- 261.5117
- Rent YoY
- —
- Metro
- —
- State GDP YoY
- ▲ 3.95%
- F500 in state
- 110
Industry mix (Fortune 500 HQ in TX)
| Industry | F500 HQs | Revenue |
|---|---|---|
| Energy | 16 | $1,198B |
|
||
| Technology | 5 | $198B |
|
||
| Engineering / Construction | 4 | $72B |
|
||
| Energy Services | 3 | $60B |
|
||
| Utilities | 3 | $41B |
|
||
| Healthcare | 2 | $330B |
|
||
Price history
-13.6% since first listed9 events — show timeline
- 2025-04-22 Sold (Public Records) — Public Records
- 2024-10-07 Sold (Public Records) — Public Records
- 2024-08-28 Pending — MCALLENMLS
- 2024-07-31 Price Changed $79,500 MCALLENMLS
- 2024-06-18 Price Changed $83,500 MCALLENMLS
- 2024-05-22 Price Changed $89,500 MCALLENMLS
- 2024-04-22 Listed $92,000 MCALLENMLS
- 2018-07-11 Sold (Public Records) — Public Records
- 2018-07-11 Sold (Public Records) — Public Records
Property tax history
+11.8%/yrLatest (2025): $2,189 · +63.5% YoY. Source: county tax records.
Cash-flow waterfall
monthlySold comps — $/sqft
last 12 mo · ≤1 miLoading sold comps…