10457 Materita Dr · Fort Myers, FL
Flood risk 1/10 · Minimal
- FEMA flood zone
- X (unshaded)
- Chance of flooding over 30 yrs
- 0.0%
- Est. flood insurance / yr
- $507 – $1,088
Fire risk 4/10 · Minor
- Est. fire insurance / yr
- $947 – $1,759
Heat risk 10/10 · Severe
- Hot days now (above 107°F)
- 7 days/yr
- Hot days in 30 yrs
- 31 days/yr
Wind risk 10/10 · Severe
- Chance of severe wind over 30 yrs
- 99.0%
Air-quality risk 2/10 · Minimal
- Unhealthy air days now
- 1 days/yr
- Unhealthy air days in 30 yrs
- 1 days/yr
Risk factors via First Street. Map © Google.
Why this score? — see what drove the C grade
The composite is a weighted blend of 9 inputs, each scored 0–100. Each bar is that input's sub-score; the figure is the points it added to the 100-point composite (weight × sub-score).
- Cash flow +23.0/30.0
- 1% rule +8.5/10.0
- ARV discount +7.5/15.0
- DSCR +7.4/10.0
- Livability +4.3/5.0
- Schools +4.1/10.0
- Rent growth +2.6/5.0
- Condition / age +2.5/5.0
- Appreciation +0.0/10.0
$349,500
🖨 Deal sheet (PDF) 📄 Offer letter ✓ Due diligence
Listing remarks
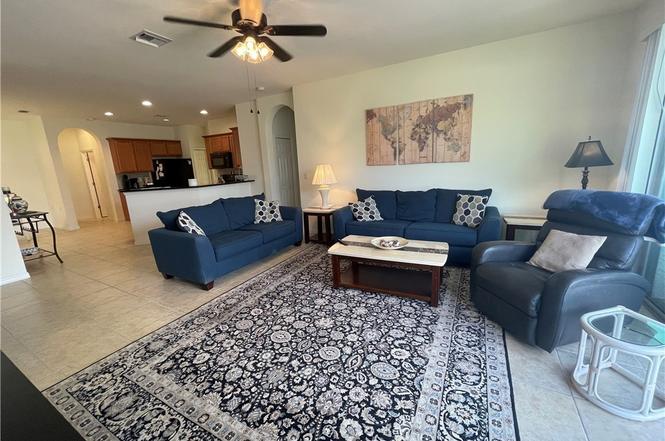
The lowest community HOA in Pelican Preserve. Resort life at its finest. Come see this light and bright, Turnkey villa in Pelican Preserve a fabulous 55+ community. This meticulously maintained residence offers 2 bedrooms, 2 baths with a 2 car garage, corner Villa beautifully landscaped with corner view of lake from your extended screened-in Lanai. Furnished with comfort in mind. Features include: 18" tile, inviting eat-in kitchen and counter, wood cabinets, granite countertops, open floor plan Master Bedroom with Queen bed, walk-in closets, master bathroom with his/her sinks Guest with Queen bed. Enjoy the tranquil sounds while entertaining or watching the sunrise on the furnished pav
Key facts
- Open floor plan
- Resort-style pool
- Granite countertops
Tags
Property features AI
Finance
- Financial info: Pets allowed with conditions (limit 2)
- HOA & community: Homeowners association (quarterly fees); Association fee includes management, cable TV, internet, irrigation water, legal/accounting, grounds maintenance, pest control, recreation facilities, reserve fund, road maintenance, street lights, security, trash; Association amenities: beach rights, basketball court, bocce court, billiard room, bike storage, business center, clubhouse, dog park, fitness center, golf course, hobby room, library, media room, pier, pickleball, private membership, pool, putting greens, RV/boat storage; Condo-hotel community with golf and tennis courts; Senior community
Exterior
- Parking: Attached 2-car garage; Covered parking; Deeded parking; Driveway; Paved parking; Electric vehicle charging station(s); Garage door opener
- Security: Security gate; Gated community with guard; Security guard; Fire sprinkler system; Smoke detectors
- Utilities: Cable available; High-speed internet available; Underground utilities; Public water (assessment paid); Public sewer (assessment paid)
- Home design: Single-story; Entry level: 1; Resale property; Attached property
- Construction: Block, concrete and stucco construction; Tile roof
- Exterior features: Sprinkler/irrigation system (automatic); Room for pool; Manual shutters; Water feature; Privacy wall; Lanai; Porch (screened); Guest house attached; Community pool; Lakefront; East exposure; Has view; West-facing
Interior
- Kitchen: Cooktop; Electric cooktop; Range; Self-cleaning oven; Microwave; Dishwasher; Disposal; Icemaker; Refrigerator; Freezer; Refrigerator with ice maker
- Bedrooms: Bedroom on main level
- Flooring: Carpet; Tile
- Bathrooms: 2 full bathrooms
- Heating & cooling: Central heating (electric); Central air; Ceiling fans
- Interior features: Furnished; Breakfast bar; Separate/formal dining room; Living/dining room; Pantry; Shower only (separate shower); Cable TV; Walk-in closets; Window treatments; Central vacuum; High-speed internet; Split bedrooms; Single-hung windows; Shutters
- Laundry & utility: Washer; Dryer; Inside laundry; Laundry tub
Neighborhood map
What this means for you Summary
Snapshot
- This is a 2-bed/2.0-bath condo listed at $350k.
Deal economics
- At list price, monthly cash flow is $619 ($7k/yr) — positive.
- The deal already cash-flows at list — no discount required.
- Meets the 1% rule at list price ($5k rent vs $350k).
- Recommended offer: $318k (9.0% below list) — sets the bar for market timing.
- Cap rate 8.4% vs local median 3.0% in Fort Myers — top-decile yield for the area; either an underpriced asset or a hidden risk that comps aren't pricing in. Stress-test before assuming the spread holds.
Location & tenants
- Location reads 86/100 on livability (#14 in FL, #383 nationally) — a professional / high-income tenant draw. Strengths: amenities A+, commute A+, housing A+.
- Lee (suburban): math 47% / reading 50% proficiency, ranked #42 of 73 in FL (top 58%) — families likely to look elsewhere, expect single-tenant / working-renter base with shorter leases.
- Market conditions: Rents flat; 811 active listings in the ZIP; 40 comparable units currently listed for rent nearby; rentals at typical pace (median 24d on market — plan ~3-4 weeks tenant-placement turnaround); high-income renter base; 15,411 units permitted in Lee County in 2024 (4,686 in 5+ unit buildings).
- At $4,713/mo this rent would consume 51% of the median local household income ($110k/yr) (locally 276% of renters already pay >50% of income on rent) — very limited rent-growth headroom before tenants either downsize or default.
Forward outlook
- Local home prices are declining (-3.0%/yr); year-one equity from $2k of loan paydown is wiped out by about $10k of value loss. Plan a longer hold.
- Lee County population projected at +44% by 2050 — long-run rental-demand tailwind backs the buy-and-hold thesis.
Negotiation context
- It's been on market 103 days — a 9% lower offer ($318k) is reasonable based on typical stale-listing flexibility.
- 12 sale attempts since 11y ago; this cycle's ask is 14462% above the opening price — seller raised mid-cycle; expect resistance to lowballs.
- Current owner paid $215k; list at $350k implies a 63% gain — meaningful room to come down on a strong offer.
Risks & watch-outs
- Climate carrying-cost: severe wind risk, 99% chance of damaging wind over 30y; extreme-heat days projected 7→31/yr by 2055 (HVAC capex compounding) — expect insurance premiums to compound above CPI over the hold.
Questions for the listing agent
- It's been on market 103 days. Have you received any prior offers? Is the seller open to a 9% concession, seller financing, or rate buy-down credit?
- What does the HOA fee cover, when was the last increase, and are there any pending special assessments or reserve-fund shortfalls?
- Any open or pending special assessments — roof, HVAC, plumbing, elevator, façade? What's the per-unit balance and payoff schedule, and is the seller paying it off at close or rolling it to the buyer?
- Why hasn't it sold? Are there any deal-killer items the seller is aware of (foundation, flood, title, zoning, code violations)?
- Is there a deadline driving the sale (1031 exchange, divorce, estate, relocation)? That informs how much negotiation room exists.
- What's the average days-on-market for RENTAL listings here right now (not sales)? A rising rental-DOM trend means longer vacancies and softer asking-rent achievability than the comps imply.
- What's the recent tenant-quality profile in this submarket — average credit score on applications, eviction rate, late-payment / NSF rate, and stable-employment percentage? A property-management company in the area should have these aggregated.
- How much new apartment / multifamily construction is in the pipeline within 1–3 miles? Heavy new supply (>2% of stock underway) typically softens rents 12–24 months out; light construction supports rent growth.
Investment metrics
- 1% rule
- 1.35% ✓
- Cap rate
- 8.42%
- Cash-on-cash
- 7.59%
- DSCR
- 1.34
- GRM
- 6.2
CMA / ARV
No comps found within radius.
Projected returns pro-forma
-3.0% appreciation · 0.37% rent growth · sell at horizon
- IRR
- -8.3%
- Equity multiple
- 0.71×
- Total profit
- $-28,854
- Equity at exit
- $52,112
- IRR
- -3.5%
- Equity multiple
- 0.80×
- Total profit
- $-19,646
- Equity at exit
- $30,218
Cash invested: $97,860 (down + closing). Projections, not guarantees.
Landlord ↔ Tenant lean methodology
- Overall (STATE)
- 87 Strongly Landlord-Friendly
- State Florida
- 87 Strongly Landlord-Friendly · R+3
- County
- — inherits STATE
- City
- — inherits STATE
ZIP-level market 33913
- Home prices YoY
- -10.3%
- Rents YoY
- 0.4%
- Active inventory
- 811
- Price-to-rent
- 6.2×
Monthly cashflow live
- Estimated rent
- $4,713 high interval (Pro) →
- Mortgage (P&I)
- −$1,833
- Tax from tax record
- −$520 /mo · $6,238/yr
- Insurance
- −$146
- HOA
- −$606
- Vacancy / Maint / Mgmt
- −$990
- Net cashflow
- $619
Break-even live
Sensitivity live
| Price | -10% $817 | -5% $718 | +0% $619 | +5% $520 | +10% $421 |
|---|---|---|---|---|---|
| Rent | -10% $247 | -5% $433 | +0% $619 | +5% $805 | +10% $992 |
| Rate | -1.0pp $795 | -0.5pp $708 | base $619 | +0.5pp $529 | +1.0pp $437 |
UW: 25.0% down · 7.5% · 30yr · 1.5% tax · 5.0% vac · 8.0% maint · 8.0% mgmt
Financing live
Cash to close
- Down payment
- $87,375
- Closing costs
- $10,485
- Reserves months
- —
- Total cash needed
- —
Loan-product check · same deal, 3 products live
Conventional
25% down · 7.5% · 30yr
- Down + closing
- —
- Monthly P&I
- —
- Monthly cashflow
- —
- DSCR
- —
- Eligible?
- —
Personal DTI + credit; lowest rate.
DSCR
20% down · 8.5% · 30yr
- Down + closing
- —
- Monthly P&I
- —
- Monthly cashflow
- —
- DSCR
- —
- Eligible?
- —
No personal income docs; deal must DSCR.
Hard money
10% down · 12.0% · 12mo
- Down + closing
- —
- Monthly P&I
- —
- Monthly cashflow
- —
- DSCR
- —
- Eligible?
- —
Short-term bridge; refi at stabilization.
Rent comps 40 comps
| Address | Beds | Baths | Sqft | Rent | $/sqft | DOM | Units | Dist |
|---|---|---|---|---|---|---|---|---|
| 10700 Cetrella Dr Fort Myers, FL | 2.0 | 2.0 | 1227 | $3,500 | $2.85 | 24d | 1 | 0.02mi |
| 10702 Cetrella Dr Fort Myers, FL | 2.0 | 2.0 | 1347 | $5,500 | $4.08 | 24d | 1 | 0.03mi |
| 10714 Cetrella Dr Fort Myers, FL | 2.0 | 2.0 | 1227 | $5,500 | $4.48 | 24d | 1 | 0.07mi |
| 10428 Materita Dr Fort Myers, FL | 2.0 | 2.0 | 1568 | $6,250 | $3.99 | 24d | 1 | 0.12mi |
| 10730 Cetrella Dr Fort Myers, FL | 3.0 | 2.0 | 1558 | $6,900 | $4.43 | 24d | 1 | 0.13mi |
| 10518 Avila Cir Fort Myers, FL | 2.0 | 2.0 | 1466 | $6,500 | $4.43 | 3d | 1 | 0.38mi |
| 10518 Avila Cir Fort Myers, FL | 2.0 | 2.0 | 1466 | $6,500 | $4.43 | 24d | 1 | 0.38mi |
| 10520 Casella Way #101 Fort Myers, FL | 3.0 | 2.0 | 1722 | $7,000 | $4.07 | 24d | 1 | 0.53mi |
| 10529 Casella Way #102 Fort Myers, FL | 3.0 | 2.0 | 1722 | $4,500 | $2.61 | 24d | 1 | 0.59mi |
| 10514 Bella Vista Dr Fort Myers, FL | 3.0 | 2.0 | 1823 | $6,500 | $3.57 | 24d | 1 | 0.61mi |
| 10720 Ravenna Way #104 Fort Myers, FL | 2.0 | 2.0 | 1251 | $5,000 | $4.00 | 24d | 1 | 0.62mi |
| 10700 Palazzo Way #201 Fort Myers, FL | 2.0 | 2.0 | 1390 | $5,000 | $3.60 | 22d | 1 | 0.63mi |
| 10711 Palazzo Way Unit 203 Fort Myers, FL | 2.0 | 2.0 | 1257 | $5,300 | $4.22 | 22d | 1 | 0.69mi |
| 10711 Palazzo Way Fort Myers, FL | 2.0 | 2.0 | 1257 | $3,900 | $3.10 | 16d | 2 | 0.69mi |
| 10700 Ravenna Way Fort Myers, FL | 2.0 | 2.0 | 1251 | $3,488 | $2.79 | 24d | 2 | 0.69mi |
| 10751 Palazzo Way #103 Fort Myers, FL | 2.0 | 2.0 | 1235 | $5,000 | $4.05 | 24d | 1 | 0.71mi |
| 10602 Camarelle Cir Fort Myers, FL | 2.0 | 2.0 | 1690 | $5,500 | $3.25 | 24d | 1 | 0.71mi |
| 10820 Palazzo Way #203 Fort Myers, FL | 2.0 | 2.0 | 1235 | $5,400 | $4.37 | 24d | 1 | 0.72mi |
| 10791 Palazzo Way #301 Fort Myers, FL | 2.0 | 2.0 | 1390 | $5,300 | $3.81 | 24d | 1 | 0.74mi |
| 11900 Grosseto Ct Fort Myers, FL | 2.0 | 2.0 | 1713 | $6,000 | $3.50 | 19d | 1 | 0.83mi |
| 11900 Grosseto Ct Fort Myers, FL | 2.0 | 2.0 | 1713 | $5,500 | $3.21 | 24d | 1 | 0.83mi |
| 11041 Iron Horse Way Fort Myers, FL | 2.0 | 2.0 | 1692 | $4,000 | $2.36 | 24d | 1 | 0.85mi |
| 11343 Tiverton Trce Fort Myers, FL | 2.0 | 2.0 | 1685 | $4,000 | $2.37 | 3d | 1 | 0.85mi |
| 9918 Horse Creek Rd Fort Myers, FL | 3.0 | 2.0 | 1510 | $2,200 | $1.46 | 24d | 1 | 0.86mi |
| 10530 Amiata Way #103 Fort Myers, FL | 2.0 | 2.0 | 1248 | $2,200 | $1.76 | 24d | 1 | 0.87mi |
| 10510 Amiata Way #302 Fort Myers, FL | 2.0 | 2.0 | 1245 | $4,900 | $3.94 | 24d | 1 | 0.93mi |
| 10111 Colonial Country Club Blvd #2308 Fort Myers, FL | 2.0 | 2.0 | 1309 | $2,000 | $1.53 | 12d | 1 | 1.00mi |
| 11230 Suffield St Fort Myers, FL | 2.0 | 2.0 | 1560 | $8,500 | $5.45 | 24d | 1 | 1.01mi |
| 10020 Horse Creek Rd Fort Myers, FL | 2.0 | 2.0 | 1692 | $2,500 | $1.48 | 24d | 1 | 1.03mi |
| 11033 Mill Creek Way #202 Fort Myers, FL | 2.0 | 2.0 | 1379 | $5,400 | $3.92 | 24d | 1 | 1.04mi |
| 10112 Colonial Country Club Blvd #209 Fort Myers, FL | 2.0 | 2.0 | 1530 | $5,000 | $3.27 | 24d | 1 | 1.07mi |
| 11029 Mill Creek Way #405 Fort Myers, FL | 2.0 | 2.0 | 1749 | $2,500 | $1.43 | 24d | 1 | 1.10mi |
| 9232 Aviano Dr Unit Amazing Aviano Fort Myers, FL | 3.0 | 2.0 | 1772 | $5,500 | $3.10 | 24d | 1 | 1.12mi |
| 10121 Colonial Country Club Blvd #1802 Fort Myers, FL | 2.0 | 2.0 | 1530 | $4,800 | $3.14 | 3d | 1 | 1.14mi |
| 9217 Aviano Dr Fort Myers, FL | 2.0 | 2.0 | 1227 | $2,500 | $2.04 | 11d | 1 | 1.15mi |
| 9209 Aviano Dr Fort Myers, FL | 2.0 | 2.0 | 1355 | $5,600 | $4.13 | 15d | 1 | 1.17mi |
| 9209 Aviano Dr Fort Myers, FL | 2.0 | 2.0 | 1355 | $5,600 | $4.13 | 14d | 1 | 1.17mi |
| 11075 Lancewood St Fort Myers, FL | 3.0 | 2.0 | 1575 | $2,300 | $1.46 | 24d | 1 | 1.17mi |
| 11075 Lancewood St Fort Myers, FL | 3.0 | 2.0 | 1575 | $2,300 | $1.46 | 16d | 1 | 1.17mi |
| 9460 Ivy Brook Run #710 Fort Myers, FL | 3.0 | 2.5 | 1220 | $1,500 | $1.23 | 12d | 1 | 1.18mi |
HOA detail condo
- Monthly dues
- $606 · $7,272/yr
- Assessments
- None detected in remarks — confirm with the listing agent.
Listing history 44 events
-
2026-06-17days on market $349,500 Active 103 DOM
-
2026-06-16days on market $349,500 Active 102 DOM
-
2026-06-15days on market $349,500 Active 101 DOM
-
2026-06-13days on market $349,500 Active 99 DOM
-
2026-06-10days on market $349,500 Active 96 DOM
-
2026-06-09days on market $349,500 Active 95 DOM
-
2026-06-07days on market $349,500 Active 93 DOM
-
2026-06-02days on market $349,500 Active 88 DOM
-
2026-06-01days on market $349,500 Active 87 DOM
-
2026-06-01days on market $349,500 Active 86 DOM
-
2026-05-19price $349,500
-
2026-04-22price $2,300
-
2026-04-22$2,400
-
2026-04-21historical $5,300
-
2026-04-21$5,300
-
2026-04-21historical $5,300
-
2026-04-09price $364,900
-
2026-03-01$390,000 Active
-
2026-02-13$5,300
-
2026-02-13historical $5,300
-
2025-11-12$5,300
-
2025-11-12historical $5,500
-
2025-08-23$5,500
-
2025-06-25historical $2,300
-
2025-03-28price $2,300
-
2025-02-13$5,000
-
2024-11-20historical $2,200
-
2024-07-01price $2,200
-
2024-06-05$2,400
-
2024-06-05historical $2,400
-
2024-05-04$2,400
-
2024-04-27historical $5,500
-
2024-02-21$5,500
-
2023-09-21historical $5,000
-
2023-09-12$5,000
-
2017-12-04soldstatus $215,000
-
2017-07-25price $220,000
-
2017-04-11price $229,500
-
2017-01-13price $235,000
-
2016-10-27price $239,000
-
2016-06-21price $249,000
-
2016-01-21historical
-
2015-12-12$245,000 Active
-
2000-12-11soldstatus $625,400
ⓘ Source: listings_history table (triggers on properties + properties_extension) + one-shot
backfill from property_details.listing_events for pre-trigger history.
Tax reassessment forecast FL · Resets to sale price
- Current annual tax
- $6,238 · $520/mo
- Projected year-2 tax
- $6,238 · $520/mo
- Expected delta
- $0/yr ($0/mo · 0.0%)
ⓘ Screening estimate from a state-policy table — verify with the county assessor before closing.
Climate risk First Street
- Flood 1/10 Low FEMA zone X (unshaded) · 0% chance over 30 yrs
- Wildfire 4/10 Moderate
- Heat 10/10 Extreme 7 d/yr ≥107°F today · 31 d/yr by 30 yrs out
- Wind 10/10 Extreme 99% chance of damaging wind over 30 yrs
- Air quality 2/10 Low 1 unhealthy d/yr today · 1 by 30 yrs out
Nearby sold comps map
Loading sold comps map…
Walkable amenities ~0.75 mi
Loading nearby amenities…
Taxation est. · year 1
- Rental income
- $56,559
- − Mortgage interest
- −$19,577
- − Property taxes
- −$6,238
- − Insurance
- −$1,748
- − Repairs & maintenance
- −$4,525
- − Management
- −$4,525
- − HOA
- −$7,272
- − Depreciation
- −$10,167
- Taxable income
- $2,508
- Est. tax owed @ 24.0%
- −$602
- After-tax cash flow
- $6,829/yr
For passive investors: Depreciation is non-cash, so a rental often shows a tax loss while cash-flowing — sheltering income. Rental losses are passive: they offset passive income freely, and up to $25,000/yr can offset ordinary (W-2) income if you actively participate and your MAGI is under $100k (phasing out to $0 by $150k); unused losses carry forward. On sale, claimed depreciation is recaptured at up to 25%, and gains may owe capital-gains tax (a 1031 exchange can defer both). Figures are a year-1 estimate at your 24.0% rate — not tax advice; consult a CPA.
Schools (NCES district)
- District
- Lee
- NCES district ID
- 1201080
- Math proficiency
- 47% ▼ -11.00%
- Reading proficiency
- 50% ▼ -4.00%
- Median HH income
- $49,518
- Composite
- 41.49/100
- National rank
- #3458
- State rank
- #42 of 73 in FL
Livability — Fort Myers
- Score
- 86/100
- State rank
- #14
- US rank
- #383
Category grades
Schools grade is shown separately in the Schools card above.
Census & demographics
- Census place
- Fort Myers, FL
- County
- Lee County · 788,662 people
- City population
- 278,598
- Metro
- Cape Coral-Fort Myers, FL
- Population (ZIP)
- 31,538
- Household income
- $110,373
- Rent vs Own
- Severe rent burden
- 276.0
Population outlook (Lee County) Hauer SSP2
- Today (2025)
- 871,946 people
- By 2030
- 955,468 · +9.6%
- By 2040
- 1,113,587 · +27.7%
- By 2050
- 1,256,891 · +44.1%
- By 2075
- 1,560,270 · +78.9%
- By 2100
- 1,726,848 · +98.0%
Race, ethnicity, and origin ACS 2023
- Neighborhood character
- Predominantly White (74%)
- Race & ethnicity
- White 74% Hispanic / Latino 13% Two or more races 11% Black 5% Asian 2%
- Hispanic origin (detail)
- Mexican 3% Puerto Rican 3% Cuban 2%
- Common ancestry
- Romanian 5% Lithuanian 3% Slovak 2%
- Foreign-born
- 14% · Canada, Vietnam, China
- Languages at home
- 84% English-only · Spanish 10% Other Indo-European 2% French/Haitian/Cajun 2%
Political lean MEDSL · Lee
- 2024 margin
- Strong R (+28.4) · D 35.5% · R 63.9%
- 2008→2024 swing
- -18.0pp toward R · 2008: -10.4pp · 2024: -28.4pp
- All cycles
- 2024: R+28.4 2020: R+19.2 2016: R+20.4 2012: R+16.6 2008: R+10.4
Not yet ingested
- Civics
- —
Market trends
- HPI YoY
- ▼ -25.45%
- Current HPI
- 221.7115
- Rent YoY
- ▲ 0.37%
- Metro
- Cape Coral-Fort Myers, FL
- State GDP YoY
- ▲ 3.28%
- F500 in state
- 36
Industry mix (Fortune 500 HQ in FL)
| Industry | F500 HQs | Revenue |
|---|---|---|
| Industrial Technology | 2 | $29B |
|
||
| Insurance | 2 | $17B |
|
||
| Retail | 1 | $60B |
|
||
| Technology Distribution | 1 | $58B |
|
||
| Homebuilding | 1 | $35B |
|
||
| Technology Manufacturing | 1 | $35B |
|
||
Price history
-44.1% since first listed34 events — show timeline
- 2026-05-19 Price Changed $349,500 FORTMLS
- 2026-04-22 Price Changed $2,300 FORTMLS
- 2026-04-22 Listed for Rent $2,400 FORTMLS
- 2026-04-21 Rental Removed $5,300 NAPLESMLS
- 2026-04-21 Listed for Rent $5,300 NAPLESMLS
- 2026-04-21 Rental Removed $5,300 FGCMLS
- 2026-04-09 Price Changed $364,900 FORTMLS
- 2026-03-01 Listed $390,000 FORTMLS
- 2026-02-13 Listed for Rent $5,300 FGCMLS
- 2026-02-13 Rental Removed $5,300 NAPLESMLS
- 2025-11-12 Listed for Rent $5,300 NAPLESMLS
- 2025-11-12 Rental Removed $5,500 FORTMLS
- 2025-08-23 Listed for Rent $5,500 FORTMLS
- 2025-06-25 Rental Removed $2,300 FORTMLS
- 2025-03-28 Price Changed $2,300 FORTMLS
- 2025-02-13 Listed for Rent $5,000 FORTMLS
- 2024-11-20 Rental Removed $2,200 NAPLESMLS
- 2024-07-01 Price Changed $2,200 NAPLESMLS
- 2024-06-05 Listed for Rent $2,400 NAPLESMLS
- 2024-06-05 Rental Removed $2,400 FORTMLS
- 2024-05-04 Listed for Rent $2,400 FORTMLS
- 2024-04-27 Rental Removed $5,500 FORTMLS
- 2024-02-21 Listed for Rent $5,500 FORTMLS
- 2023-09-21 Rental Removed $5,000 FORTMLS
- 2023-09-12 Listed for Rent $5,000 FORTMLS
- 2017-12-04 Sold (Public Records) $215,000 Public Records
- 2017-07-25 Price Changed $220,000 BEARMLS
- 2017-04-11 Price Changed $229,500 BEARMLS
- 2017-01-13 Price Changed $235,000 BEARMLS
- 2016-10-27 Price Changed $239,000 BEARMLS
- 2016-06-21 Price Changed $249,000 BEARMLS
- 2016-01-21 Listing Removed — FORTMLS
- 2015-12-12 Listed $245,000 FORTMLS
- 2000-12-11 Sold (Public Records) $625,400 Public Records
Property tax history
+3.6%/yrLatest (2025): $6,238 · +2.1% YoY. Source: county tax records.
Cash-flow waterfall
monthlySold comps — $/sqft
last 12 mo · ≤1 miLoading sold comps…