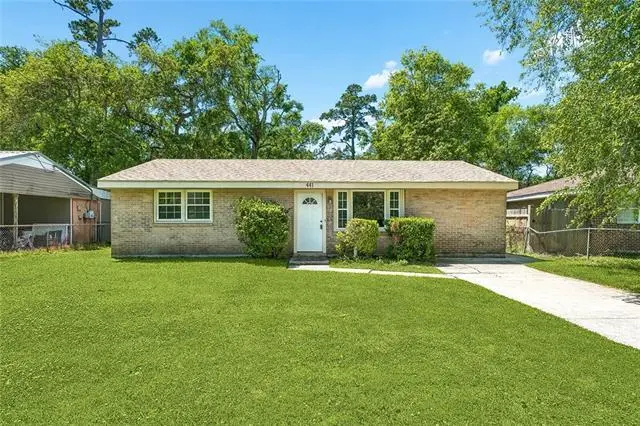
441 Olive Dr · Slidell, LA
Flood risk No data
- FEMA flood zone
- —
- Chance of flooding over 30 yrs
- —
- Est. flood insurance / yr
- —
Fire risk No data
- Est. fire insurance / yr
- —
Heat risk No data
- Hot days now (above threshold)
- —
- Hot days in 30 yrs
- —
Wind risk No data
- Chance of severe wind over 30 yrs
- —
Air-quality risk No data
- Unhealthy air days now
- —
- Unhealthy air days in 30 yrs
- —
Risk factors via First Street. Map © Google.
Why this score? — see what drove the C+ grade
The composite is a weighted blend of 9 inputs, each scored 0–100. Each bar is that input's sub-score; the figure is the points it added to the 100-point composite (weight × sub-score).
- Cash flow +20.1/30.0
- ARV discount +15.0/15.0
- DSCR +6.4/10.0
- 1% rule +5.3/10.0
- Schools +4.3/10.0
- Livability +3.5/5.0
- Rent growth +2.9/5.0
- Condition / age +2.5/5.0
- Appreciation +0.0/10.0
$135,000
🖨 Deal sheet 📄 Offer letter ✓ Due diligence
Listing remarks MLS
Immaculate and move-in ready 2-bedroom, 1-bath all-brick home featuring stylish updates throughout. Interior highlights include luxury vinyl wood plank flooring, warm natural wood tones, and a spacious kitchen with white cabinetry, ceramic countertops, gas range, and a large pantry. The inviting family room is filled with natural light from an oversized window, creating a bright and welcoming space. Major updates include a new roof (2023), main sewer line replacement (2023), and A/C unit (2019). Situated on a huge yard with plenty of room to enjoy, this home also offers the added peace of mind of a renewable termite contract. A beautifully maintained property that is truly ready for its next owner.
Key facts
- Spacious kitchen
- Large pantry
- All-brick home
Tags
Neighborhood map
What this means for you Summary
Snapshot
- This is a 2-bed/1.0-bath single-family listed at $135k.
Deal economics
- At list price, monthly cash flow is $169 ($2k/yr) — positive.
- The deal already cash-flows at list — no discount required.
- Meets the 1% rule at list price ($1k rent vs $135k).
- Recommended offer: $127k (6.0% below list) — sets the bar for market timing.
- Cap rate 7.8% vs local median 5.9% in Slidell — top-decile yield for the area; either an underpriced asset or a hidden risk that comps aren't pricing in. Stress-test before assuming the spread holds.
Location & tenants
- Location reads 70/100 on livability (#57 in LA) — a middle-class / working-renter tenant base. Strengths: cost of living A+, housing A+, health & safety A+; Watch: amenities F, commute F.
- St. Tammany Parish (suburban): math 43% / reading 55% proficiency, ranked #11 of 98 in LA (top 11%) — families likely to look elsewhere, expect single-tenant / working-renter base with shorter leases.
- Market conditions: Rents rising (+1.5%/yr); 489 active listings in the ZIP; 16 comparable units currently listed for rent nearby; rentals at typical pace (median 21d on market — plan ~3-4 weeks tenant-placement turnaround); 1,064 units permitted in St. Tammany Parish in 2024 (0 in 5+ unit buildings).
Forward outlook
- Local home prices are declining (-3.0%/yr); year-one equity from $933 of loan paydown is wiped out by about $4k of value loss. Plan a longer hold.
- St. Tammany County population projected at +27% by 2050 — long-run rental-demand tailwind backs the buy-and-hold thesis.
Negotiation context
- It's been on market 64 days — a 6% lower offer ($127k) is reasonable based on typical stale-listing flexibility.
- 2 sale attempts; this cycle's ask has dropped $10k (7%) from the opening price — seller is motivated, your offer sets the floor, not the list.
Questions for the listing agent
- It's been on market 64 days. Have you received any prior offers? Is the seller open to a 6% concession, seller financing, or rate buy-down credit?
- Built in 1960 — when were the roof, HVAC, electrical panel, plumbing, and water heater last replaced?
- Why hasn't it sold? Are there any deal-killer items the seller is aware of (foundation, flood, title, zoning, code violations)?
- Is there a deadline driving the sale (1031 exchange, divorce, estate, relocation)? That informs how much negotiation room exists.
- Schools are B-rated — typically a magnet for longer-tenancy family renters. What's the average tenant stay here, and is there a school-zone premium baked into asking?
- What's the average days-on-market for RENTAL listings here right now (not sales)? A rising rental-DOM trend means longer vacancies and softer asking-rent achievability than the comps imply.
- What's the recent tenant-quality profile in this submarket — average credit score on applications, eviction rate, late-payment / NSF rate, and stable-employment percentage? A property-management company in the area should have these aggregated.
- How much new for-sale + rental construction is in the pipeline within 1–3 miles? Heavy new supply typically softens prices + rents 12–24 months out; constrained supply supports both.
Investment metrics
- 1% rule
- 1.03% ✓
- Cap rate
- 7.79%
- Cash-on-cash
- 5.35%
- DSCR
- 1.24
- GRM
- 8.1
CMA / ARV
- ARV (median comp)
- $172,247
- List price
- $135,000
- Delta
- -21.62%
- Verdict
- UNDERPRICED
- Comps
- 20 within 1.0 mi
Show comp detail 8 sales within ~0.75 mi
| Address | Dist | Beds/Ba | Sqft | Sold | Price | $/sf | Match |
|---|---|---|---|---|---|---|---|
| 3281 Rama St | 0.54mi | 2/1.0 | 974 (-5%) | 2mo | $163,300 | $168 | 66 |
| 3756 Riviera Dr | 0.49mi | 3/1.5 (+1) | 1,043 (+2%) | 12mo | $106,000 | $102 | 57 |
| 3222 Duncan St | 0.51mi | 3/2.0 (+1) | 1,100 (+8%) | 4mo | $66,200 | $60 | 52 |
| 784 Pinetree St | 0.71mi | 3/1.0 (+1) | 935 (-9%) | 2mo | $145,000 | $155 | 46 |
| 3360 Reine Ave | 0.59mi | 3/1.0 (+1) | 1,090 (+6%) | 12mo | $60,000 | $55 | 46 |
| 3176 Carey St | 0.66mi | 3/1.0 (+1) | 925 (-10%) | 4mo | $137,000 | $148 | 45 |
| 3785 Brookwood Dr | 0.58mi | 3/1.0 (+1) | 1,138 (+11%) | 12mo | $56,000 | $49 | 39 |
| 3224 College St | 0.69mi | 3/1.0 (+1) | 877 (-14%) | 23mo | $89,500 | $102 | 20 |
Match score weights: distance 35% · size 25% · config 20% · recency 20%. Top-matched comps best support the ARV.
Projected returns pro-forma
-3.0% appreciation · 1.47% rent growth · sell at horizon
- IRR
- -9.7%
- Equity multiple
- 0.65×
- Total profit
- $-13,233
- Equity at exit
- $20,129
- IRR
- -2.5%
- Equity multiple
- 0.84×
- Total profit
- $-6,025
- Equity at exit
- $11,672
Cash invested: $37,800 (down + closing). Projections, not guarantees.
Landlord ↔ Tenant lean methodology
- Overall (STATE)
- 90 Strongly Landlord-Friendly
- State Louisiana
- 90 Strongly Landlord-Friendly · R+12
- County
- — inherits STATE
- City
- — inherits STATE
ZIP-level market 70458
- Rents YoY
- 1.5%
- Active inventory
- 489
- Price-to-rent
- 8.1×
Monthly cashflow live
- Estimated rent
- $1,394 high interval (Pro) →
- Mortgage (P&I)
- −$708
- Tax est. 1.5%
- −$169 /mo · $2,025/yr
- Insurance
- −$56
- HOA
- −$0
- Vacancy / Maint / Mgmt
- −$293
- Net cashflow
- $169
Break-even live
UW: 25.0% down · 7.5% · 30yr · 1.5% tax · 5.0% vac · 8.0% maint · 8.0% mgmt
Financing live
Cash to close
- Down payment
- $33,750
- Closing costs
- $4,050
- Reserves months
- —
- Total cash needed
- —
Loan-product check · same deal, 3 products live
Conventional
25% down · 7.5% · 30yr
- Down + closing
- —
- Monthly P&I
- —
- Monthly cashflow
- —
- DSCR
- —
- Eligible?
- —
Personal DTI + credit; lowest rate.
DSCR
20% down · 8.5% · 30yr
- Down + closing
- —
- Monthly P&I
- —
- Monthly cashflow
- —
- DSCR
- —
- Eligible?
- —
No personal income docs; deal must DSCR.
Hard money
10% down · 12.0% · 12mo
- Down + closing
- —
- Monthly P&I
- —
- Monthly cashflow
- —
- DSCR
- —
- Eligible?
- —
Short-term bridge; refi at stabilization.
Rent comps 16 comps
| Address | Beds | Baths | Sqft | Rent | $/sqft | DOM | Units | Dist |
|---|---|---|---|---|---|---|---|---|
| 3304 Bridge Dr Slidell, LA | 3.0 | 2.0 | 1250 | $1,700 | $1.36 | 43d | 1 | 0.27mi |
| 3159 Dee St Slidell, LA | 3.0 | 1.0 | 898 | $1,400 | $1.56 | 43d | 1 | 0.57mi |
| 901 Old Spanish Trl Slidell, LA | 2.0 | 1.5 | 1070 | $1,120 | $1.05 | 11d | 1 | 0.59mi |
| 519 Spartan Dr #9101 Slidell, LA | 2.0 | 2.0 | 1304 | $1,400 | $1.07 | 23d | 1 | 0.60mi |
| 519 Spartan Dr #9205 Slidell, LA | 1.0 | 1.0 | 851 | $1,100 | $1.29 | 43d | 1 | 0.60mi |
| 2864 Slidell Ave Slidell, LA | 3.0 | 1.0 | 963 | $1,395 | $1.45 | 3d | 1 | 0.61mi |
| 509 Spartan Dr #5208 Slidell, LA | 1.0 | 1.0 | 831 | $1,150 | $1.38 | 1d | 1 | 0.63mi |
| 3152 College St Slidell, LA | 3.0 | 1.0 | 1373 | $1,750 | $1.27 | 43d | 1 | 0.74mi |
| 301 Spartan Dr Slidell, LA | 1.0–2.0 | 1.0–2.0 | 880 | $1,502 | $1.71 | 3d | 8 | 0.78mi |
| 2594 Front St Unit 2 Slidell, LA | 1.0 | 1.0 | 1200 | $1,450 | $1.21 | 14d | 1 | 1.22mi |
| 2594 Front St Unit 3 Slidell, LA | 1.0 | 1.0 | 800 | $1,250 | $1.56 | 43d | 1 | 1.22mi |
| 4456 Pontchartrain Dr Unit 7 Slidell, LA | 2.0 | 1.0 | 850 | $995 | $1.17 | 3d | 1 | 1.22mi |
| 4456 Pontchartrain Dr Unit 15 Slidell, LA | 2.0 | 1.0 | 850 | $1,195 | $1.41 | 21d | 1 | 1.23mi |
| 1640 Town Center Pkwy Slidell, LA | 3.0 | 1.0–2.0 | 959 | $1,635 | $1.71 | 2d | 46 | 1.30mi |
| 110 Canulette Rd #12 Slidell, LA | 1.0 | 1.0 | 1300 | $1,000 | $0.77 | 21d | 1 | 1.30mi |
| 1303 Town Center Pkwy Slidell, LA | 3.0 | 1.0–2.0 | 990 | $1,588 | $1.60 | 2d | 31 | 1.35mi |
Listing history 15 events
-
2026-06-18days on market $135,000 Active 64 DOM
-
2026-06-17days on market $135,000 Active 63 DOM
-
2026-06-16days on market $135,000 Active 62 DOM
-
2026-06-15days on market $135,000 Active 61 DOM
-
2026-06-13days on market $135,000 Active 59 DOM
-
2026-06-10pricedays on market $135,000 Active 56 DOM
-
2026-06-09days on market $145,000 Active 55 DOM
-
2026-06-08days on market $145,000 Active 54 DOM
-
2026-06-07days on market $145,000 Active 53 DOM
-
2026-06-03days on market $145,000 Active 49 DOM
-
2026-06-02days on market $145,000 Active 48 DOM
-
2026-06-01days on market $145,000 Active 47 DOM
-
2026-05-31days on market $145,000 Active 46 DOM
-
2026-04-15$145,000 Active 707-char remark
Show marketing remark (707 chars)
Immaculate and move-in ready 2-bedroom, 1-bath all-brick home featuring stylish updates throughout. Interior highlights include luxury vinyl wood plank flooring, warm natural wood tones, and a spacious kitchen with white cabinetry, ceramic countertops, gas range, and a large pantry. The inviting family room is filled with natural light from an oversized window, creating a bright and welcoming space. Major updates include a new roof (2023), main sewer line replacement (2023), and A/C unit (2019). Situated on a huge yard with plenty of room to enjoy, this home also offers the added peace of mind of a renewable termite contract. A beautifully maintained property that is truly ready for its next owner.
ⓘ Source: listings_history table (triggers on properties + properties_extension) + one-shot
backfill from property_details.listing_events for pre-trigger history.
Nearby sold comps map
Loading sold comps map…
Walkable amenities ~0.75 mi
Loading nearby amenities…
Taxation est. · year 1
- Rental income
- $16,732
- − Mortgage interest
- −$7,562
- − Property taxes
- −$2,025
- − Insurance
- −$675
- − Repairs & maintenance
- −$1,339
- − Management
- −$1,339
- − Depreciation
- −$3,927
- Taxable loss
- −$134
- Est. tax savings @ 24.0%
- +$32
- After-tax cash flow
- $2,055/yr
For passive investors: Depreciation is non-cash, so a rental often shows a tax loss while cash-flowing — sheltering income. Rental losses are passive: they offset passive income freely, and up to $25,000/yr can offset ordinary (W-2) income if you actively participate and your MAGI is under $100k (phasing out to $0 by $150k); unused losses carry forward. On sale, claimed depreciation is recaptured at up to 25%, and gains may owe capital-gains tax (a 1031 exchange can defer both). Figures are a year-1 estimate at your 24.0% rate — not tax advice; consult a CPA.
Schools (NCES district)
- District
- St. Tammany Parish
- NCES district ID
- 2201650
- Math proficiency
- 43% ▼ -32.00%
- Reading proficiency
- 55% ▼ -26.00%
- Median HH income
- $61,752
- Composite
- 43.04/100
- National rank
- #3098
- State rank
- #11 of 98 in LA
Livability — Slidell
- Score
- 70/100
- State rank
- #57
- US rank
- #7673
Category grades
Schools grade is shown separately in the Schools card above.
Census & demographics
- Census place
- Slidell, LA
- County
- Saint Tammany Parish · 228,296 people
- City population
- 95,511
- Metro
- New Orleans-Metairie, LA
- Population (ZIP)
- 39,034
- Household income
- $72,843
- Rent vs Own
- Severe rent burden
- 1331.0
Population outlook (St. Tammany County) Hauer SSP2
- Today (2025)
- 286,725 people
- By 2030
- 304,175 · +6.1%
- By 2040
- 336,203 · +17.3%
- By 2050
- 364,590 · +27.2%
- By 2075
- 433,362 · +51.1%
- By 2100
- 470,333 · +64.0%
Race, ethnicity, and origin ACS 2023
- Neighborhood character
- Predominantly White (66%)
- Race & ethnicity
- White 66% Black 17% Two or more races 10% Hispanic / Latino 9% Native American 2% Asian 1%
- Hispanic origin (detail)
- Mexican 3% Puerto Rican 1%
- Common ancestry
- Lithuanian 15% Slovak 2% Romanian 1%
- Foreign-born
- 3% · Canada, Vietnam
- Languages at home
- 93% English-only · Spanish 5% Vietnamese 1%
Political lean MEDSL · St. Tammany
- 2024 margin
- Solid R (+43.8) · D 27.3% · R 71.1% · Other 1.6%
- 2008→2024 swing
- +9.6pp toward D · 2008: -53.4pp · 2024: -43.8pp
- All cycles
- 2024: R+43.8 2020: R+44.2 2016: R+50.8 2012: R+52.2 2008: R+53.4
Not yet ingested
- Civics
- —
Market trends
- HPI YoY
- ▼ -173.60%
- Current HPI
- 147.4749
- Rent YoY
- ▲ 1.47%
- Metro
- New Orleans-Metairie, LA
- State GDP YoY
- ▲ 3.29%
- F500 in state
- 10
Industry mix (Fortune 500 HQ in LA)
| Industry | F500 HQs | Revenue |
|---|---|---|
| Telecommunications | 2 | $23B |
|
||
| Utilities | 1 | $12B |
|
||
| Wholesale / Distribution | 1 | $5B |
|
||
| Advertising | 1 | $2B |
|
||
Price history
+0.0% since first listed2 events — show timeline
- 2026-04-15 Listed $145,000 AcadianaMLS
- 2026-04-15 Listed $145,000 GSREIN
Property tax history
-14.6%/yrLatest (2025): $159 · -14.4% YoY. Source: county tax records.
Cash-flow waterfall
monthlySold comps — $/sqft
last 12 mo · ≤1 miLoading sold comps…