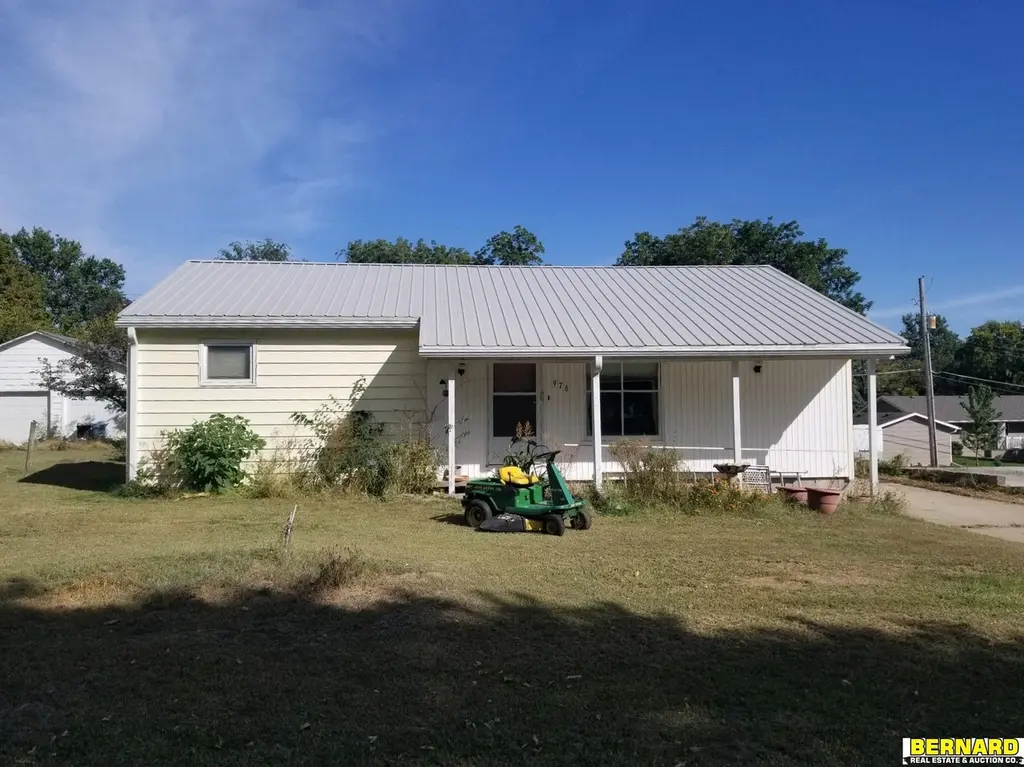
976 Central Ave · Humboldt, NE
Flood risk 1/10 · Minimal
- FEMA flood zone
- X (unshaded)
- Chance of flooding over 30 yrs
- 0.0%
- Est. flood insurance / yr
- $473 – $860
Fire risk 5/10 · Moderate
- Est. fire insurance / yr
- $1,161 – $2,155
Heat risk 3/10 · Minor
- Hot days now (above 107°F)
- 7 days/yr
- Hot days in 30 yrs
- 16 days/yr
Wind risk 2/10 · Minimal
- Chance of severe wind over 30 yrs
- —
Air-quality risk 2/10 · Minimal
- Unhealthy air days now
- 1 days/yr
- Unhealthy air days in 30 yrs
- 1 days/yr
Risk factors via First Street. Map © Google.
Why this score? — see what drove the A- grade
The composite is a weighted blend of 9 inputs, each scored 0–100. Each bar is that input's sub-score; the figure is the points it added to the 100-point composite (weight × sub-score).
- Cash flow +28.6/30.0
- ARV discount +15.0/15.0
- DSCR +10.0/10.0
- 1% rule +7.4/10.0
- Appreciation +6.8/10.0
- Schools +4.0/10.0
- Livability +3.5/5.0
- Rent growth +2.5/5.0
- Condition / age +2.5/5.0
$90,500
🖨 Deal sheet 📄 Offer letter ✓ Due diligence
Listing remarks
Ranch style home features large living/dining area, eat in kitchen, main floor mudroom/laundry. 3 bedrooms, 2 baths all of this near school. Attached garage provides storage and a place for you vehicle. Back yard provides a great place for family , friends and pets. Deck great for enjoying the outdoors.
Key facts
- Back yard
- Attached garage
- Eat in kitchen
Tags
Property features AI
Exterior
- Parking: Attached garage (1 covered space, 1 total parking space)
- Utilities: Public water; Public sewer
- Home design: Single-family residence; Residential property; Built in 1950; 1,606 square feet of living area; Not new / not a model
- Construction: Block foundation
- Exterior features: Porch; Deck; Chain link fencing; Lot up to 1/4 acre (approx. 0.17 acre, 60 x 125)
Interior
- Bedrooms: Master bedroom on main floor; Second bedroom on main floor; Third bedroom on main floor
- Bathrooms: Two bathrooms (one full, one three-quarter), both on the main floor
- Heating & cooling: Natural gas forced-air heating; Central air conditioning
- Interior features: Walk-up basement access; No fireplaces listed
Neighborhood map
What this means for you Summary
Snapshot
- This is a 3-bed/1.0-bath single-family listed at $90k.
Deal economics
- At list price, monthly cash flow is $298 ($4k/yr) — positive.
- The deal already cash-flows at list — no discount required.
- Meets the 1% rule at list price ($1k rent vs $90k).
- Recommended offer: $88k (3.0% below list) — sets the bar for market timing.
Location & tenants
- Location reads 70/100 on livability (#217 in NE) — a middle-class / working-renter tenant base. Strengths: cost of living A+, housing A+, health & safety A+; Watch: crime C-, amenities F, commute F.
- Humboldt Table Rock Steinauer (rural): math 50% / reading 40% proficiency, ranked #188 of 245 in NE (top 77%) — families likely to look elsewhere, expect single-tenant / working-renter base with shorter leases.
- Zoned schools: Htrs Elementary School (math 54% / reading 44%, grade D, #233 of 502 statewide, top 52%, 165 students, 27% FRL); Htrs Middle School (math 44% / reading 34%, grade F, #86 of 128 statewide, top 73%, 62 students, 32% FRL); Htrs High School (math 50% / reading 50%, grade D, #107 of 261 statewide, top 52%, 73 students, 25% FRL).
- Market conditions: 7 active listings in the ZIP; 17 units permitted in Richardson County in 2024 (0 in 5+ unit buildings).
Forward outlook
- In year one you build about $4k of equity ($626 loan paydown + $3k appreciation (3.5% local appreciation)).
- Richardson County population projected at -17% by 2050 — secular population decline; favor cash flow + early exit over multi-decade hold.
- At projected returns (3.5% appreciation + 3.0% rent growth), your $25k cash investment doubles in ~4 years — after that, you're playing with house money.
- By year 9, paydown + projected appreciation supports a ~$33k cash-out refi (75% LTV) — recoverable capital for the next deal without selling this one.
Negotiation context
- It's been on market 37 days — a 3% lower offer ($88k) is reasonable based on typical stale-listing flexibility.
- 3 sale attempts since 2y ago with the ask held roughly flat each time — persistent listings suggest the price (not the market) is what's stuck; bring a comps-based counter.
- Current owner paid $33k; list at $90k implies a 171% gain — meaningful room to come down on a strong offer.
Risks & watch-outs
- Watch-outs: built in 1950 — expect roof / HVAC / electrical / plumbing capex.
- Climate carrying-cost: moderate wildfire risk — expect insurance premiums to compound above CPI over the hold.
Questions for the listing agent
- It's been on market 37 days. Have you received any prior offers? Is the seller open to a 3% concession, seller financing, or rate buy-down credit?
- Built in 1950 — when were the roof, HVAC, electrical panel, plumbing, and water heater last replaced?
- Is there a deadline driving the sale (1031 exchange, divorce, estate, relocation)? That informs how much negotiation room exists.
- What's the average days-on-market for RENTAL listings here right now (not sales)? A rising rental-DOM trend means longer vacancies and softer asking-rent achievability than the comps imply.
- What's the recent tenant-quality profile in this submarket — average credit score on applications, eviction rate, late-payment / NSF rate, and stable-employment percentage? A property-management company in the area should have these aggregated.
- How much new for-sale + rental construction is in the pipeline within 1–3 miles? Heavy new supply typically softens prices + rents 12–24 months out; constrained supply supports both.
Investment metrics
- 1% rule
- 1.24% ✓
- Cap rate
- 10.25%
- Cash-on-cash
- 14.13%
- DSCR
- 1.63
- GRM
- 6.7
CMA / ARV
- ARV (on-the-fly)
- $155,782
- Comps found
- 1
Show comp detail 1 sale within ~0.75 mi
| Address | Dist | Beds/Ba | Sqft | Sold | Price | $/sf | Match |
|---|---|---|---|---|---|---|---|
| 731 5th St | 0.38mi | 3/1.5 | 1,598 (-0%) | 20mo | $155,000 | $97 | 63 |
Match score weights: distance 35% · size 25% · config 20% · recency 20%. Top-matched comps best support the ARV.
Projected returns pro-forma
3.53% appreciation · 3.0% rent growth · sell at horizon
- IRR
- 21.9%
- Equity multiple
- 2.28×
- Total profit
- $32,449
- Equity at exit
- $43,401
- IRR
- 22.5%
- Equity multiple
- 4.39×
- Total profit
- $85,802
- Equity at exit
- $69,072
Cash invested: $25,340 (down + closing). Projections, not guarantees.
Landlord ↔ Tenant lean methodology
- Overall (STATE)
- 83 Strongly Landlord-Friendly
- State Nebraska
- 83 Strongly Landlord-Friendly · R+13
- County
- — inherits STATE
- City
- — inherits STATE
ZIP-level market 68376
- Home prices YoY
- 2.0%
- Active inventory
- 7
- Price-to-rent
- 6.7×
Monthly cashflow live
- Estimated rent
- $1,125 medium interval (Pro) →
- Mortgage (P&I)
- −$475
- Tax from tax record
- −$78 /mo · $936/yr
- Insurance
- −$38
- HOA
- −$0
- Vacancy / Maint / Mgmt
- −$236
- Net cashflow
- $298
Break-even live
UW: 25.0% down · 7.5% · 30yr · 1.5% tax · 5.0% vac · 8.0% maint · 8.0% mgmt
Financing live
Cash to close
- Down payment
- $22,625
- Closing costs
- $2,715
- Reserves months
- —
- Total cash needed
- —
Loan-product check · same deal, 3 products live
Conventional
25% down · 7.5% · 30yr
- Down + closing
- —
- Monthly P&I
- —
- Monthly cashflow
- —
- DSCR
- —
- Eligible?
- —
Personal DTI + credit; lowest rate.
DSCR
20% down · 8.5% · 30yr
- Down + closing
- —
- Monthly P&I
- —
- Monthly cashflow
- —
- DSCR
- —
- Eligible?
- —
No personal income docs; deal must DSCR.
Hard money
10% down · 12.0% · 12mo
- Down + closing
- —
- Monthly P&I
- —
- Monthly cashflow
- —
- DSCR
- —
- Eligible?
- —
Short-term bridge; refi at stabilization.
Listing history 21 events
-
2026-06-18days on market $90,500 Active 37 DOM
-
2026-06-17days on market $90,500 Active 36 DOM
-
2026-06-16days on market $90,500 Active 35 DOM
-
2026-06-15days on market $90,500 Active 34 DOM
-
2026-06-13days on market $90,500 Active 32 DOM
-
2026-06-12days on market $90,500 Active 31 DOM
-
2026-06-09days on market $90,500 Active 28 DOM
-
2026-06-08days on market $90,500 Active 27 DOM
-
2026-06-07days on market $90,500 Active 26 DOM
-
2026-06-07days on market $90,500 Active 25 DOM
-
2026-06-04days on market $90,500 Active 22 DOM
-
2026-06-02days on market $90,500 Active 21 DOM
-
2026-06-01days on market $90,500 Active 20 DOM
-
2026-05-31days on market $90,500 Active 19 DOM
-
2026-05-12$90,500 New
-
2025-05-26historical
-
2025-04-25$100,000 New
-
2025-04-04historical
-
2024-10-03$100,000 New
-
2019-05-17soldstatus $33,400
-
2005-10-27soldstatus $38,000
ⓘ Source: listings_history table (triggers on properties + properties_extension) + one-shot
backfill from property_details.listing_events for pre-trigger history.
Tax reassessment forecast NE · Resets to sale price
- Current annual tax
- $936 · $78/mo
- Projected year-2 tax
- $1,566 · $130/mo
- Expected delta
- +$630/yr (+$52/mo · 67.2%)
ⓘ Screening estimate from a state-policy table — verify with the county assessor before closing.
Climate risk First Street
- Flood 1/10 Low FEMA zone X (unshaded) · 0% chance over 30 yrs
- Wildfire 5/10 Major
- Heat 3/10 Moderate 7 d/yr ≥107°F today · 16 d/yr by 30 yrs out
- Wind 2/10 Low
- Air quality 2/10 Low 1 unhealthy d/yr today · 1 by 30 yrs out
Nearby sold comps map
Loading sold comps map…
Walkable amenities ~0.75 mi
Loading nearby amenities…
Taxation est. · year 1
- Rental income
- $13,500
- − Mortgage interest
- −$5,069
- − Property taxes
- −$936
- − Insurance
- −$452
- − Repairs & maintenance
- −$1,080
- − Management
- −$1,080
- − Depreciation
- −$2,633
- Taxable income
- $2,249
- Est. tax owed @ 24.0%
- −$540
- After-tax cash flow
- $3,041/yr
For passive investors: Depreciation is non-cash, so a rental often shows a tax loss while cash-flowing — sheltering income. Rental losses are passive: they offset passive income freely, and up to $25,000/yr can offset ordinary (W-2) income if you actively participate and your MAGI is under $100k (phasing out to $0 by $150k); unused losses carry forward. On sale, claimed depreciation is recaptured at up to 25%, and gains may owe capital-gains tax (a 1031 exchange can defer both). Figures are a year-1 estimate at your 24.0% rate — not tax advice; consult a CPA.
Schools (NCES district)
- District
- Humboldt Table Rock Steinauer
- NCES district ID
- 3100179
- Math proficiency
- 50% ▲ 5.00%
- Reading proficiency
- 40% ▬ 0.00%
- Median HH income
- $41,706
- Composite
- 40.09/100
- National rank
- #7865
- State rank
- #188 of 245 in NE
Livability — Humboldt
- Score
- 70/100
- State rank
- #217
- US rank
- #7779
Category grades
Schools grade is shown separately in the Schools card above.
Census & demographics
- Census place
- Humboldt, NE
- City population
- 1,127
- Population (ZIP)
- 1,127
Population outlook (Richardson County) Hauer SSP2
- Today (2025)
- 7,601 people
- By 2030
- 7,309 · -3.8%
- By 2040
- 6,764 · -11.0%
- By 2050
- 6,277 · -17.4%
- By 2075
- 5,559 · -26.9%
- By 2100
- 4,967 · -34.7%
Race, ethnicity, and origin ACS 2023
- Neighborhood character
- Predominantly White (89%)
- Race & ethnicity
- White 89% Hispanic / Latino 6% Two or more races 5%
- Hispanic origin (detail)
- Mexican 2%
- Common ancestry
- Iranian 3% Lithuanian 3% Italian 1%
- Foreign-born
- 1% · Canada
- Languages at home
- 98% English-only · Spanish 2%
Political lean MEDSL · Richardson
- 2024 margin
- Solid R (+51.5) · D 23.7% · R 75.1% · Other 1.2%
- 2008→2024 swing
- -30.6pp toward R · 2008: -20.9pp · 2024: -51.5pp
- All cycles
- 2024: R+51.5 2020: R+50.2 2016: R+51.4 2012: R+33.3 2008: R+20.9
Not yet ingested
- Civics
- —
Market trends
- HPI YoY
- ▲ 3.53%
- Current HPI
- 181.0103
- Rent YoY
- —
- Metro
- —
- State GDP YoY
- ▲ 0.68%
- F500 in state
- 2
Industry mix (Fortune 500 HQ in NE)
| Industry | F500 HQs | Revenue |
|---|---|---|
| Conglomerate | 1 | $371B |
|
||
Price history
+138.2% since first listed7 events — show timeline
- 2026-05-12 Listed $90,500 GPRMLS
- 2025-05-26 Listing Removed — GPRMLS
- 2025-04-25 Listed $100,000 GPRMLS
- 2025-04-04 Listing Removed — GPRMLS
- 2024-10-03 Listed $100,000 GPRMLS
- 2019-05-17 Sold (Public Records) $33,400 Public Records
- 2005-10-27 Sold (Public Records) $38,000 Public Records
Property tax history
-0.9%/yrLatest (2018): $936 · -0.5% YoY. Source: county tax records.
Cash-flow waterfall
monthlySold comps — $/sqft
last 12 mo · ≤1 miLoading sold comps…