80984 Coyote Ln · Heppner, OR
Flood risk 1/10 · Minimal
- FEMA flood zone
- X (unshaded)
- Chance of flooding over 30 yrs
- 0.0%
- Est. flood insurance / yr
- $507 – $1,088
Fire risk 8/10 · Major
- Est. fire insurance / yr
- $498 – $926
Heat risk 1/10 · Minimal
- Hot days now (above 83°F)
- 7 days/yr
- Hot days in 30 yrs
- 15 days/yr
Wind risk 1/10 · Minimal
- Chance of severe wind over 30 yrs
- —
Air-quality risk 7/10 · Major
- Unhealthy air days now
- 9 days/yr
- Unhealthy air days in 30 yrs
- 9 days/yr
Risk factors via First Street. Map © Google.
Why this score? — see what drove the C+ grade
The composite is a weighted blend of 9 inputs, each scored 0–100. Each bar is that input's sub-score; the figure is the points it added to the 100-point composite (weight × sub-score).
- Cash flow +26.9/30.0
- DSCR +9.3/10.0
- ARV discount +7.5/15.0
- 1% rule +7.3/10.0
- Livability +3.8/5.0
- Rent growth +2.5/5.0
- Condition / age +2.5/5.0
- Schools +2.3/10.0
- Appreciation +0.0/10.0
$105,000
🖨 Deal sheet 📄 Offer letter ✓ Due diligence
Listing remarks MLS
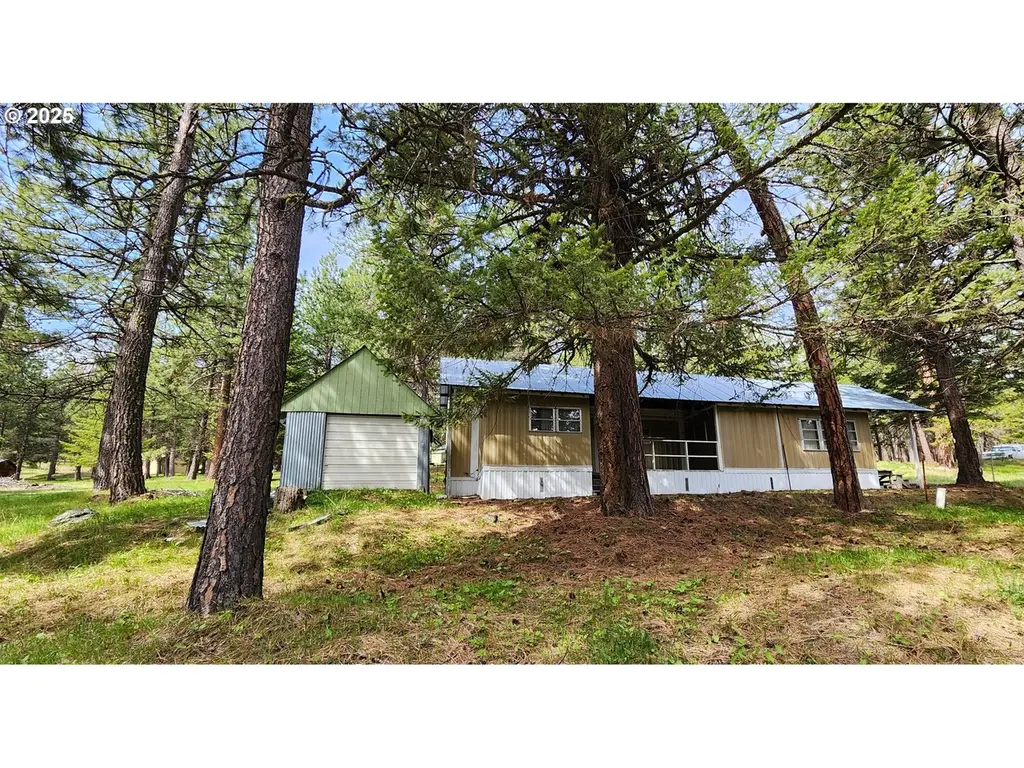
Recreational Mountain Property! Blake Ranch is a relaxing small mountain community with year round access just 20 minutes outside Heppner. 1.02 acre lot with Covered 1964 single wide. 13x14' drive in and out shed with two roll up doors and concrete floor. 10x12' shed with two fuel tanks. Connected to water, power and septic. Black Mt. Water District. This property has not been used in years and is sold as is. Cash only. Deer/elk/turkeys/fishing/hunting/ATV /snowmobile/cross country skiing. Great family living with school bus access. Lots of potential.
Key facts
- 1.02 acre lot
- Built 1964
- Listed 44 days
Property features AI
Finance
- Other: Property condition: fixer; Lot approximately 1.02 acres; View: territorial; Zoning: FO; Land not leased
Exterior
- Utilities: Community water; Septic tank; Electricity
- Home design: Manufactured home on real property; Residential property; Territorial view
- Construction: Built in 1964; Skirting foundation; Metal and other roof types
- Exterior features: Covered patio; Outbuilding; Tool shed; Aluminum exterior; Gentle sloping, wooded lot; Gravel road access
Interior
- Kitchen: Built-in range; Cooktop; Range hood; Free-standing refrigerator
- Bedrooms: Primary bedroom on main level; Second bedroom on main level; Third bedroom on main level
- Flooring: Vinyl; Carpet
- Bathrooms: One full bathroom on main level
- Heating & cooling: Forced-air heating; Electric hot water; No cooling
- Interior features: Vinyl flooring; Wall-to-wall carpet; Aluminum window frames
Neighborhood map
What this means for you Summary
Snapshot
- This is a 3-bed/1.0-bath manufactured listed at $105k.
Deal economics
- At list price, monthly cash flow is $291 ($3k/yr) — positive.
- The deal already cash-flows at list — no discount required.
- Meets the 1% rule at list price ($1k rent vs $105k).
- Recommended offer: $102k (3.0% below list) — sets the bar for market timing.
Location & tenants
- Location reads 76/100 on livability (#81 in OR, #3,691 nationally) — a middle-class / working-renter tenant base. Strengths: cost of living A+, housing A+, health & safety A+; Watch: employment D+, amenities F, commute F.
- Morrow SD 1 (town): math 15% / reading 39% proficiency, ranked #49 of 58 in OR (top 84%) — low school quality limits family demand, transient renter base, plan for 1-2y turnover; 60% free/reduced lunch — lower-income household profile, screen leases tightly.
- Zoned schools: Heppner Elementary School (math 30% / reading 64%, grade D, #131 of 412 statewide, top 32%, 199 students, 68% FRL); Heppner Junior/Senior High School (math 27% / reading 54%, grade F, #68 of 143 statewide, top 47%, 159 students, 68% FRL).
- Zoned-school proficiency averages 44% at this address vs 27% district-wide (+17 pts) — the actual schools serving this property are materially stronger than the Morrow SD 1 average implies; a family-tenant draw the district grade alone would hide.
- Market conditions: 33 active listings in the ZIP; 57 units permitted in Morrow County in 2024 (0 in 5+ unit buildings).
Forward outlook
- Local home prices are declining (-3.0%/yr); year-one equity from $726 of loan paydown is wiped out by about $3k of value loss. Plan a longer hold.
- At projected returns (-3.0% appreciation + 3.0% rent growth), your $29k cash investment doubles in ~10 years — after that, you're playing with house money.
Negotiation context
- It's been on market 45 days — a 3% lower offer ($102k) is reasonable based on typical stale-listing flexibility.
- 2 sale attempts; this cycle's ask has dropped $8k (7%) from the opening price — seller is motivated, your offer sets the floor, not the list.
Risks & watch-outs
- Climate carrying-cost: severe wildfire risk — expect insurance premiums to compound above CPI over the hold.
Questions for the listing agent
- It's been on market 45 days. Have you received any prior offers? Is the seller open to a 3% concession, seller financing, or rate buy-down credit?
- Built in 1964 — when were the roof, HVAC, electrical panel, plumbing, and water heater last replaced?
- Is there a deadline driving the sale (1031 exchange, divorce, estate, relocation)? That informs how much negotiation room exists.
- What's the average days-on-market for RENTAL listings here right now (not sales)? A rising rental-DOM trend means longer vacancies and softer asking-rent achievability than the comps imply.
- What's the recent tenant-quality profile in this submarket — average credit score on applications, eviction rate, late-payment / NSF rate, and stable-employment percentage? A property-management company in the area should have these aggregated.
- How much new for-sale + rental construction is in the pipeline within 1–3 miles? Heavy new supply typically softens prices + rents 12–24 months out; constrained supply supports both.
Investment metrics
- 1% rule
- 1.23% ✓
- Cap rate
- 9.62%
- Cash-on-cash
- 11.87%
- DSCR
- 1.53
- GRM
- 6.8
CMA / ARV
No comps found within radius.
Projected returns pro-forma
-3.0% appreciation · 3.0% rent growth · sell at horizon
- IRR
- 1.4%
- Equity multiple
- 1.05×
- Total profit
- $1,520
- Equity at exit
- $15,656
- IRR
- 11.0%
- Equity multiple
- 1.86×
- Total profit
- $25,244
- Equity at exit
- $9,078
Cash invested: $29,400 (down + closing). Projections, not guarantees.
Landlord ↔ Tenant lean methodology
- Overall (STATE)
- 28 Tenant-Leaning
- State Oregon
- 28 Tenant-Leaning · D+6
- County
- — inherits STATE
- City
- — inherits STATE
ZIP-level market 97836
- Home prices YoY
- -14.6%
- Active inventory
- 33
- Price-to-rent
- 6.8×
Monthly cashflow live
- Estimated rent
- $1,286 medium interval (Pro) →
- Mortgage (P&I)
- −$551
- Tax est. 1.5%
- −$131 /mo · $1,575/yr
- Insurance
- −$44
- HOA
- −$0
- Vacancy / Maint / Mgmt
- −$270
- Net cashflow
- $291
Break-even live
UW: 25.0% down · 7.5% · 30yr · 1.5% tax · 5.0% vac · 8.0% maint · 8.0% mgmt
Financing live
Cash to close
- Down payment
- $26,250
- Closing costs
- $3,150
- Reserves months
- —
- Total cash needed
- —
Loan-product check · same deal, 3 products live
Conventional
25% down · 7.5% · 30yr
- Down + closing
- —
- Monthly P&I
- —
- Monthly cashflow
- —
- DSCR
- —
- Eligible?
- —
Personal DTI + credit; lowest rate.
DSCR
20% down · 8.5% · 30yr
- Down + closing
- —
- Monthly P&I
- —
- Monthly cashflow
- —
- DSCR
- —
- Eligible?
- —
No personal income docs; deal must DSCR.
Hard money
10% down · 12.0% · 12mo
- Down + closing
- —
- Monthly P&I
- —
- Monthly cashflow
- —
- DSCR
- —
- Eligible?
- —
Short-term bridge; refi at stabilization.
Listing history 19 events
-
2026-06-19days on market $105,000 Active 45 DOM
-
2026-06-18days on market $105,000 Active 44 DOM
-
2026-06-17days on market $105,000 Active 43 DOM
-
2026-06-16days on market $105,000 Active 42 DOM
-
2026-06-15days on market $105,000 Active 41 DOM
-
2026-06-14days on market $105,000 Active 39 DOM
-
2026-06-12days on market $105,000 Active 38 DOM
-
2026-06-09days on market $105,000 Active 35 DOM
-
2026-06-08days on market $105,000 Active 34 DOM
-
2026-06-07days on market $105,000 Active 33 DOM
-
2026-06-05days on market $105,000 Active 30 DOM
-
2026-06-02days on market $105,000 Active 28 DOM
-
2026-06-01days on market $105,000 Active 27 DOM
-
2026-05-31days on market $105,000 Active 26 DOM
-
2026-05-30days on market $105,000 Active 25 DOM
-
2026-05-05$112,500 Active 557-char remark
-
2025-06-13soldstatus $99,000 Closed 557-char remark
Show marketing remark (557 chars)
Recreational Mountain Property! Blake Ranch is a relaxing small mountain community with year round access just 20 minutes outside Heppner. 1.02 acre lot with Covered 1964 single wide. 13x14' drive in and out shed with two roll up doors and concrete floor. 10x12' shed with two fuel tanks. Connected to water, power and septic. Black Mt. Water District. This property has not been used in years and is sold as is. Cash only. Deer/elk/turkeys/fishing/hunting/ATV /snowmobile/cross country skiing. Great family living with school bus access. Lots of potential.
-
2025-06-01status Pending 557-char remark
Show marketing remark (557 chars)
Recreational Mountain Property! Blake Ranch is a relaxing small mountain community with year round access just 20 minutes outside Heppner. 1.02 acre lot with Covered 1964 single wide. 13x14' drive in and out shed with two roll up doors and concrete floor. 10x12' shed with two fuel tanks. Connected to water, power and septic. Black Mt. Water District. This property has not been used in years and is sold as is. Cash only. Deer/elk/turkeys/fishing/hunting/ATV /snowmobile/cross country skiing. Great family living with school bus access. Lots of potential.
-
2025-05-25$99,000 Active 557-char remark
Show marketing remark (557 chars)
Recreational Mountain Property! Blake Ranch is a relaxing small mountain community with year round access just 20 minutes outside Heppner. 1.02 acre lot with Covered 1964 single wide. 13x14' drive in and out shed with two roll up doors and concrete floor. 10x12' shed with two fuel tanks. Connected to water, power and septic. Black Mt. Water District. This property has not been used in years and is sold as is. Cash only. Deer/elk/turkeys/fishing/hunting/ATV /snowmobile/cross country skiing. Great family living with school bus access. Lots of potential.
ⓘ Source: listings_history table (triggers on properties + properties_extension) + one-shot
backfill from property_details.listing_events for pre-trigger history.
Climate risk First Street
- Flood 1/10 Low FEMA zone X (unshaded) · 0% chance over 30 yrs
- Wildfire 8/10 Severe
- Heat 1/10 Low 7 d/yr ≥83°F today · 15 d/yr by 30 yrs out
- Wind 1/10 Low
- Air quality 7/10 Severe 9 unhealthy d/yr today · 9 by 30 yrs out
Nearby sold comps map
Loading sold comps map…
Walkable amenities ~0.75 mi
Loading nearby amenities…
Taxation est. · year 1
- Rental income
- $15,438
- − Mortgage interest
- −$5,882
- − Property taxes
- −$1,575
- − Insurance
- −$525
- − Repairs & maintenance
- −$1,235
- − Management
- −$1,235
- − Depreciation
- −$3,055
- Taxable income
- $1,932
- Est. tax owed @ 24.0%
- −$464
- After-tax cash flow
- $3,025/yr
For passive investors: Depreciation is non-cash, so a rental often shows a tax loss while cash-flowing — sheltering income. Rental losses are passive: they offset passive income freely, and up to $25,000/yr can offset ordinary (W-2) income if you actively participate and your MAGI is under $100k (phasing out to $0 by $150k); unused losses carry forward. On sale, claimed depreciation is recaptured at up to 25%, and gains may owe capital-gains tax (a 1031 exchange can defer both). Figures are a year-1 estimate at your 24.0% rate — not tax advice; consult a CPA.
Schools (NCES district)
- District
- Morrow SD 1
- NCES district ID
- 4108520
- Math proficiency
- 15% ▼ -13.00%
- Reading proficiency
- 39% ▼ -3.00%
- Median HH income
- $48,315
- Composite
- 23.46/100
- National rank
- #7881
- State rank
- #49 of 58 in OR
Livability — Heppner
- Score
- 76/100
- State rank
- #81
- US rank
- #3691
Category grades
Schools grade is shown separately in the Schools card above.
Census & demographics
- Population (ZIP)
- 2,279
Population outlook (Morrow County) Hauer SSP2
- Today (2025)
- 11,011 people
- By 2030
- 10,944 · -0.6%
- By 2040
- 10,946 · -0.6%
- By 2050
- 11,054 · +0.4%
- By 2075
- 11,568 · +5.1%
- By 2100
- 11,688 · +6.1%
Race, ethnicity, and origin ACS 2023
- Neighborhood character
- Predominantly White (85%)
- Race & ethnicity
- White 85% Two or more races 8% Hispanic / Latino 8%
- Hispanic origin (detail)
- Mexican 7%
- Common ancestry
- Portuguese 3% Slovak 2% Serbian 2%
- Foreign-born
- 1% · Canada
- Languages at home
- 98% English-only · Spanish 2%
Political lean MEDSL · Morrow
- 2024 margin
- Solid R (+48.4) · D 24.1% · R 72.5% · Other 3.4%
- 2008→2024 swing
- -21.3pp toward R · 2008: -27.1pp · 2024: -48.4pp
- All cycles
- 2024: R+48.4 2020: R+43.3 2016: R+42.5 2012: R+34.8 2008: R+27.1
Not yet ingested
- Civics
- —
Market trends
- HPI YoY
- ▼ -38.75%
- Current HPI
- 227.529
- Rent YoY
- —
- Metro
- —
- State GDP YoY
- ▲ 2.05%
- F500 in state
- 2
Industry mix (Fortune 500 HQ in OR)
| Industry | F500 HQs | Revenue |
|---|---|---|
| Consumer Goods | 1 | $51B |
|
||
Price history
+6.1% since first listed5 events — show timeline
- 2026-05-21 Price Changed $105,000 RMLS
- 2026-05-05 Listed $112,500 RMLS
- 2025-06-13 Sold (MLS) $99,000 RMLS
- 2025-06-01 Pending — RMLS
- 2025-05-25 Listed $99,000 RMLS
Property tax history
+2.5%/yrLatest (2025): $66 · +4.7% YoY. Source: county tax records.
Cash-flow waterfall
monthlySold comps — $/sqft
last 12 mo · ≤1 miLoading sold comps…