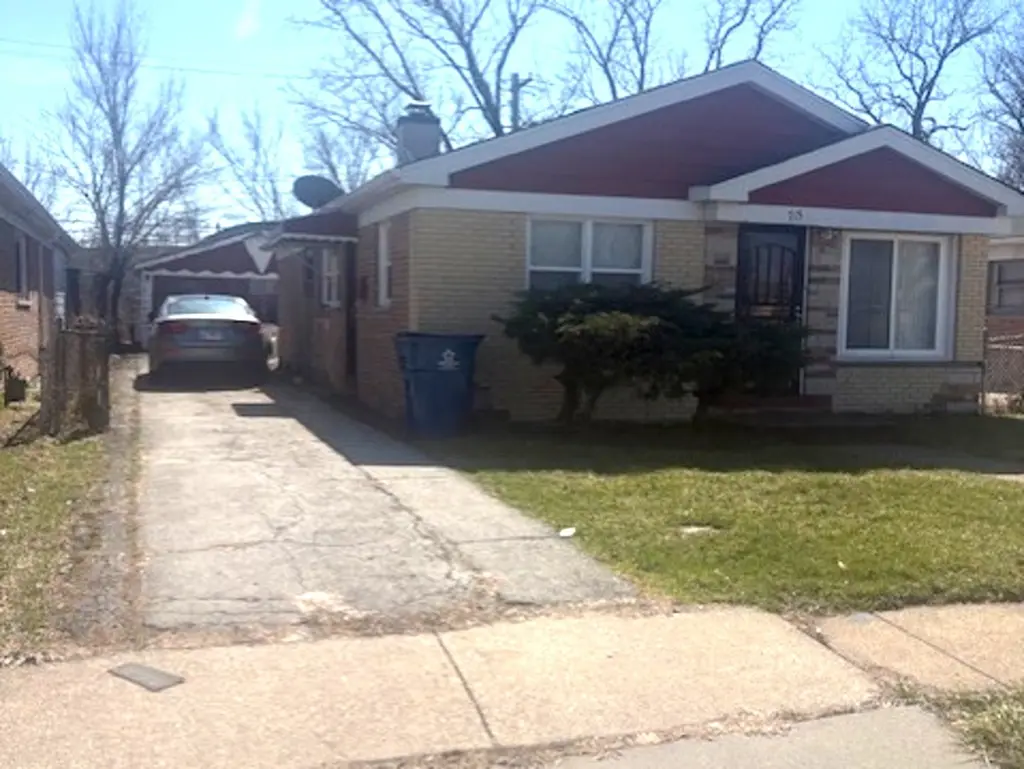
715 E 155th Ct · Phoenix, IL
Flood risk 1/10 · Minimal
- FEMA flood zone
- X (unshaded)
- Chance of flooding over 30 yrs
- 0.0%
- Est. flood insurance / yr
- $473 – $860
Fire risk 1/10 · Minimal
- Est. fire insurance / yr
- $804 – $1,492
Heat risk 3/10 · Minor
- Hot days now (above 102°F)
- 7 days/yr
- Hot days in 30 yrs
- 15 days/yr
Wind risk 2/10 · Minimal
- Chance of severe wind over 30 yrs
- —
Air-quality risk 4/10 · Minor
- Unhealthy air days now
- 4 days/yr
- Unhealthy air days in 30 yrs
- 5 days/yr
Risk factors via First Street. Map © Google.
Why this score? — see what drove the B- grade
The composite is a weighted blend of 9 inputs, each scored 0–100. Each bar is that input's sub-score; the figure is the points it added to the 100-point composite (weight × sub-score).
- Cash flow +25.3/30.0
- Appreciation +10.0/10.0
- DSCR +8.4/10.0
- 1% rule +8.2/10.0
- ARV discount +7.5/15.0
- Livability +3.8/5.0
- Rent growth +2.5/5.0
- Condition / age +2.5/5.0
- Schools +0.7/10.0
$134,500
🖨 Deal sheet 📄 Offer letter ✓ Due diligence
Listing remarks
3 bedroom brick ranch with 2 car garage. Updates done 3 years ago. Kitchen was updated 3 years ago with new kitchen cabinets, countertop, sink & stainless-steel appliances. Remodeled bath. Replaced most windows, all thermal pane. Quiet serene Phoenix. Hidden low traffic area. Enjoy South Holland School District #151. Close to commuter train at 155th & Park. Interior was just painted. Seller is working on other repairs & garage exterior painting. Seller might be able to consider some repairs for lender or village if needed, Immediate possession. Low traffic neighborhood. Well cared for pocket of homes. Mostly fenced yard
Key facts
- 4,356 sq ft lot
- 2 garage spots
- Built 1957
Property features AI
Finance
- Other: Property not currently leased; Possession at closing or immediate
- HOA & community: No master association fee required; Community features include park access and maintained streets
Exterior
- Parking: Detached garage (owned) with 2 garage spaces; Additional driveway parking; total parking for about 5 vehicles; Asphalt surfaces and side driveway
- Utilities: Lake Michigan water; Public sewer; Electric with circuit breakers; Cable available
- Home design: Detached single-family ranch; One story; Fee simple ownership
- Construction: Brick exterior with clad trim; Asphalt roof; Concrete perimeter foundation; Built approximately 61–70 years ago; Built before 1978
- Exterior features: Fenced yard; Oversized Chicago lot (dimensions approx. 41 x 110 x 40 x 113); Street lights, curbs, sidewalks, paved streets; Park nearby; commuter train and interstate access
Interior
- Kitchen: Range; Gas oven; Refrigerator; Disposal; Stainless steel appliances; Eating area / table space
- Bedrooms: Master bedroom on main level (approx. 13 x 11) with hardwood floors; Bedroom 2 on main level (approx. 12 x 10) with hardwood floors; Bedroom 3 on main level (approx. 10 x 10) with hardwood floors
- Flooring: Hardwood flooring in primary living areas and bedrooms; Laminate flooring also present; Vinyl flooring in kitchen and laundry
- Bathrooms: One full bathroom on the main level
- Heating & cooling: Natural gas heating; Forced air
- Interior features: First-floor bedroom; First-floor full bathroom; Six total rooms; Screens and drapes on windows
- Laundry & utility: Main-level laundry with washer and dryer present; Gas dryer hookup; In-unit laundry
Neighborhood map
What this means for you Summary
Snapshot
- This is a 3-bed/1.0-bath single-family listed at $134k.
Deal economics
- At list price, monthly cash flow is $307 ($4k/yr) — positive.
- The deal already cash-flows at list — no discount required.
- Meets the 1% rule at list price ($2k rent vs $134k).
- Recommended offer: $126k (6.0% below list) — sets the bar for market timing.
Location & tenants
- Location reads 75/100 on livability (#230 in IL, #4,248 nationally) — a middle-class / working-renter tenant base. Strengths: commute A+, cost of living A+, crime A-; Watch: health & safety C-, amenities F, employment F.
- Thornton Twp Hsd 205 (suburban): math 7% / reading 8% proficiency, ranked #594 of 620 in IL (top 96%) — low school quality limits family demand, transient renter base, plan for 1-2y turnover.
- Zoned schools: Thornton Township High School (math 7% / reading 7%, grade F, #605 of 693 statewide, top 87%, 1,628 students, 0% FRL).
- Market conditions: 134 active listings in the ZIP; 3 comparable units currently listed for rent nearby; rentals at typical pace (median 25d on market — plan ~3-4 weeks tenant-placement turnaround); 6,272 units permitted in Cook County in 2024 (4,658 in 5+ unit buildings).
Forward outlook
- In year one you build about $14k of equity ($930 loan paydown + $13k appreciation (10.0% local appreciation)).
- At projected returns (10.0% appreciation + 3.0% rent growth), your $38k cash investment doubles in ~2 years — after that, you're playing with house money.
- By year 3, paydown + projected appreciation supports a ~$36k cash-out refi (75% LTV) — recoverable capital for the next deal without selling this one.
Negotiation context
- It's been on market 90 days — a 6% lower offer ($126k) is reasonable based on typical stale-listing flexibility.
- 5 sale attempts since 16y ago with the ask held roughly flat each time — persistent listings suggest the price (not the market) is what's stuck; bring a comps-based counter.
- Current owner paid $110k; 22% above their basis — modest negotiation headroom, anchor on the comps not their cost.
Risks & watch-outs
- Watch-outs: property tax is 3.0% of price; built in 1957 — expect roof / HVAC / electrical / plumbing capex.
Questions for the listing agent
- It's been on market 90 days. Have you received any prior offers? Is the seller open to a 6% concession, seller financing, or rate buy-down credit?
- Built in 1957 — when were the roof, HVAC, electrical panel, plumbing, and water heater last replaced?
- Property tax is high relative to price — has the assessment been appealed recently, and will the sale trigger a re-assessment?
- Why hasn't it sold? Are there any deal-killer items the seller is aware of (foundation, flood, title, zoning, code violations)?
- Is there a deadline driving the sale (1031 exchange, divorce, estate, relocation)? That informs how much negotiation room exists.
- Schools are F-rated, which usually means shorter tenancies and higher turnover. Who's the typical renter profile here, and what's been the actual vacancy rate?
- What's the average days-on-market for RENTAL listings here right now (not sales)? A rising rental-DOM trend means longer vacancies and softer asking-rent achievability than the comps imply.
- What's the recent tenant-quality profile in this submarket — average credit score on applications, eviction rate, late-payment / NSF rate, and stable-employment percentage? A property-management company in the area should have these aggregated.
- How much new for-sale + rental construction is in the pipeline within 1–3 miles? Heavy new supply typically softens prices + rents 12–24 months out; constrained supply supports both.
Investment metrics
- 1% rule
- 1.32% ✓
- Cap rate
- 9.04%
- Cash-on-cash
- 9.79%
- DSCR
- 1.44
- GRM
- 6.3
CMA / ARV
- ARV (on-the-fly)
- $134,640
- Comps found
- 12
Show comp detail 12 sales within ~0.75 mi
| Address | Dist | Beds/Ba | Sqft | Sold | Price | $/sf | Match |
|---|---|---|---|---|---|---|---|
| 15533 Vincennes Rd | 0.07mi | 3/1.0 | 1,020 (0%) | 6mo | $85,000 | $83 | 92 |
| 736 E 155th Pl | 0.11mi | 3/1.0 | 1,020 (0%) | 12mo | $135,000 | $132 | 85 |
| 635 E 155th Pl | 0.07mi | 3/1.0 | 1,030 (+1%) | 15mo | $128,000 | $124 | 83 |
| 15316 4th Ave | 0.27mi | 3/1.0 | 964 (-6%) | 2mo | $35,000 | $36 | 77 |
| 931 Miller Pl | 0.46mi | 3/1.5 | 1,042 (+2%) | 1mo | $140,000 | $134 | 72 |
| 15353 7th Ave | 0.26mi | 3/2.0 | 1,040 (+2%) | 14mo | $203,000 | $195 | 69 |
| 15137 7th Ave | 0.56mi | 3/1.0 | 1,000 (-2%) | 8mo | $78,000 | $78 | 63 |
| 15131 6th Ave | 0.56mi | 3/1.0 | 1,064 (+4%) | 11mo | $75,000 | $70 | 58 |
| 523 E 152nd St | 0.51mi | 2/1.0 (-1) | 942 (-8%) | 3mo | $16,000 | $17 | 56 |
| 16005 Lowe Ave | 0.53mi | 3/2.0 | 1,114 (+9%) | 15mo | $167,000 | $150 | 43 |
| 15955 State St | 0.73mi | 2/1.0 (-1) | 900 (-12%) | 5mo | $175,000 | $194 | 38 |
| 15036 Perry Ave | 0.66mi | 3/1.0 | 900 (-12%) | 15mo | $145,000 | $161 | 37 |
Match score weights: distance 35% · size 25% · config 20% · recency 20%. Top-matched comps best support the ARV.
Projected returns pro-forma
10.0% appreciation · 3.0% rent growth · sell at horizon
- IRR
- 31.5%
- Equity multiple
- 3.47×
- Total profit
- $92,960
- Equity at exit
- $121,168
- IRR
- 27.2%
- Equity multiple
- 7.87×
- Total profit
- $258,620
- Equity at exit
- $261,304
Cash invested: $37,660 (down + closing). Projections, not guarantees.
Landlord ↔ Tenant lean methodology
- Overall (STATE)
- 43 Moderately Tenant-Leaning
- State Illinois
- 43 Moderately Tenant-Leaning · D+7
- County
- — inherits STATE
- City
- — inherits STATE
ZIP-level market 60426
- Home prices YoY
- 6.9%
- Active inventory
- 134
- Price-to-rent
- 6.3×
Monthly cashflow live
- Estimated rent
- $1,781 medium interval (Pro) →
- Mortgage (P&I)
- −$705
- Tax from tax record
- −$338 /mo · $4,061/yr
- Insurance
- −$56
- HOA
- −$0
- Vacancy / Maint / Mgmt
- −$374
- Net cashflow
- $307
Break-even live
UW: 25.0% down · 7.5% · 30yr · 1.5% tax · 5.0% vac · 8.0% maint · 8.0% mgmt
Financing live
Cash to close
- Down payment
- $33,625
- Closing costs
- $4,035
- Reserves months
- —
- Total cash needed
- —
Loan-product check · same deal, 3 products live
Conventional
25% down · 7.5% · 30yr
- Down + closing
- —
- Monthly P&I
- —
- Monthly cashflow
- —
- DSCR
- —
- Eligible?
- —
Personal DTI + credit; lowest rate.
DSCR
20% down · 8.5% · 30yr
- Down + closing
- —
- Monthly P&I
- —
- Monthly cashflow
- —
- DSCR
- —
- Eligible?
- —
No personal income docs; deal must DSCR.
Hard money
10% down · 12.0% · 12mo
- Down + closing
- —
- Monthly P&I
- —
- Monthly cashflow
- —
- DSCR
- —
- Eligible?
- —
Short-term bridge; refi at stabilization.
Rent comps 3 comps
| Address | Beds | Baths | Sqft | Rent | $/sqft | DOM | Units | Dist |
|---|---|---|---|---|---|---|---|---|
| 16048 Halsted St Unit 2 Harvey, IL | 3.0 | 1.0 | 1091 | $1,650 | $1.51 | 25d | 1 | 0.73mi |
| 14844 Wabash Ave Dolton, IL | 3.0 | 1.5 | 1277 | $2,320 | $1.82 | 25d | 1 | 1.32mi |
| 15238 Doctor Martin Luther King Junior Dr Unit 2W Dolton, IL | 2.0 | 1.0 | 800 | $1,500 | $1.88 | 11d | 1 | 1.41mi |
Listing history 26 events
-
2026-06-18days on market $134,500 Active 90 DOM
-
2026-06-17days on market $134,500 Active 89 DOM
-
2026-06-16days on market $134,500 Active 88 DOM
-
2026-06-15days on market $134,500 Active 87 DOM
-
2026-06-13days on market $134,500 Active 85 DOM
-
2026-06-13days on market $134,500 Active 84 DOM
-
2026-06-09remarks 633-char remark
-
2026-06-09days on market $134,500 Active 81 DOM
-
2026-06-08days on market $134,500 Active 80 DOM
-
2026-06-07days on market $134,500 Active 79 DOM
-
2026-06-04days on market $134,500 Active 76 DOM
-
2026-06-03days on market $134,500 Active 75 DOM
-
2026-06-02days on market $134,500 Active 74 DOM
-
2026-06-01pricedays on market $134,500 Active 73 DOM
-
2026-05-31days on market $134,900 Active 72 DOM
-
2026-03-20$134,900 Active
-
2024-03-31historical
-
2024-02-27price
-
2023-12-27Active
-
2023-11-08historical
-
2023-11-08Active
-
2023-06-07historical
-
2023-05-14Active
-
2011-04-17historical
-
2010-04-16New
-
2004-08-27soldstatus $110,000
ⓘ Source: listings_history table (triggers on properties + properties_extension) + one-shot
backfill from property_details.listing_events for pre-trigger history.
Tax reassessment forecast IL · Partial reset (capped growth)
- Current annual tax
- $4,061 · $338/mo
- Projected year-2 tax
- $4,061 · $338/mo
- Expected delta
- $0/yr ($0/mo · 0.0%)
ⓘ Screening estimate from a state-policy table — verify with the county assessor before closing.
Climate risk First Street
- Flood 1/10 Low FEMA zone X (unshaded) · 0% chance over 30 yrs
- Wildfire 1/10 Low
- Heat 3/10 Moderate 7 d/yr ≥102°F today · 15 d/yr by 30 yrs out
- Wind 2/10 Low
- Air quality 4/10 Moderate 4 unhealthy d/yr today · 5 by 30 yrs out
Nearby sold comps map
Loading sold comps map…
Walkable amenities ~0.75 mi
Loading nearby amenities…
Taxation est. · year 1
- Rental income
- $21,375
- − Mortgage interest
- −$7,534
- − Property taxes
- −$4,061
- − Insurance
- −$672
- − Repairs & maintenance
- −$1,710
- − Management
- −$1,710
- − Depreciation
- −$3,913
- Taxable income
- $1,774
- Est. tax owed @ 24.0%
- −$426
- After-tax cash flow
- $3,263/yr
For passive investors: Depreciation is non-cash, so a rental often shows a tax loss while cash-flowing — sheltering income. Rental losses are passive: they offset passive income freely, and up to $25,000/yr can offset ordinary (W-2) income if you actively participate and your MAGI is under $100k (phasing out to $0 by $150k); unused losses carry forward. On sale, claimed depreciation is recaptured at up to 25%, and gains may owe capital-gains tax (a 1031 exchange can defer both). Figures are a year-1 estimate at your 24.0% rate — not tax advice; consult a CPA.
Schools (NCES district)
- District
- Thornton Twp Hsd 205
- NCES district ID
- 1738970
- Math proficiency
- 7% ▬ 0.00%
- Reading proficiency
- 8% ▼ -2.00%
- Median HH income
- $43,392
- Composite
- 6.92/100
- National rank
- #9976
- State rank
- #594 of 620 in IL
Livability — Phoenix
- Score
- 75/100
- State rank
- #230
- US rank
- #4248
Category grades
Schools grade is shown separately in the Schools card above.
Census & demographics
- Census place
- Phoenix, IL
- Population (ZIP)
- 23,066
Population outlook (Cook County) Hauer SSP2
- Today (2025)
- 5,347,519 people
- By 2030
- 5,357,703 · +0.2%
- By 2040
- 5,324,924 · -0.4%
- By 2050
- 5,230,762 · -2.2%
- By 2075
- 4,785,735 · -10.5%
- By 2100
- 4,188,836 · -21.7%
Race, ethnicity, and origin ACS 2023
- Neighborhood character
- Majority Black (59%)
- Race & ethnicity
- Black 59% Hispanic / Latino 33% Two or more races 12% White 3% Asian 2%
- Hispanic origin (detail)
- Mexican 31%
- Foreign-born
- 17% · Canada
- Languages at home
- 67% English-only · Spanish 30% Other Indo-European 2% French/Haitian/Cajun 1%
Political lean MEDSL · Cook
- 2024 margin
- Solid D (+42.0) · D 70.4% · R 28.4% · Other 1.2%
- 2008→2024 swing
- -11.4pp toward R · 2008: 53.4pp · 2024: 42.0pp
- All cycles
- 2024: D+42.0 2020: D+50.3 2016: D+53.0 2012: D+49.4 2008: D+53.4
Not yet ingested
- Civics
- —
Market trends
- HPI YoY
- ▲ 20.36%
- Current HPI
- 313.7895
- Rent YoY
- —
- Metro
- —
- State GDP YoY
- ▲ 1.59%
- F500 in state
- 60
Industry mix (Fortune 500 HQ in IL)
| Industry | F500 HQs | Revenue |
|---|---|---|
| Insurance | 4 | $201B |
|
||
| Consumer Goods | 4 | $87B |
|
||
| Industrial Machinery | 3 | $64B |
|
||
| Healthcare | 2 | $55B |
|
||
| Retail / Pharmacy | 1 | $148B |
|
||
| Agriculture / Food | 1 | $86B |
|
||
Price history
+22.6% since first listed11 events — show timeline
- 2026-03-20 Listed $134,900 MRED as Distributed by MLS Grid
- 2024-03-31 Listing Removed — MRED as Distributed by MLS Grid
- 2024-02-27 Price Changed — MRED as Distributed by MLS Grid
- 2023-12-27 Listed — MRED as Distributed by MLS Grid
- 2023-11-08 Listed — MRED as Distributed by MLS Grid
- 2023-11-08 Listing Removed — MRED as Distributed by MLS Grid
- 2023-06-07 Listing Removed — MRED as Distributed by MLS Grid
- 2023-05-14 Listed — MRED as Distributed by MLS Grid
- 2011-04-17 Listing Removed — MRED as Distributed by MLS Grid
- 2010-04-16 Listed — MRED as Distributed by MLS Grid
- 2004-08-27 Sold (Public Records) $110,000 Public Records
Property tax history
+3.3%/yrLatest (2023): $4,061 · +25.9% YoY. Source: county tax records.
Cash-flow waterfall
monthlySold comps — $/sqft
last 12 mo · ≤1 miLoading sold comps…