 Duplex
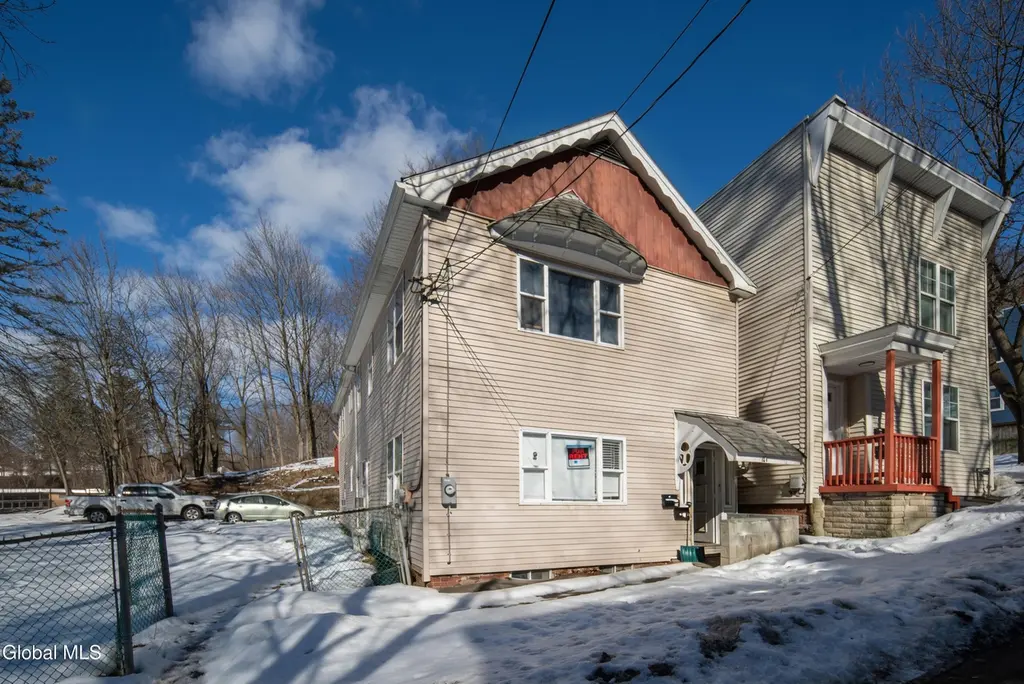
61 Tyler St · Troy, NY
Flood risk 8/10 · Major
- FEMA flood zone
- X
- Chance of flooding over 30 yrs
- 0.78%
- Est. flood insurance / yr
- $473 – $860
Fire risk 2/10 · Minimal
- Est. fire insurance / yr
- $691 – $1,283
Heat risk 4/10 · Minor
- Hot days now (above 96°F)
- 7 days/yr
- Hot days in 30 yrs
- 16 days/yr
Wind risk 3/10 · Minor
- Chance of severe wind over 30 yrs
- 6.0%
Air-quality risk 2/10 · Minimal
- Unhealthy air days now
- 0 days/yr
- Unhealthy air days in 30 yrs
- 1 days/yr
Risk factors via First Street. Map © Google.
Why this score? — see what drove the B+ grade
The composite is a weighted blend of 9 inputs, each scored 0–100. Each bar is that input's sub-score; the figure is the points it added to the 100-point composite (weight × sub-score).
- Cash flow +29.8/30.0
- ARV discount +15.0/15.0
- DSCR +10.0/10.0
- 1% rule +8.6/10.0
- Livability +4.0/5.0
- Schools +3.8/10.0
- Rent growth +3.7/5.0
- Condition / age +2.5/5.0
- Appreciation +0.0/10.0
$249,900
🖨 Deal sheet 📄 Offer letter ✓ Due diligence
Multi-family units
County records classify this as Multi-Family (2-4 Unit). Listing-text estimate: 2 units. confirmed
Listing remarks MLS
Well-maintained two-family property in the heart of Troy offering modern updates and strong rental potential. The first-floor unit features 2 bedrooms and a fully updated kitchen, complemented by efficient split-system air conditioning for year-round comfort. The second-floor unit offers 3 spacious bedrooms and a bright living room with a stunning cathedral ceiling, creating an open and airy feel. SELLING AS IS. The property is offered in as-is condition. Any inspections conducted are for informational purposes only. Seller will not make repairs or offer credits
Key facts
- 3,049 sq ft lot
- 2 parking spots
- Built 1910
Neighborhood map
What this means for you Summary
Snapshot
- This is a 1×2bd/1.0ba + 1×3bd/1.0ba units multifamily listed at $250k.
Deal economics
- At list price, monthly cash flow is $862 ($10k/yr) — positive. Per door: $431/mo.
- The deal already cash-flows at list — no discount required.
- Meets the 1% rule at list price ($3k rent vs $250k).
- Recommended offer: $242k (3.0% below list) — sets the bar for market timing.
- Cap rate 10.7% vs local median 5.3% in Troy — top-decile yield for the area; either an underpriced asset or a hidden risk that comps aren't pricing in. Stress-test before assuming the spread holds.
Location & tenants
- Location reads 81/100 on livability (#88 in NY, #1,350 nationally) — a professional / high-income tenant draw. Strengths: amenities A+, commute A+, housing A+; Watch: schools C-, employment C-, crime F.
- Troy City School District (urban): math 44% / reading 46% proficiency, ranked #467 of 590 in NY (top 79%) — families likely to look elsewhere, expect single-tenant / working-renter base with shorter leases; 62% free/reduced lunch — lower-income household profile, screen leases tightly.
- Market conditions: Rents rising fast (+4.9%/yr); 220 active listings in the ZIP; 5 comparable units currently listed for rent nearby; rentals at typical pace (median 19d on market — plan ~3-4 weeks tenant-placement turnaround); solid renter incomes; 405 units permitted in Rensselaer County in 2024 (224 in 5+ unit buildings).
- At $3,395/mo this rent would consume 54% of the median local household income ($76k/yr) (locally 2698% of renters already pay >50% of income on rent) — very limited rent-growth headroom before tenants either downsize or default.
Forward outlook
- Local home prices are declining (-3.0%/yr); year-one equity from $2k of loan paydown is wiped out by about $7k of value loss. Plan a longer hold.
- Rensselaer County population projected to shrink 6% by 2050 — rents likely to lag national; underwrite the cash flow, not the appreciation.
- At projected returns (-3.0% appreciation + 4.9% rent growth), your $70k cash investment doubles in ~7 years — after that, you're playing with house money.
Negotiation context
- It's been on market 39 days — a 3% lower offer ($242k) is reasonable based on typical stale-listing flexibility.
- 7 sale attempts since 23y ago with the ask held roughly flat each time — persistent listings suggest the price (not the market) is what's stuck; bring a comps-based counter.
- Current owner paid $15k; list at $250k implies a 1566% gain — meaningful room to come down on a strong offer.
Risks & watch-outs
- Watch-outs: flood insurance adds $56/mo; built in 1910 — expect roof / HVAC / electrical / plumbing capex.
- Climate carrying-cost: severe flood risk — expect insurance premiums to compound above CPI over the hold.
Questions for the listing agent
- It's been on market 39 days. Have you received any prior offers? Is the seller open to a 3% concession, seller financing, or rate buy-down credit?
- Can we see the unit-by-unit rent roll, current vacancy, and any below-market leases? What's the average tenancy length?
- What capital expenditures (roof, boiler, parking lot, exteriors) have been made in the last 5 years, and what's planned in the next 2?
- Built in 1910 — when were the roof, HVAC, electrical panel, plumbing, and water heater last replaced?
- What's the actual annual flood-insurance premium (NFIP or private), and is the property in a SFHA with mandatory coverage?
- Is there a deadline driving the sale (1031 exchange, divorce, estate, relocation)? That informs how much negotiation room exists.
- Crime grade is F in this area — have there been break-ins, vandalism, or insurance claims at this property in the last 3 years? What carrier currently insures it and at what premium?
- What's the average days-on-market for RENTAL listings here right now (not sales)? A rising rental-DOM trend means longer vacancies and softer asking-rent achievability than the comps imply.
- What's the recent tenant-quality profile in this submarket — average credit score on applications, eviction rate, late-payment / NSF rate, and stable-employment percentage? A property-management company in the area should have these aggregated.
- How much new apartment / multifamily construction is in the pipeline within 1–3 miles? Heavy new supply (>2% of stock underway) typically softens rents 12–24 months out; light construction supports rent growth.
Investment metrics
- 1% rule
- 1.36% ✓
- Cap rate
- 10.70%
- Cash-on-cash
- 15.74%
- DSCR
- 1.70
- GRM
- 6.1
CMA / ARV
- ARV (median comp)
- $300,925
- List price
- $249,900
- Delta
- -16.96%
- Verdict
- UNDERPRICED
- Comps
- 20 within 1.0 mi
Show comp detail 12 sales within ~0.75 mi
| Address | Dist | Beds/Ba | Sqft | Sold | Price | $/sf | Match |
|---|---|---|---|---|---|---|---|
| 462 1st St | 0.20mi | 6/2.0 (+1) | 2,376 (+2%) | 9mo | $319,500 | $134 | 75 |
| 542 1st St | 0.18mi | 6/2.0 (+1) | 2,300 (-1%) | 13mo | $197,000 | $86 | 74 |
| 508 2nd St | 0.14mi | 6/2.0 (+1) | 2,244 (-4%) | 11mo | $230,000 | $102 | 73 |
| 527 2nd Street St | 0.15mi | 5/3.0 | 2,464 (+6%) | 8mo | $160,000 | $65 | 73 |
| 412 2nd St | 0.33mi | 6/2.0 (+1) | 2,256 (-3%) | 2mo | $240,000 | $106 | 73 |
| 632 4th St | 0.13mi | 5/3.0 | 2,205 (-5%) | 12mo | $210,000 | $95 | 71 |
| 21 Lincoln Ave | 0.14mi | 4/2.0 (-1) | 2,142 (-8%) | 6mo | $115,000 | $54 | 70 |
| 369 4th St | 0.58mi | 5/2.0 | 2,222 (-5%) | 8mo | $192,000 | $86 | 59 |
| 30 Sheridan Ave | 0.72mi | 5/2.0 | 2,400 (+3%) | 8mo | $285,000 | $119 | 54 |
| 329 4th St | 0.71mi | 5/2.0 | 2,266 (-3%) | 10mo | $330,000 | $146 | 54 |
| 31 Sheridan Ave | 0.70mi | 4/2.0 (-1) | 2,202 (-6%) | 6mo | $160,000 | $73 | 48 |
| 358 1st St | 0.43mi | 6/2.0 (+1) | 2,024 (-13%) | 10mo | $160,000 | $79 | 44 |
Match score weights: distance 35% · size 25% · config 20% · recency 20%. Top-matched comps best support the ARV.
Projected returns pro-forma
-3.0% appreciation · 4.88% rent growth · sell at horizon
- IRR
- 7.5%
- Equity multiple
- 1.30×
- Total profit
- $21,076
- Equity at exit
- $37,261
- IRR
- 18.5%
- Equity multiple
- 2.68×
- Total profit
- $117,409
- Equity at exit
- $21,607
Cash invested: $69,972 (down + closing). Projections, not guarantees.
Landlord ↔ Tenant lean methodology
- Overall (STATE)
- 15 Strongly Tenant-Friendly
- State New York
- 15 Strongly Tenant-Friendly · D+10
- County
- — inherits STATE
- City
- — inherits STATE
ZIP-level market 12180
- Home prices YoY
- -33.3%
- Rents YoY
- 4.9%
- Active inventory
- 220
- Price-to-rent
- 12.8×
Monthly cashflow live
- Estimated rent
- $3,395 high interval (Pro) →
- Mortgage (P&I)
- −$1,311
- Tax from tax record
- −$350 /mo · $4,195/yr
- Insurance
- −$104
- Flood insurance flood zone
- −$56 /mo · $666/yr
- HOA
- −$0
- Vacancy / Maint / Mgmt
- −$713
- Net cashflow
- $862
Break-even live
2-unit breakdown (identical units grouped — click to expand)
| Units | Beds | Baths | Est. rent |
|---|---|---|---|
| 1× unit | 2 | 1 | $1,630 |
| 1× unit | 3 | 1 | $1,765 |
| Total (2 units) | $3,395 | ||
UW: 25.0% down · 7.5% · 30yr · 1.5% tax · 5.0% vac · 8.0% maint · 8.0% mgmt
Financing live
Cash to close
- Down payment
- $62,475
- Closing costs
- $7,497
- Reserves months
- —
- Total cash needed
- —
Loan-product check · same deal, 3 products live
Conventional
25% down · 7.5% · 30yr
- Down + closing
- —
- Monthly P&I
- —
- Monthly cashflow
- —
- DSCR
- —
- Eligible?
- —
Personal DTI + credit; lowest rate.
DSCR
20% down · 8.5% · 30yr
- Down + closing
- —
- Monthly P&I
- —
- Monthly cashflow
- —
- DSCR
- —
- Eligible?
- —
No personal income docs; deal must DSCR.
Hard money
10% down · 12.0% · 12mo
- Down + closing
- —
- Monthly P&I
- —
- Monthly cashflow
- —
- DSCR
- —
- Eligible?
- —
Short-term bridge; refi at stabilization.
Rent comps 5 comps
| Address | Beds | Baths | Sqft | Rent | $/sqft | DOM | Units | Dist |
|---|---|---|---|---|---|---|---|---|
| 150 2nd St Troy, NY | 4.0 | 1.5 | 2442 | $3,000 | $1.23 | 21d | 1 | 1.04mi |
| 51 14th St Unit 2 Troy, NY | 4.0 | 2.0 | 2000 | $725 | $0.36 | 19d | 1 | 1.21mi |
| 97 14th St Unit 2 Troy, NY | 5.0 | 2.0 | 1600 | $625 | $0.39 | 19d | 1 | 1.31mi |
| 17 State St Troy, NY | 4.0 | 1.0–1.5 | 1810 | $3,635 | $2.01 | 14d | 7 | 1.34mi |
| 1820 Highland Ave Unit 2 Troy, NY | 4.0 | 2.0 | 1680 | $725 | $0.43 | 19d | 1 | 1.37mi |
Listing history 15 events
-
2026-04-14$249,900 Active 568-char remark
Show marketing remark (568 chars)
Well-maintained two-family property in the heart of Troy offering modern updates and strong rental potential. The first-floor unit features 2 bedrooms and a fully updated kitchen, complemented by efficient split-system air conditioning for year-round comfort. The second-floor unit offers 3 spacious bedrooms and a bright living room with a stunning cathedral ceiling, creating an open and airy feel. SELLING AS IS. The property is offered in as-is condition. Any inspections conducted are for informational purposes only. Seller will not make repairs or offer credits
-
2025-11-04historical
-
2025-07-31status Active
-
2025-07-22historical
-
2025-01-22status Active
-
2025-01-22historical
-
2024-07-26status Active
-
2024-07-22historical
-
2024-02-08status Active
-
2024-02-06historical
-
2024-01-22$249,000 Active
-
2003-06-17soldstatus $15,000
-
2003-06-16soldstatus $15,000
-
2003-04-15historical
-
2003-04-10$11,000
ⓘ Source: listings_history table (triggers on properties + properties_extension) + one-shot
backfill from property_details.listing_events for pre-trigger history.
Tax reassessment forecast NY · Partial reset (capped growth)
- Current annual tax
- $4,195 · $350/mo
- Projected year-2 tax
- $4,209 · $351/mo
- Expected delta
- +$14/yr (+$1/mo · 0.3%)
ⓘ Screening estimate from a state-policy table — verify with the county assessor before closing.
Climate risk First Street
- Flood 8/10 Severe FEMA zone X · 78% chance over 30 yrs
- Wildfire 2/10 Low
- Heat 4/10 Moderate 7 d/yr ≥96°F today · 16 d/yr by 30 yrs out
- Wind 3/10 Moderate 6% chance of damaging wind over 30 yrs
- Air quality 2/10 Low 0 unhealthy d/yr today · 1 by 30 yrs out
Nearby sold comps map
Loading sold comps map…
Walkable amenities ~0.75 mi
Loading nearby amenities…
Taxation est. · year 1
- Rental income
- $40,740
- − Mortgage interest
- −$13,998
- − Property taxes
- −$4,195
- − Insurance
- −$1,916
- − Repairs & maintenance
- −$3,259
- − Management
- −$3,259
- − Depreciation
- −$7,270
- Taxable income
- $6,843
- Est. tax owed @ 24.0%
- −$1,642
- After-tax cash flow
- $8,705/yr
For passive investors: Depreciation is non-cash, so a rental often shows a tax loss while cash-flowing — sheltering income. Rental losses are passive: they offset passive income freely, and up to $25,000/yr can offset ordinary (W-2) income if you actively participate and your MAGI is under $100k (phasing out to $0 by $150k); unused losses carry forward. On sale, claimed depreciation is recaptured at up to 25%, and gains may owe capital-gains tax (a 1031 exchange can defer both). Figures are a year-1 estimate at your 24.0% rate — not tax advice; consult a CPA.
Schools (NCES district)
- District
- Troy City School District
- NCES district ID
- 3628950
- Math proficiency
- 44% ▲ 6.00%
- Reading proficiency
- 46% ▲ 6.00%
- Median HH income
- $42,143
- Composite
- 37.89/100
- National rank
- #4318
- State rank
- #467 of 590 in NY
Livability — Troy
- Score
- 81/100
- State rank
- #88
- US rank
- #1350
Category grades
Schools grade is shown separately in the Schools card above.
Census & demographics
- Census place
- Troy, NY
- County
- Rensselaer County · 75,590 people
- City population
- 53,479
- Metro
- Albany-Schenectady-Troy, NY
- Population (ZIP)
- 53,479
- Household income
- $75,851
- Rent vs Own
- Severe rent burden
- 2698.0
Population outlook (Rensselaer County) Hauer SSP2
- Today (2025)
- 162,400 people
- By 2030
- 161,746 · -0.4%
- By 2040
- 158,095 · -2.7%
- By 2050
- 152,966 · -5.8%
- By 2075
- 140,767 · -13.3%
- By 2100
- 124,727 · -23.2%
Race, ethnicity, and origin ACS 2023
- Neighborhood character
- Predominantly White (70%)
- Race & ethnicity
- White 70% Black 12% Hispanic / Latino 8% Two or more races 8% Asian 5%
- Hispanic origin (detail)
- Mexican 1% Puerto Rican 4%
- Common ancestry
- Romanian 5% Lithuanian 5% Slovak 1%
- Foreign-born
- 10% · Canada, China
- Languages at home
- 88% English-only · Spanish 4% Other Indo-European 2% Arabic 2%
Political lean MEDSL · Rensselaer
- 2024 margin
- Toss-up / Even · D 50.7% · R 49.3%
- 2008→2024 swing
- -8.0pp toward R · 2008: 9.3pp · 2024: 1.4pp
- All cycles
- 2024: D+1.4 2020: D+5.6 2016: R+2.9 2012: D+11.8 2008: D+9.3
Not yet ingested
- Civics
- —
Market trends
- HPI YoY
- ▼ -142.53%
- Current HPI
- 285.0762
- Rent YoY
- ▲ 4.88%
- Metro
- Albany-Schenectady-Troy, NY
- State GDP YoY
- ▲ 2.60%
- F500 in state
- 92
Industry mix (Fortune 500 HQ in NY)
| Industry | F500 HQs | Revenue |
|---|---|---|
| Financial Services | 10 | $950B |
|
||
| Consumer Goods | 9 | $162B |
|
||
| Insurance | 4 | $225B |
|
||
| Telecommunications | 2 | $144B |
|
||
| Pharmaceuticals | 2 | $112B |
|
||
| Media / Entertainment | 2 | $69B |
|
||
Price history
+2171.8% since first listed15 events — show timeline
- 2026-04-14 Listed $249,900 Global MLS
- 2025-11-04 Listing Removed — Global MLS
- 2025-07-31 Relisted — Global MLS
- 2025-07-22 Listing Removed — Global MLS
- 2025-01-22 Relisted — Global MLS
- 2025-01-22 Listing Removed — Global MLS
- 2024-07-26 Relisted — Global MLS
- 2024-07-22 Listing Removed — Global MLS
- 2024-02-08 Relisted — Global MLS
- 2024-02-06 Listing Removed — Global MLS
- 2024-01-22 Listed $249,000 Global MLS
- 2003-06-17 Sold (Public Records) $15,000 Public Records
- 2003-06-16 Sold (MLS) $15,000 Global MLS
- 2003-04-15 Listing Removed — Global MLS
- 2003-04-10 Listed $11,000 Global MLS
Property tax history
+16.5%/yrLatest (2025): $4,195 · +20.5% YoY. Source: county tax records.
Cash-flow waterfall
monthlySold comps — $/sqft
last 12 mo · ≤1 miLoading sold comps…