45351 Puma Dr · Hammond, LA
Flood risk 4/10 · Minor
- FEMA flood zone
- X (shaded)
- Chance of flooding over 30 yrs
- 0.22%
- Est. flood insurance / yr
- $507 – $1,088
Fire risk 5/10 · Moderate
- Est. fire insurance / yr
- $1,269 – $2,357
Heat risk 8/10 · Major
- Hot days now (above 109°F)
- 7 days/yr
- Hot days in 30 yrs
- 21 days/yr
Wind risk 9/10 · Severe
- Chance of severe wind over 30 yrs
- 99.0%
Air-quality risk 2/10 · Minimal
- Unhealthy air days now
- 0 days/yr
- Unhealthy air days in 30 yrs
- 1 days/yr
Risk factors via First Street. Map © Google.
Why this score? — see what drove the B- grade
The composite is a weighted blend of 9 inputs, each scored 0–100. Each bar is that input's sub-score; the figure is the points it added to the 100-point composite (weight × sub-score).
- Cash flow +30.0/30.0
- 1% rule +10.0/10.0
- DSCR +10.0/10.0
- ARV discount +7.5/15.0
- Livability +3.5/5.0
- Rent growth +2.5/5.0
- Condition / age +2.5/5.0
- Schools +2.0/10.0
- Appreciation +0.0/10.0
$59,900
🖨 Deal sheet 📄 Offer letter ✓ Due diligence
Listing remarks MLS
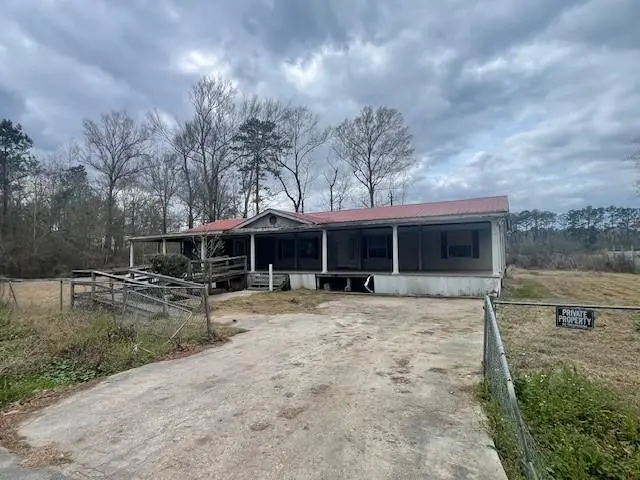
2002 Fleetwood Double Wide Mobile Home with Large Front Porch on Large Fenced Lot located at the end of Puma Drive. Conveniently located to Interstate 12 & 55. Located only minutes from University of SLU. Needs some TLC, but Lots of possibilities for the Price. >>> Call us today for your own Private Tour. (This home is in a First Look for the 1st 8 days of listing)
Key facts
- 0.52 acre lot
- Parking
- Built 2002
Neighborhood map
What this means for you Summary
Snapshot
- This is a 4-bed/2.0-bath single-family listed at $60k.
Deal economics
- At list price, monthly cash flow is $971 ($12k/yr) — positive.
- The deal already cash-flows at list — no discount required.
- Meets the 1% rule at list price ($2k rent vs $60k).
- Recommended offer: $55k (9.0% below list) — sets the bar for market timing.
- Cap rate 25.7% vs local median 5.0% in Hammond — top-decile yield for the area; either an underpriced asset or a hidden risk that comps aren't pricing in. Stress-test before assuming the spread holds.
Location & tenants
- Location reads 69/100 on livability (#77 in LA) — a middle-class / working-renter tenant base. Strengths: cost of living A+, health & safety A+; Watch: amenities C-, commute D+, schools D.
- Tangipahoa Parish (rural): math 18% / reading 29% proficiency, ranked #63 of 98 in LA (top 64%) — low school quality limits family demand, transient renter base, plan for 1-2y turnover; 73% free/reduced lunch — lower-income household profile, screen leases tightly.
- Market conditions: Rents flat; 220 active listings in the ZIP; 2 comparable units currently listed for rent nearby; 1,085 units permitted in Tangipahoa Parish in 2024 (378 in 5+ unit buildings).
- This rent runs 41% of the median local income ($51k/yr) — at the standard rent-burdened threshold; future hikes will face affordability resistance.
Forward outlook
- Local home prices are declining (-3.0%/yr); year-one equity from $414 of loan paydown is wiped out by about $2k of value loss. Plan a longer hold.
- Tangipahoa County population projected at +22% by 2050 — long-run rental-demand tailwind backs the buy-and-hold thesis.
- At projected returns (-3.0% appreciation + 0.1% rent growth), your $17k cash investment doubles in ~2 years — after that, you're playing with house money.
Negotiation context
- It's been on market 114 days — a 9% lower offer ($55k) is reasonable based on typical stale-listing flexibility.
- 2 sale attempts; this cycle's ask has dropped $20k (25%) from the opening price — seller is motivated, your offer sets the floor, not the list.
- Current owner paid $4k; list at $60k implies a 1398% gain — meaningful room to come down on a strong offer.
Risks & watch-outs
- Climate carrying-cost: severe wind risk, 99% chance of damaging wind over 30y; moderate wildfire risk; extreme-heat days projected 7→21/yr by 2055 (HVAC capex compounding) — expect insurance premiums to compound above CPI over the hold.
Questions for the listing agent
- It's been on market 114 days. Have you received any prior offers? Is the seller open to a 9% concession, seller financing, or rate buy-down credit?
- Why hasn't it sold? Are there any deal-killer items the seller is aware of (foundation, flood, title, zoning, code violations)?
- Is there a deadline driving the sale (1031 exchange, divorce, estate, relocation)? That informs how much negotiation room exists.
- Schools are D-rated, which usually means shorter tenancies and higher turnover. Who's the typical renter profile here, and what's been the actual vacancy rate?
- Crime grade is F in this area — have there been break-ins, vandalism, or insurance claims at this property in the last 3 years? What carrier currently insures it and at what premium?
- What's the average days-on-market for RENTAL listings here right now (not sales)? A rising rental-DOM trend means longer vacancies and softer asking-rent achievability than the comps imply.
- What's the recent tenant-quality profile in this submarket — average credit score on applications, eviction rate, late-payment / NSF rate, and stable-employment percentage? A property-management company in the area should have these aggregated.
- How much new for-sale + rental construction is in the pipeline within 1–3 miles? Heavy new supply typically softens prices + rents 12–24 months out; constrained supply supports both.
Investment metrics
- 1% rule
- 2.92% ✓
- Cap rate
- 25.75%
- Cash-on-cash
- 69.48%
- DSCR
- 4.09
- GRM
- 2.9
CMA / ARV
- ARV (median comp)
- $241,330
- List price
- $59,900
- Delta
- -75.18%
- Verdict
- UNDERPRICED
- Comps
- 20 within 1.0 mi
Show comp detail 2 sales within ~0.75 mi
| Address | Dist | Beds/Ba | Sqft | Sold | Price | $/sf | Match |
|---|---|---|---|---|---|---|---|
| 13122 Cannino Rd | 0.43mi | 3/2.0 (-1) | 2,462 (+10%) | 14mo | $255,000 | $104 | 46 |
| 2113 Cherie Dr | 0.74mi | 3/2.5 (-1) | 1,969 (-12%) | 7mo | $209,000 | $106 | 32 |
Match score weights: distance 35% · size 25% · config 20% · recency 20%. Top-matched comps best support the ARV.
Projected returns pro-forma
-3.0% appreciation · 0.06% rent growth · sell at horizon
- IRR
- 65.6%
- Equity multiple
- 3.81×
- Total profit
- $47,148
- Equity at exit
- $8,931
- IRR
- 69.0%
- Equity multiple
- 7.04×
- Total profit
- $101,364
- Equity at exit
- $5,179
Cash invested: $16,772 (down + closing). Projections, not guarantees.
Landlord ↔ Tenant lean methodology
- Overall (STATE)
- 90 Strongly Landlord-Friendly
- State Louisiana
- 90 Strongly Landlord-Friendly · R+12
- County
- — inherits STATE
- City
- — inherits STATE
ZIP-level market 70401
- Rents YoY
- 0.1%
- Active inventory
- 220
- Price-to-rent
- 2.9×
Monthly cashflow live
- Estimated rent
- $1,748 medium interval (Pro) →
- Mortgage (P&I)
- −$314
- Tax from tax record
- −$71 /mo · $846/yr
- Insurance
- −$25
- HOA
- −$0
- Vacancy / Maint / Mgmt
- −$367
- Net cashflow
- $971
Break-even live
UW: 25.0% down · 7.5% · 30yr · 1.5% tax · 5.0% vac · 8.0% maint · 8.0% mgmt
Financing live
Cash to close
- Down payment
- $14,975
- Closing costs
- $1,797
- Reserves months
- —
- Total cash needed
- —
Loan-product check · same deal, 3 products live
Conventional
25% down · 7.5% · 30yr
- Down + closing
- —
- Monthly P&I
- —
- Monthly cashflow
- —
- DSCR
- —
- Eligible?
- —
Personal DTI + credit; lowest rate.
DSCR
20% down · 8.5% · 30yr
- Down + closing
- —
- Monthly P&I
- —
- Monthly cashflow
- —
- DSCR
- —
- Eligible?
- —
No personal income docs; deal must DSCR.
Hard money
10% down · 12.0% · 12mo
- Down + closing
- —
- Monthly P&I
- —
- Monthly cashflow
- —
- DSCR
- —
- Eligible?
- —
Short-term bridge; refi at stabilization.
Rent comps 2 comps
| Address | Beds | Baths | Sqft | Rent | $/sqft | DOM | Units | Dist |
|---|---|---|---|---|---|---|---|---|
| 112 Florence Dr Hammond, LA | 4.0 | 2.0 | 1793 | $1,750 | $0.98 | 43d | 1 | 1.29mi |
| 1211 Western Ave Hammond, LA | 4.0 | 2.0 | 1400 | $1,600 | $1.14 | 43d | 1 | 1.41mi |
Listing history 24 events
-
2026-06-19days on market $59,900 Active 114 DOM
-
2026-06-18days on market $59,900 Active 113 DOM
-
2026-06-17days on market $59,900 Active 112 DOM
-
2026-06-16days on market $59,900 Active 111 DOM
-
2026-06-15days on market $59,900 Active 110 DOM
-
2026-06-14days on market $59,900 Active 108 DOM
-
2026-06-13days on market $59,900 Active 107 DOM
-
2026-06-10days on market $59,900 Active 105 DOM
-
2026-06-09days on market $59,900 Active 104 DOM
-
2026-06-08days on market $59,900 Active 103 DOM
-
2026-06-07days on market $59,900 Active 102 DOM
-
2026-06-05days on market $59,900 Active 99 DOM
-
2026-06-03days on market $59,900 Active 98 DOM
-
2026-06-02days on market $59,900 Active 97 DOM
-
2026-06-01days on market $59,900 Active 96 DOM
-
2026-05-31days on market $59,900 Active 95 DOM
-
2026-05-30days on market $59,900 Active 94 DOM
-
2026-05-19price $59,900 380-char remark
Show marketing remark (383 chars)
2002 Fleetwood Double Wide Mobile Home with Large Front Porch on Large Fenced Lot located at the end of Puma Drive. Conveniently located to Interstate 12 & 55. Located only minutes from University of SLU. Needs some TLC, but Lots of possibilities for the Price. >>> Call us today for your own Private Tour. (This home is in a First Look for the 1st 8 days of listing)
-
2026-05-19price $59,900 383-char remark
Show marketing remark (383 chars)
2002 Fleetwood Double Wide Mobile Home with Large Front Porch on Large Fenced Lot located at the end of Puma Drive. Conveniently located to Interstate 12 & 55. Located only minutes from University of SLU. Needs some TLC, but Lots of possibilities for the Price. >>> Call us today for your own Private Tour. (This home is in a First Look for the 1st 8 days of listing)
-
2026-04-20price $69,900 380-char remark
Show marketing remark (383 chars)
2002 Fleetwood Double Wide Mobile Home with Large Front Porch on Large Fenced Lot located at the end of Puma Drive. Conveniently located to Interstate 12 & 55. Located only minutes from University of SLU. Needs some TLC, but Lots of possibilities for the Price. >>> Call us today for your own Private Tour. (This home is in a First Look for the 1st 8 days of listing)
-
2026-04-20price $69,900 383-char remark
Show marketing remark (383 chars)
2002 Fleetwood Double Wide Mobile Home with Large Front Porch on Large Fenced Lot located at the end of Puma Drive. Conveniently located to Interstate 12 & 55. Located only minutes from University of SLU. Needs some TLC, but Lots of possibilities for the Price. >>> Call us today for your own Private Tour. (This home is in a First Look for the 1st 8 days of listing)
-
2026-02-24$79,900 Active 380-char remark
Show marketing remark (383 chars)
2002 Fleetwood Double Wide Mobile Home with Large Front Porch on Large Fenced Lot located at the end of Puma Drive. Conveniently located to Interstate 12 & 55. Located only minutes from University of SLU. Needs some TLC, but Lots of possibilities for the Price. >>> Call us today for your own Private Tour. (This home is in a First Look for the 1st 8 days of listing)
-
2026-02-24$79,900 Active 383-char remark
Show marketing remark (383 chars)
2002 Fleetwood Double Wide Mobile Home with Large Front Porch on Large Fenced Lot located at the end of Puma Drive. Conveniently located to Interstate 12 & 55. Located only minutes from University of SLU. Needs some TLC, but Lots of possibilities for the Price. >>> Call us today for your own Private Tour. (This home is in a First Look for the 1st 8 days of listing)
-
1993-02-25soldstatus $4,000
ⓘ Source: listings_history table (triggers on properties + properties_extension) + one-shot
backfill from property_details.listing_events for pre-trigger history.
Tax reassessment forecast LA · Resets to sale price
- Current annual tax
- $846 · $71/mo
- Projected year-2 tax
- $846 · $71/mo
- Expected delta
- $0/yr ($0/mo · 0.0%)
ⓘ Screening estimate from a state-policy table — verify with the county assessor before closing.
Climate risk First Street
- Flood 4/10 Moderate FEMA zone X (shaded) · 22% chance over 30 yrs
- Wildfire 5/10 Major
- Heat 8/10 Severe 7 d/yr ≥109°F today · 21 d/yr by 30 yrs out
- Wind 9/10 Extreme 99% chance of damaging wind over 30 yrs
- Air quality 2/10 Low 0 unhealthy d/yr today · 1 by 30 yrs out
Nearby sold comps map
Loading sold comps map…
Walkable amenities ~0.75 mi
Loading nearby amenities…
Taxation est. · year 1
- Rental income
- $20,973
- − Mortgage interest
- −$3,355
- − Property taxes
- −$846
- − Insurance
- −$300
- − Repairs & maintenance
- −$1,678
- − Management
- −$1,678
- − Depreciation
- −$1,743
- Taxable income
- $11,374
- Est. tax owed @ 24.0%
- −$2,730
- After-tax cash flow
- $8,924/yr
For passive investors: Depreciation is non-cash, so a rental often shows a tax loss while cash-flowing — sheltering income. Rental losses are passive: they offset passive income freely, and up to $25,000/yr can offset ordinary (W-2) income if you actively participate and your MAGI is under $100k (phasing out to $0 by $150k); unused losses carry forward. On sale, claimed depreciation is recaptured at up to 25%, and gains may owe capital-gains tax (a 1031 exchange can defer both). Figures are a year-1 estimate at your 24.0% rate — not tax advice; consult a CPA.
Schools (NCES district)
- District
- Tangipahoa Parish
- NCES district ID
- 2201680
- Math proficiency
- 18% ▼ -32.00%
- Reading proficiency
- 29% ▼ -31.00%
- Median HH income
- $41,283
- Composite
- 19.94/100
- National rank
- #8676
- State rank
- #63 of 98 in LA
Livability — Hammond
- Score
- 69/100
- State rank
- #77
- US rank
- #8868
Category grades
Schools grade is shown separately in the Schools card above.
Census & demographics
- County
- Tangipahoa Parish · 85,958 people
- City population
- 51,394
- Metro
- Hammond, LA
- Population (ZIP)
- 21,221
- Household income
- $50,653
- Rent vs Own
- Severe rent burden
- 1255.0
Population outlook (Tangipahoa County) Hauer SSP2
- Today (2025)
- 144,204 people
- By 2030
- 151,413 · +5.0%
- By 2040
- 164,374 · +14.0%
- By 2050
- 175,427 · +21.7%
- By 2075
- 195,165 · +35.3%
- By 2100
- 201,641 · +39.8%
Race, ethnicity, and origin ACS 2023
- Neighborhood character
- Diverse neighborhood (Simpson 0.57)
- Race & ethnicity
- White 54% Black 36% Two or more races 6% Hispanic / Latino 4%
- Common ancestry
- Lithuanian 6% Slovak 2% Iranian 1%
- Foreign-born
- 2% · Canada
- Languages at home
- 97% English-only · Spanish 2%
Political lean MEDSL · Tangipahoa
- 2024 margin
- Solid R (+37.4) · D 30.6% · R 68.0% · Other 1.3%
- 2008→2024 swing
- -6.5pp toward R · 2008: -30.9pp · 2024: -37.4pp
- All cycles
- 2024: R+37.4 2020: R+32.8 2016: R+32.6 2012: R+27.7 2008: R+30.9
Not yet ingested
- Civics
- —
Market trends
- HPI YoY
- ▼ -77.61%
- Current HPI
- 136.1629
- Rent YoY
- ▲ 0.06%
- Metro
- Hammond, LA
- State GDP YoY
- ▲ 3.29%
- F500 in state
- 10
Industry mix (Fortune 500 HQ in LA)
| Industry | F500 HQs | Revenue |
|---|---|---|
| Telecommunications | 2 | $23B |
|
||
| Utilities | 1 | $12B |
|
||
| Wholesale / Distribution | 1 | $5B |
|
||
| Advertising | 1 | $2B |
|
||
Price history
+1397.5% since first listed7 events — show timeline
- 2026-05-19 Price Changed $59,900 AcadianaMLS
- 2026-05-19 Price Changed $59,900 GSREIN
- 2026-04-20 Price Changed $69,900 AcadianaMLS
- 2026-04-20 Price Changed $69,900 GSREIN
- 2026-02-24 Listed $79,900 GSREIN
- 2026-02-24 Listed $79,900 AcadianaMLS
- 1993-02-25 Sold (Public Records) $4,000 Public Records
Property tax history
+1.0%/yrLatest (2025): $846 · +0.4% YoY. Source: county tax records.
Cash-flow waterfall
monthlySold comps — $/sqft
last 12 mo · ≤1 miLoading sold comps…