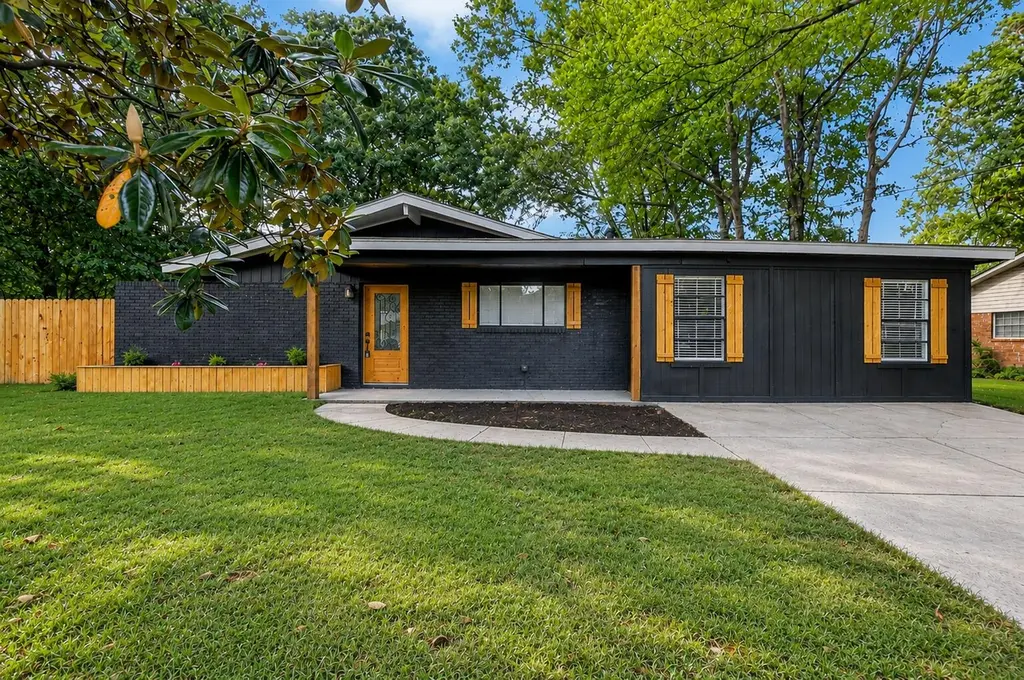
2919 Prince George · Hattiesburg, MS
Flood risk 1/10 · Minimal
- FEMA flood zone
- X (unshaded)
- Chance of flooding over 30 yrs
- 0.0%
- Est. flood insurance / yr
- $507 – $1,088
Fire risk 1/10 · Minimal
- Est. fire insurance / yr
- $1,241 – $2,305
Heat risk 8/10 · Major
- Hot days now (above 107°F)
- 7 days/yr
- Hot days in 30 yrs
- 20 days/yr
Wind risk 8/10 · Major
- Chance of severe wind over 30 yrs
- 99.0%
Air-quality risk 1/10 · Minimal
- Unhealthy air days now
- 0 days/yr
- Unhealthy air days in 30 yrs
- 0 days/yr
Risk factors via First Street. Map © Google.
Why this score? — see what drove the F grade
The composite is a weighted blend of 9 inputs, each scored 0–100. Each bar is that input's sub-score; the figure is the points it added to the 100-point composite (weight × sub-score).
- Cash flow +14.6/30.0
- DSCR +4.4/10.0
- Livability +4.0/5.0
- Rent growth +3.3/5.0
- 1% rule +3.0/10.0
- Condition / age +2.5/5.0
- Schools +2.0/10.0
- ARV discount +0.0/15.0
- Appreciation +0.0/10.0
$214,900
🖨 Deal sheet (PDF) 📄 Offer letter ✓ Due diligence
Listing remarks
Completely refreshed and move-in ready! This spacious 4-bedroom, 2-bath home offers the perfect blend of modern updates and functional living space. Recent improvements include a brand-new roof, new flooring throughout, fresh interior and exterior paint, refinished cabinetry, new countertops, stylish backsplash, and brand-new stainless steel appliances. The versatile floor plan offers flexibility for a fourth bedroom, home office, study, or additional living space to fit your needs. The updated bathrooms feature modern fixtures and finishes, while the generous living areas provide plenty of room for entertaining and everyday living. Outside, you'll find a large backyard with ample space for
Key facts
- Brand new roof
- New flooring
- Refinished cabinetry
Tags
Property features AI
Exterior
- Parking: No designated parking
- Home design: Single-family residence; One story; Located in Jamestown subdivision
- Construction: Brick veneer and wood siding exterior; Slab foundation
- Exterior features: No notable exterior features listed
Interior
- Bathrooms: 2 full bathrooms
- Heating & cooling: Central electric air conditioning
- Interior features: Ceiling fans; Walk-in closet(s)
Neighborhood map
What this means for you Summary
Snapshot
- This is a 4-bed/1.0-bath single-family listed at $215k.
Deal economics
- At list price, monthly cash flow is $50 ($602/yr) — positive.
- The deal already cash-flows at list — no discount required.
- To meet the 1% rule (rent ≥ 1% of price), the offer needs to be $172k (19.9% below list).
- Recommended offer: $172k (19.9% below list) — sets the bar for 1% rule.
- Cap rate 6.6% vs local median 4.0% in Hattiesburg — top-decile yield for the area; either an underpriced asset or a hidden risk that comps aren't pricing in. Stress-test before assuming the spread holds.
Location & tenants
- Location reads 79/100 on livability (#5 in MS, #2,046 nationally) — a middle-class / working-renter tenant base. Strengths: commute A+, cost of living A+, health & safety A+; Watch: schools D+, crime D+, employment F.
- Hattiesburg Public School District (urban): math 25% / reading 26% proficiency, ranked #81 of 130 in MS (top 62%) — low school quality limits family demand, transient renter base, plan for 1-2y turnover; 88% free/reduced lunch — lower-income household profile, screen leases tightly.
- Market conditions: Rents rising (+3.4%/yr); 499 active listings in the ZIP; 4 comparable units currently listed for rent nearby; rentals at typical pace (median 22d on market — plan ~3-4 weeks tenant-placement turnaround); solid renter incomes; 121 units permitted in Forrest County in 2024 (30 in 5+ unit buildings).
Forward outlook
- Local home prices are declining (-3.0%/yr); year-one equity from $1k of loan paydown is wiped out by about $6k of value loss. Plan a longer hold.
- Forrest County population projected at +6% by 2050 — modest demand growth; plan on rents tracking national, not racing it.
Negotiation context
- Only 6 days on market — expect competitive offers; lowballing is unlikely to land.
Risks & watch-outs
- Climate carrying-cost: severe wind risk, 99% chance of damaging wind over 30y; extreme-heat days projected 7→20/yr by 2055 (HVAC capex compounding) — expect insurance premiums to compound above CPI over the hold.
Questions for the listing agent
- Built in 1962 — when were the roof, HVAC, electrical panel, plumbing, and water heater last replaced?
- Is there a deadline driving the sale (1031 exchange, divorce, estate, relocation)? That informs how much negotiation room exists.
- Schools are D-rated, which usually means shorter tenancies and higher turnover. Who's the typical renter profile here, and what's been the actual vacancy rate?
- Crime grade is D in this area — have there been break-ins, vandalism, or insurance claims at this property in the last 3 years? What carrier currently insures it and at what premium?
- The area grade is low — what's the realistic commute time and amenity access for the typical tenant pool here? Any planned neighborhood developments (good or bad) we should know about?
- What's the average days-on-market for RENTAL listings here right now (not sales)? A rising rental-DOM trend means longer vacancies and softer asking-rent achievability than the comps imply.
- What's the recent tenant-quality profile in this submarket — average credit score on applications, eviction rate, late-payment / NSF rate, and stable-employment percentage? A property-management company in the area should have these aggregated.
- How much new for-sale + rental construction is in the pipeline within 1–3 miles? Heavy new supply typically softens prices + rents 12–24 months out; constrained supply supports both.
Investment metrics
- 1% rule
- 0.80% ✗
- Cap rate
- 6.57%
- Cash-on-cash
- 1.00%
- DSCR
- 1.04
- GRM
- 10.4
CMA / ARV
- ARV (on-the-fly)
- $162,656
- Comps found
- 2
Show comp detail 2 sales within ~0.75 mi
| Address | Dist | Beds/Ba | Sqft | Sold | Price | $/sf | Match |
|---|---|---|---|---|---|---|---|
| 2919 Laramie Cir | 0.25mi | 3/1.5 (-1) | 1,211 (+1%) | 7mo | $165,000 | $136 | 73 |
| 1401 S 26th Ave | 0.71mi | 3/1.5 (-1) | 1,200 (+0%) | 4mo | $109,000 | $91 | 56 |
Match score weights: distance 35% · size 25% · config 20% · recency 20%. Top-matched comps best support the ARV.
Projected returns pro-forma
-3.0% appreciation · 3.37% rent growth · sell at horizon
- IRR
- -14.4%
- Equity multiple
- 0.48×
- Total profit
- $-31,066
- Equity at exit
- $32,042
- IRR
- -5.2%
- Equity multiple
- 0.66×
- Total profit
- $-20,613
- Equity at exit
- $18,581
Cash invested: $60,172 (down + closing). Projections, not guarantees.
Landlord ↔ Tenant lean methodology
- Overall (STATE)
- 90 Strongly Landlord-Friendly
- State Mississippi
- 90 Strongly Landlord-Friendly · R+11
- County
- — inherits STATE
- City
- — inherits STATE
ZIP-level market 39402
- Rents YoY
- 3.4%
- Active inventory
- 499
- Price-to-rent
- 10.4×
Monthly cashflow live
- Estimated rent
- $1,721 medium interval (Pro) →
- Mortgage (P&I)
- −$1,127
- Tax from tax record
- −$93 /mo · $1,112/yr
- Insurance
- −$90
- HOA
- −$0
- Vacancy / Maint / Mgmt
- −$361
- Net cashflow
- $50
Break-even live
Sensitivity live
| Price | -10% $172 | -5% $111 | +0% $50 | +5% $-11 | +10% $-71 |
|---|---|---|---|---|---|
| Rent | -10% $-86 | -5% $-18 | +0% $50 | +5% $118 | +10% $186 |
| Rate | -1.0pp $158 | -0.5pp $105 | base $50 | +0.5pp $-6 | +1.0pp $-62 |
UW: 25.0% down · 7.5% · 30yr · 1.5% tax · 5.0% vac · 8.0% maint · 8.0% mgmt
Financing live
Cash to close
- Down payment
- $53,725
- Closing costs
- $6,447
- Reserves months
- —
- Total cash needed
- —
Loan-product check · same deal, 3 products live
Conventional
25% down · 7.5% · 30yr
- Down + closing
- —
- Monthly P&I
- —
- Monthly cashflow
- —
- DSCR
- —
- Eligible?
- —
Personal DTI + credit; lowest rate.
DSCR
20% down · 8.5% · 30yr
- Down + closing
- —
- Monthly P&I
- —
- Monthly cashflow
- —
- DSCR
- —
- Eligible?
- —
No personal income docs; deal must DSCR.
Hard money
10% down · 12.0% · 12mo
- Down + closing
- —
- Monthly P&I
- —
- Monthly cashflow
- —
- DSCR
- —
- Eligible?
- —
Short-term bridge; refi at stabilization.
Rent comps 4 comps
| Address | Beds | Baths | Sqft | Rent | $/sqft | DOM | Units | Dist |
|---|---|---|---|---|---|---|---|---|
| 307 S 23rd Ave Hattiesburg, MS | 3.0 | 2.0 | 1300 | $1,595 | $1.23 | 44d | 1 | 0.94mi |
| 200 Foxgate Ave Hattiesburg, MS | 1.0–3.0 | 1.0–2.0 | 1013 | $1,610 | $1.59 | 21d | 30 | 1.05mi |
| 217 Patton Ave Hattiesburg, MS | 3.0 | 1.0 | 1008 | $1,300 | $1.29 | 21d | 1 | 1.23mi |
| 107 Kimball Ave Hattiesburg, MS | 3.0 | 1.0 | 1500 | $1,375 | $0.92 | 21d | 1 | 1.42mi |
Listing history 8 events
-
2026-06-07statusdays on market $214,900 Pending 6 DOM
-
2026-06-05days on market $214,900 Active 4 DOM
-
2026-06-03days on market $214,900 Active 3 DOM
-
2026-06-02days on market $214,900 Active 2 DOM
-
2026-05-31days on market $214,900 Active 1 DOM
-
2026-05-31days on market $214,900 Active 2 DOM
-
2026-05-29$214,900 Active
-
2026-03-23soldstatus
ⓘ Source: listings_history table (triggers on properties + properties_extension) + one-shot
backfill from property_details.listing_events for pre-trigger history.
Tax reassessment forecast MS · Resets to sale price
- Current annual tax
- $1,112 · $93/mo
- Projected year-2 tax
- $1,698 · $141/mo
- Expected delta
- +$586/yr (+$49/mo · 52.7%)
ⓘ Screening estimate from a state-policy table — verify with the county assessor before closing.
Climate risk First Street
- Flood 1/10 Low FEMA zone X (unshaded) · 0% chance over 30 yrs
- Wildfire 1/10 Low
- Heat 8/10 Severe 7 d/yr ≥107°F today · 20 d/yr by 30 yrs out
- Wind 8/10 Severe 99% chance of damaging wind over 30 yrs
- Air quality 1/10 Low 0 unhealthy d/yr today · 0 by 30 yrs out
Nearby sold comps map
Loading sold comps map…
Walkable amenities ~0.75 mi
Loading nearby amenities…
Taxation est. · year 1
- Rental income
- $20,648
- − Mortgage interest
- −$12,038
- − Property taxes
- −$1,112
- − Insurance
- −$1,074
- − Repairs & maintenance
- −$1,652
- − Management
- −$1,652
- − Depreciation
- −$6,252
- Taxable loss
- −$3,131
- Est. tax savings @ 24.0%
- +$752
- After-tax cash flow
- $1,354/yr
For passive investors: Depreciation is non-cash, so a rental often shows a tax loss while cash-flowing — sheltering income. Rental losses are passive: they offset passive income freely, and up to $25,000/yr can offset ordinary (W-2) income if you actively participate and your MAGI is under $100k (phasing out to $0 by $150k); unused losses carry forward. On sale, claimed depreciation is recaptured at up to 25%, and gains may owe capital-gains tax (a 1031 exchange can defer both). Figures are a year-1 estimate at your 24.0% rate — not tax advice; consult a CPA.
Schools (NCES district)
- District
- Hattiesburg Public School District
- NCES district ID
- 2801800
- Math proficiency
- 25% ▼ -12.00%
- Reading proficiency
- 26% ▼ -6.00%
- Median HH income
- $28,058
- Composite
- 20.38/100
- National rank
- #8595
- State rank
- #81 of 130 in MS
Livability — Hattiesburg
- Score
- 79/100
- State rank
- #5
- US rank
- #2046
Category grades
Schools grade is shown separately in the Schools card above.
Census & demographics
- Census place
- Hattiesburg, MS
- County
- Lamar County · 44,620 people
- City population
- 87,151
- Metro
- Hattiesburg, MS
- Population (ZIP)
- 44,620
- Household income
- $75,220
- Rent vs Own
- Severe rent burden
- 864.0
Population outlook (Forrest County) Hauer SSP2
- Today (2025)
- 79,264 people
- By 2030
- 80,822 · +2.0%
- By 2040
- 82,979 · +4.7%
- By 2050
- 84,324 · +6.4%
- By 2075
- 84,942 · +7.2%
- By 2100
- 80,616 · +1.7%
Race, ethnicity, and origin ACS 2023
- Neighborhood character
- Diverse neighborhood (Simpson 0.56)
- Race & ethnicity
- White 59% Black 30% Hispanic / Latino 7% Two or more races 5% Asian 1%
- Hispanic origin (detail)
- Mexican 3% Puerto Rican 1%
- Common ancestry
- Serbian 4% Slovak 3% Lithuanian 3%
- Foreign-born
- 4% · Canada
- Languages at home
- 94% English-only · Spanish 4%
Political lean MEDSL · Forrest
- 2024 margin
- R (+17.9) · D 40.3% · R 58.2% · Other 1.4%
- 2008→2024 swing
- -4.4pp toward R · 2008: -13.5pp · 2024: -17.9pp
- All cycles
- 2024: R+17.9 2020: R+11.1 2016: R+14.2 2012: R+11.7 2008: R+13.5
Not yet ingested
- Civics
- —
Market trends
- HPI YoY
- ▼ -130.41%
- Current HPI
- 163.5142
- Rent YoY
- ▲ 3.37%
- Metro
- Hattiesburg, MS
- State GDP YoY
- —
- F500 in state
- 0
Price history
2 events — show timeline
- 2026-05-29 Listed $214,900 HAAR
- 2026-03-23 Sold (Public Records) — Public Records
Property tax history
+3.0%/yrLatest (2025): $1,112 · +17.3% YoY. Source: county tax records.
Cash-flow waterfall
monthlySold comps — $/sqft
last 12 mo · ≤1 miLoading sold comps…