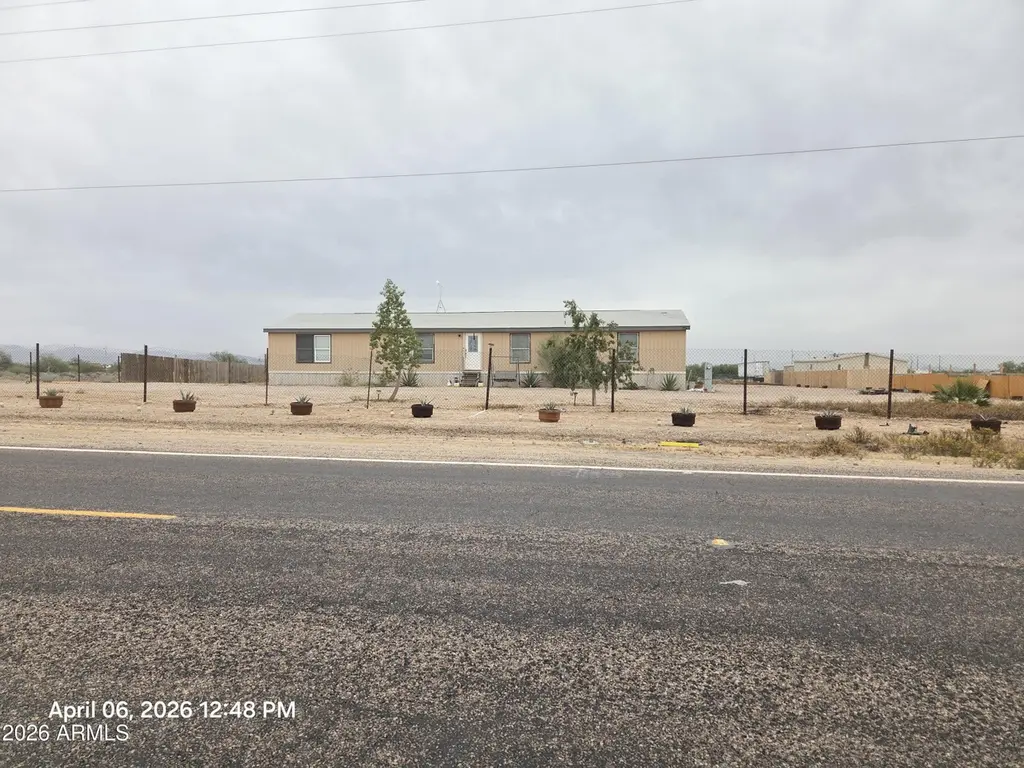
6115 S 351st Ave · Arlington, AZ
Flood risk 1/10 · Minimal
- FEMA flood zone
- X (shaded)
- Chance of flooding over 30 yrs
- 0.0%
- Est. flood insurance / yr
- $507 – $1,088
Fire risk 5/10 · Moderate
- Est. fire insurance / yr
- $610 – $1,132
Heat risk 9/10 · Severe
- Hot days now (above 115°F)
- 7 days/yr
- Hot days in 30 yrs
- 18 days/yr
Wind risk 1/10 · Minimal
- Chance of severe wind over 30 yrs
- —
Air-quality risk 1/10 · Minimal
- Unhealthy air days now
- 0 days/yr
- Unhealthy air days in 30 yrs
- 0 days/yr
Risk factors via First Street. Map © Google.
Why this score? — see what drove the D+ grade
The composite is a weighted blend of 9 inputs, each scored 0–100. Each bar is that input's sub-score; the figure is the points it added to the 100-point composite (weight × sub-score).
- ARV discount +15.0/15.0
- Appreciation +10.0/10.0
- Cash flow +8.4/30.0
- 1% rule +2.6/10.0
- Rent growth +2.5/5.0
- Condition / age +2.5/5.0
- Schools +2.4/10.0
- Livability +2.4/5.0
- DSCR +2.3/10.0
$264,999
🖨 Deal sheet (PDF) 📄 Offer letter ✓ Due diligence
Listing remarks
Spacious rural property with endless potential! This expansive parcel offers the perfect opportunity to build your dream home, create a private retreat, or invest in Arizona land. Enjoy wide-open skies, mountain views, and the peaceful lifestyle Tonopah is known for. Currently has a nice 2013 Manufacture home that includes 4bds, 2 bath, kitchen granite counter tops and other updates thru the home. Located just a short drive from Buckeye and I-10, providing convenient access while still offering privacy and space. Ideal for those seeking room for horses, toys, or future development. Don't miss this chance to own land in a rapidly growing area with strong upside potential.
Key facts
- Room for horses
- Arizona land
- Future development
Tags
Property features AI
Finance
- Financial info: Current financing: FHA
- HOA & community: No association fees
Exterior
- Parking: Circular driveway
- Utilities: Shared well water; Septic tank
- Home design: Manufactured/Mobile home; Fee simple ownership
- Construction: Other construction materials; Other roof type; Building area per assessor
- Exterior features: Natural desert front; Natural desert back; Horses allowed; Circular driveway
Interior
- Kitchen: Eat-in kitchen
- Bedrooms: Up to 4 bedrooms
- Bathrooms: 2 full bathrooms
- Heating & cooling: Central air conditioning; Heating present
- Interior features: Eat-in kitchen; Full bathroom in master bedroom
- Laundry & utility: No laundry hookups on file
Neighborhood map
What this means for you Summary
Snapshot
- This is a 4-bed/2.0-bath manufactured listed at $265k.
Deal economics
- At list price, monthly cash flow is $-236 ($-3k/yr) — negative.
- To cash-flow at today's rent, offer at most $231k (12.9% below list).
- To meet the 1% rule (rent ≥ 1% of price), the offer needs to be $202k (23.8% below list).
- Recommended offer: $202k (23.8% below list) — sets the bar for 1% rule.
Location & tenants
- Location reads 47/100 on livability (#361 in AZ) — a working-class tenant base; expect higher turnover. Strengths: housing A+, crime A, cost of living A-; Watch: amenities F, commute F, employment F.
- Saddle Mountain Unified School District (4254) (rural): math 26% / reading 27% proficiency, ranked #117 of 249 in AZ (top 47%) — low school quality limits family demand, transient renter base, plan for 1-2y turnover.
- Zoned schools: Winters Well Elementary School (math 11% / reading 18%, grade F, #898 of 1,109 statewide, top 83%, 578 students, 75% FRL); Tonopah Valley High School (math 27% / reading 32%, grade F, #120 of 381 statewide, top 34%, 865 students, 52% FRL).
- Market conditions: 791 active listings in the ZIP; 36,011 units permitted in Maricopa County in 2024 (12,801 in 5+ unit buildings).
Forward outlook
- In year one you build about $28k of equity ($2k loan paydown + $26k appreciation (10.0% local appreciation)).
- Maricopa County population projected at +38% by 2050 — long-run rental-demand tailwind backs the buy-and-hold thesis.
- By year 2, paydown + projected appreciation supports a ~$46k cash-out refi (75% LTV) — recoverable capital for the next deal without selling this one.
Negotiation context
- It's been on market 52 days — a 3% lower offer ($257k) is reasonable based on typical stale-listing flexibility.
- 2 sale attempts since 5y ago with the ask held roughly flat each time — persistent listings suggest the price (not the market) is what's stuck; bring a comps-based counter.
Risks & watch-outs
- Climate carrying-cost: moderate wildfire risk; extreme-heat days projected 7→18/yr by 2055 (HVAC capex compounding) — expect insurance premiums to compound above CPI over the hold.
Questions for the listing agent
- What do current leases actually rent for vs. the listed asking? Can we see a recent rent roll and the last 12 months of T-12 income?
- It's been on market 52 days. Have you received any prior offers? Is the seller open to a 24% concession, seller financing, or rate buy-down credit?
- Is there a deadline driving the sale (1031 exchange, divorce, estate, relocation)? That informs how much negotiation room exists.
- Schools are F-rated, which usually means shorter tenancies and higher turnover. Who's the typical renter profile here, and what's been the actual vacancy rate?
- The area grade is low — what's the realistic commute time and amenity access for the typical tenant pool here? Any planned neighborhood developments (good or bad) we should know about?
- What's the average days-on-market for RENTAL listings here right now (not sales)? A rising rental-DOM trend means longer vacancies and softer asking-rent achievability than the comps imply.
- What's the recent tenant-quality profile in this submarket — average credit score on applications, eviction rate, late-payment / NSF rate, and stable-employment percentage? A property-management company in the area should have these aggregated.
- How much new for-sale + rental construction is in the pipeline within 1–3 miles? Heavy new supply typically softens prices + rents 12–24 months out; constrained supply supports both.
Investment metrics
- 1% rule
- 0.76% ✗
- Cap rate
- 5.23%
- Cash-on-cash
- -3.81%
- DSCR
- 0.83
- GRM
- 10.9
CMA / ARV
- ARV (on-the-fly)
- $338,580
- Comps found
- 1
Show comp detail 1 sale within ~0.75 mi
| Address | Dist | Beds/Ba | Sqft | Sold | Price | $/sf | Match |
|---|---|---|---|---|---|---|---|
| 6409 S 351st Ave | 0.19mi | 3/2.0 (-1) | 1,960 (-4%) | 23mo | $323,000 | $165 | 59 |
Match score weights: distance 35% · size 25% · config 20% · recency 20%. Top-matched comps best support the ARV.
Projected returns pro-forma
10.0% appreciation · 3.0% rent growth · sell at horizon
- IRR
- 21.6%
- Equity multiple
- 2.74×
- Total profit
- $129,345
- Equity at exit
- $238,732
- IRR
- 19.5%
- Equity multiple
- 6.29×
- Total profit
- $392,765
- Equity at exit
- $514,835
Cash invested: $74,200 (down + closing). Projections, not guarantees.
Landlord ↔ Tenant lean methodology
- Overall (STATE)
- 87 Strongly Landlord-Friendly
- State Arizona
- 87 Strongly Landlord-Friendly · R+3
- County
- — inherits STATE
- City
- — inherits STATE
ZIP-level market 85354
- Home prices YoY
- 30.5%
- Active inventory
- 791
- Price-to-rent
- 10.9×
Monthly cashflow live
- Estimated rent
- $2,020 medium interval (Pro) →
- Mortgage (P&I)
- −$1,390
- Tax est. 1.5%
- −$331 /mo · $3,975/yr
- Insurance
- −$110
- HOA
- −$0
- Vacancy / Maint / Mgmt
- −$424
- Net cashflow
- $-236
Break-even live
Sensitivity live
| Price | -10% $-53 | -5% $-144 | +0% $-236 | +5% $-327 | +10% $-419 |
|---|---|---|---|---|---|
| Rent | -10% $-395 | -5% $-315 | +0% $-236 | +5% $-156 | +10% $-76 |
| Rate | -1.0pp $-102 | -0.5pp $-168 | base $-236 | +0.5pp $-304 | +1.0pp $-374 |
UW: 25.0% down · 7.5% · 30yr · 1.5% tax · 5.0% vac · 8.0% maint · 8.0% mgmt
Financing live
Cash to close
- Down payment
- $66,250
- Closing costs
- $7,950
- Reserves months
- —
- Total cash needed
- —
Loan-product check · same deal, 3 products live
Conventional
25% down · 7.5% · 30yr
- Down + closing
- —
- Monthly P&I
- —
- Monthly cashflow
- —
- DSCR
- —
- Eligible?
- —
Personal DTI + credit; lowest rate.
DSCR
20% down · 8.5% · 30yr
- Down + closing
- —
- Monthly P&I
- —
- Monthly cashflow
- —
- DSCR
- —
- Eligible?
- —
No personal income docs; deal must DSCR.
Hard money
10% down · 12.0% · 12mo
- Down + closing
- —
- Monthly P&I
- —
- Monthly cashflow
- —
- DSCR
- —
- Eligible?
- —
Short-term bridge; refi at stabilization.
Listing history 10 events
-
2026-05-23status Pending
-
2026-05-16price $264,999
-
2026-04-28price $275,000
-
2026-04-20price $318,000
-
2026-03-27$275,000 Active
-
2024-02-23soldstatus $325,000
-
2021-08-20soldstatus $295,000
-
2021-08-20soldstatus $325,000
-
2021-08-06historical
-
2021-07-29$330,000 Active
ⓘ Source: listings_history table (triggers on properties + properties_extension) + one-shot
backfill from property_details.listing_events for pre-trigger history.
Climate risk First Street
- Flood 1/10 Low FEMA zone X (shaded) · 0% chance over 30 yrs
- Wildfire 5/10 Major
- Heat 9/10 Extreme 7 d/yr ≥115°F today · 18 d/yr by 30 yrs out
- Wind 1/10 Low
- Air quality 1/10 Low 0 unhealthy d/yr today · 0 by 30 yrs out
Nearby sold comps map
Loading sold comps map…
Walkable amenities ~0.75 mi
Loading nearby amenities…
Taxation est. · year 1
- Rental income
- $24,238
- − Mortgage interest
- −$14,844
- − Property taxes
- −$3,975
- − Insurance
- −$1,325
- − Repairs & maintenance
- −$1,939
- − Management
- −$1,939
- − Depreciation
- −$7,709
- Taxable loss
- −$7,493
- Est. tax savings @ 24.0%
- +$1,798
- After-tax cash flow
- $-1,030/yr
For passive investors: Depreciation is non-cash, so a rental often shows a tax loss while cash-flowing — sheltering income. Rental losses are passive: they offset passive income freely, and up to $25,000/yr can offset ordinary (W-2) income if you actively participate and your MAGI is under $100k (phasing out to $0 by $150k); unused losses carry forward. On sale, claimed depreciation is recaptured at up to 25%, and gains may owe capital-gains tax (a 1031 exchange can defer both). Figures are a year-1 estimate at your 24.0% rate — not tax advice; consult a CPA.
Schools (NCES district)
- District
- Saddle Mountain Unified School District (4254)
- NCES district ID
- 0407170
- Math proficiency
- 26% ▼ -17.00%
- Reading proficiency
- 27% ▼ -8.00%
- Median HH income
- $61,981
- Composite
- 24.45/100
- National rank
- #7666
- State rank
- #117 of 249 in AZ
Livability — Arlington
- Score
- 47/100
- State rank
- #361
- US rank
- #26320
Category grades
Schools grade is shown separately in the Schools card above.
Census & demographics
- Population (ZIP)
- 7,731
Population outlook (Maricopa County) Hauer SSP2
- Today (2025)
- 4,979,203 people
- By 2030
- 5,378,229 · +8.0%
- By 2040
- 6,156,598 · +23.6%
- By 2050
- 6,872,376 · +38.0%
- By 2075
- 8,401,270 · +68.7%
- By 2100
- 9,247,439 · +85.7%
Race, ethnicity, and origin ACS 2023
- Neighborhood character
- Majority White (63%)
- Race & ethnicity
- White 63% Hispanic / Latino 35% Two or more races 18%
- Hispanic origin (detail)
- Mexican 31%
- Common ancestry
- Slovak 2% Italian 2% Portuguese 1%
- Foreign-born
- 11% · Canada
- Languages at home
- 76% English-only · Spanish 23%
Political lean MEDSL · Maricopa
- 2024 margin
- Toss-up / Even · D 47.7% · R 51.2% · Other 1.1%
- 2008→2024 swing
- +7.1pp toward D · 2008: -10.6pp · 2024: -3.5pp
- All cycles
- 2024: R+3.5 2020: D+2.2 2016: R+3.5 2012: R+12.0 2008: R+10.6
Not yet ingested
- Civics
- —
Market trends
- HPI YoY
- ▲ 117.45%
- Current HPI
- 502.8512
- Rent YoY
- —
- Metro
- —
- State GDP YoY
- ▲ 4.54%
- F500 in state
- 20
Industry mix (Fortune 500 HQ in AZ)
| Industry | F500 HQs | Revenue |
|---|---|---|
| Technology | 2 | $13B |
|
||
| Mining / Metals | 1 | $23B |
|
||
| Environmental Services | 1 | $16B |
|
||
| Metals / Steel | 1 | $14B |
|
||
| Technology Distribution | 1 | $9B |
|
||
| Homebuilding | 1 | $8B |
|
||
Price history
-19.7% since first listed10 events — show timeline
- 2026-05-23 Pending — ARMLS
- 2026-05-16 Price Changed $264,999 ARMLS
- 2026-04-28 Price Changed $275,000 ARMLS
- 2026-04-20 Price Changed $318,000 ARMLS
- 2026-03-27 Listed $275,000 ARMLS
- 2024-02-23 Sold (Public Records) $325,000 Public Records
- 2021-08-20 Sold (Public Records) $325,000 Public Records
- 2021-08-20 Sold (Public Records) $295,000 Public Records
- 2021-08-06 Listing Removed — ARMLS
- 2021-07-29 Listed $330,000 ARMLS
Property tax history
+14.8%/yrLatest (2025): $307 · +9.5% YoY. Source: county tax records.
Cash-flow waterfall
monthlySold comps — $/sqft
last 12 mo · ≤1 miLoading sold comps…