1053 Redan Trl · Redan, GA
Flood risk 1/10 · Minimal
- FEMA flood zone
- X (unshaded)
- Chance of flooding over 30 yrs
- 0.0%
- Est. flood insurance / yr
- $507 – $1,088
Fire risk 1/10 · Minimal
- Est. fire insurance / yr
- $963 – $1,789
Heat risk 5/10 · Moderate
- Hot days now (above 104°F)
- 7 days/yr
- Hot days in 30 yrs
- 17 days/yr
Wind risk 6/10 · Moderate
- Chance of severe wind over 30 yrs
- 27.0%
Air-quality risk 6/10 · Moderate
- Unhealthy air days now
- 8 days/yr
- Unhealthy air days in 30 yrs
- 11 days/yr
Risk factors via First Street. Map © Google.
Why this score? — see what drove the D grade
The composite is a weighted blend of 9 inputs, each scored 0–100. Each bar is that input's sub-score; the figure is the points it added to the 100-point composite (weight × sub-score).
- ARV discount +15.0/15.0
- Cash flow +10.8/30.0
- Rent growth +3.4/5.0
- Livability +3.2/5.0
- DSCR +3.1/10.0
- 1% rule +2.8/10.0
- Condition / age +2.5/5.0
- Schools +2.1/10.0
- Appreciation +0.0/10.0
$250,000
🖨 Deal sheet (PDF) 📄 Offer letter ✓ Due diligence
Listing remarks MLS
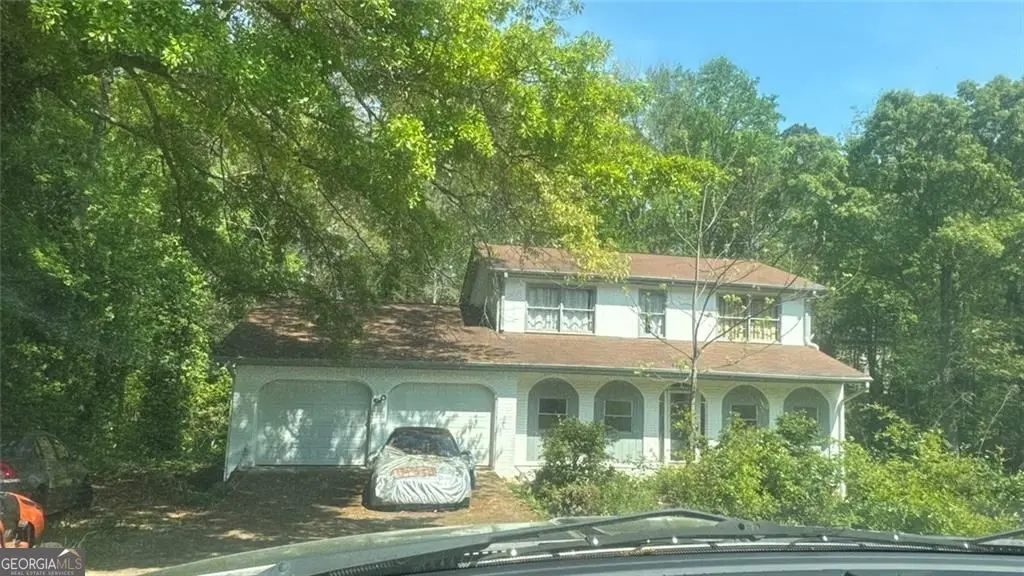
Opportunity awaits with this spacious fixer-upper situated on a large lot, offering incredible potential for both homeowners and investors alike. Featuring a versatile layout ideal for multi-generational living, this property presents endless possibilities to customize and maximize its value. Whether you envision creating a split-pad setup with room rentals, converting the home into a duplex for income-producing potential, or designing a private in-law suite, this property offers the space and flexibility to bring your vision to life. The sellers have completed a pre-listing appraisal, and the home is priced below appraised value, creating an exceptional opportunity for the right buyer. Due to the property being occupied, showings are limited. Agent is related to the seller and is a part owner of the property.
Key facts
- 0.77 acre lot
- 2 garage spots
- Built 1974
Property features AI
Exterior
- Parking: Garage parking; Two garage spaces; Total parking for six vehicles
- Utilities: Public water; Public sewer; 110V and 220V electric; Other utilities
- Home design: Two levels (two-story); Property listed as fixer condition
- Construction: Wood siding and brick exterior; Shingle roof; Slab foundation; Year built not provided
- Exterior features: Patio; Other exterior features
Interior
- Kitchen: No specific kitchen features listed
- Bedrooms: One main-level bedroom; Three upper-level bedrooms; Bedroom features: none listed
- Flooring: Carpet; Vinyl
- Bathrooms: Three full bathrooms; One main-level bathroom; Two upper-level full bathrooms; Master bathroom with double vanity
- Heating & cooling: Central heating; Central air conditioning
- Interior features: One fireplace located in the family room; Partial basement; No shared/common walls; Other interior features
- Laundry & utility: Washer and dryer included; Laundry located in the kitchen
Neighborhood map
What this means for you Summary
Snapshot
- This is a 3-bed/3.0-bath single-family listed at $250k.
Deal economics
- At list price, monthly cash flow is $-116 ($-1k/yr) — negative.
- To cash-flow at today's rent, offer at most $229k (8.2% below list).
- To meet the 1% rule (rent ≥ 1% of price), the offer needs to be $195k (21.9% below list).
- Recommended offer: $195k (21.9% below list) — sets the bar for 1% rule.
Location & tenants
- Location reads 64/100 on livability (#274 in GA) — a middle-class / working-renter tenant base. Strengths: cost of living A+, housing A+; Watch: crime D, amenities F, commute F.
- Dekalb County (suburban): math 19% / reading 28% proficiency, ranked #125 of 174 in GA (top 72%) — low school quality limits family demand, transient renter base, plan for 1-2y turnover; 68% free/reduced lunch — lower-income household profile, screen leases tightly.
- Zoned schools: Eldridge L. Miller Elementary School (math 8% / reading 17%, grade F, #1,032 of 1,228 statewide, top 85%, 492 students, 100% FRL); Redan Middle School (math 8% / reading 12%, grade F, #433 of 470 statewide, top 93%, 668 students, 100% FRL); Redan High School (math 8% / reading 17%, grade F, #336 of 424 statewide, top 80%, 951 students, 100% FRL) — zoned schools average 100% FRL vs 68% district-wide (32 pts higher); higher-poverty schools than district average — tighter screening recommended.
- Zoned-school proficiency averages 11% at this address vs 24% district-wide (-12 pts) — the specific schools serving this property underperform the Dekalb County average; the district grade overstates school quality for this exact location.
- Market conditions: Rents rising (+3.7%/yr); 220 active listings in the ZIP; 26 comparable units currently listed for rent nearby; rentals at typical pace (median 25d on market — plan ~3-4 weeks tenant-placement turnaround); 1,240 units permitted in DeKalb County in 2024 (385 in 5+ unit buildings).
- This rent runs 33% of the median local income ($70k/yr) — at the standard rent-burdened threshold; future hikes will face affordability resistance.
Forward outlook
- Local home prices are declining (-3.0%/yr); year-one equity from $2k of loan paydown is wiped out by about $8k of value loss. Plan a longer hold.
- DeKalb County population projected at +28% by 2050 — long-run rental-demand tailwind backs the buy-and-hold thesis.
Negotiation context
- It's been on market 38 days — a 3% lower offer ($242k) is reasonable based on typical stale-listing flexibility.
- 2 sale attempts with the ask held roughly flat each time — persistent listings suggest the price (not the market) is what's stuck; bring a comps-based counter.
- Current owner paid $130k; list at $250k implies a 92% gain — meaningful room to come down on a strong offer.
Risks & watch-outs
- Climate carrying-cost: major wind risk, 27% chance of damaging wind over 30y; extreme-heat days projected 7→17/yr by 2055 (HVAC capex compounding) — expect insurance premiums to compound above CPI over the hold.
Questions for the listing agent
- What do current leases actually rent for vs. the listed asking? Can we see a recent rent roll and the last 12 months of T-12 income?
- It's been on market 38 days. Have you received any prior offers? Is the seller open to a 22% concession, seller financing, or rate buy-down credit?
- Built in 1974 — when were the roof, HVAC, electrical panel, plumbing, and water heater last replaced?
- Is there a deadline driving the sale (1031 exchange, divorce, estate, relocation)? That informs how much negotiation room exists.
- Schools are B-rated — typically a magnet for longer-tenancy family renters. What's the average tenant stay here, and is there a school-zone premium baked into asking?
- Crime grade is D in this area — have there been break-ins, vandalism, or insurance claims at this property in the last 3 years? What carrier currently insures it and at what premium?
- The area grade is low — what's the realistic commute time and amenity access for the typical tenant pool here? Any planned neighborhood developments (good or bad) we should know about?
- What's the average days-on-market for RENTAL listings here right now (not sales)? A rising rental-DOM trend means longer vacancies and softer asking-rent achievability than the comps imply.
- What's the recent tenant-quality profile in this submarket — average credit score on applications, eviction rate, late-payment / NSF rate, and stable-employment percentage? A property-management company in the area should have these aggregated.
- How much new for-sale + rental construction is in the pipeline within 1–3 miles? Heavy new supply typically softens prices + rents 12–24 months out; constrained supply supports both.
Investment metrics
- 1% rule
- 0.78% ✗
- Cap rate
- 5.74%
- Cash-on-cash
- -1.99%
- DSCR
- 0.91
- GRM
- 10.7
CMA / ARV
- ARV (median comp)
- $322,552
- List price
- $250,000
- Delta
- -22.49%
- Verdict
- UNDERPRICED
- Comps
- 20 within 1.0 mi
Show comp detail 12 sales within ~0.75 mi
| Address | Dist | Beds/Ba | Sqft | Sold | Price | $/sf | Match |
|---|---|---|---|---|---|---|---|
| 858 Chapman Cir | 0.22mi | 3/2.5 | 2,320 (+7%) | 0mo | $252,500 | $109 | 76 |
| 961 Redan Trce | 0.35mi | 3/2.5 | 2,080 (-4%) | 2mo | $247,000 | $119 | 74 |
| 1015 Sly Fox Ct | 0.37mi | 3/2.5 | 2,260 (+4%) | 2mo | $254,000 | $112 | 72 |
| 5215 Mainstreet Park Dr | 0.34mi | 4/2.5 (+1) | 2,060 (-5%) | 1mo | $265,000 | $129 | 68 |
| 1018 Martin Rd | 0.22mi | 4/2.0 (+1) | 1,986 (-8%) | 3mo | $260,000 | $131 | 65 |
| 5271 Fox Path | 0.39mi | 4/2.5 (+1) | 2,288 (+6%) | 2mo | $298,000 | $130 | 64 |
| 5360 Fieldgreen Dr | 0.60mi | 4/3.5 (+1) | 2,114 (-2%) | 2mo | $321,600 | $152 | 59 |
| 1342 Muirfield Dr | 0.56mi | 4/3.0 (+1) | 2,064 (-5%) | 3mo | $277,990 | $135 | 58 |
| 971 Willow Run | 0.40mi | 4/2.5 (+1) | 2,361 (+9%) | 2mo | $242,000 | $102 | 58 |
| 1223 Muirfield Dr | 0.43mi | 4/3.0 (+1) | 1,860 (-14%) | 2mo | $229,000 | $123 | 50 |
| 5175 Walker Rd | 0.47mi | 3/2.0 | 1,844 (-15%) | 1mo | $215,000 | $117 | 48 |
| 5450 Fox Haven Trl | 0.69mi | 4/2.5 (+1) | 1,990 (-8%) | 2mo | $249,000 | $125 | 46 |
Match score weights: distance 35% · size 25% · config 20% · recency 20%. Top-matched comps best support the ARV.
Projected returns pro-forma
-3.0% appreciation · 3.72% rent growth · sell at horizon
- IRR
- -18.8%
- Equity multiple
- 0.34×
- Total profit
- $-46,495
- Equity at exit
- $37,276
- IRR
- -10.0%
- Equity multiple
- 0.37×
- Total profit
- $-44,129
- Equity at exit
- $21,615
Cash invested: $70,000 (down + closing). Projections, not guarantees.
Landlord ↔ Tenant lean methodology
- Overall (STATE)
- 90 Strongly Landlord-Friendly
- State Georgia
- 90 Strongly Landlord-Friendly · R+3
- County
- — inherits STATE
- City
- — inherits STATE
ZIP-level market 30088
- Rents YoY
- 3.7%
- Active inventory
- 220
- Price-to-rent
- 10.7×
Monthly cashflow live
- Estimated rent
- $1,953 high interval (Pro) →
- Mortgage (P&I)
- −$1,311
- Tax from tax record
- −$244 /mo · $2,928/yr
- Insurance
- −$104
- HOA
- −$0
- Vacancy / Maint / Mgmt
- −$410
- Net cashflow
- $-116
Break-even live
Sensitivity live
| Price | -10% $25 | -5% $-45 | +0% $-116 | +5% $-187 | +10% $-258 |
|---|---|---|---|---|---|
| Rent | -10% $-270 | -5% $-193 | +0% $-116 | +5% $-39 | +10% $38 |
| Rate | -1.0pp $10 | -0.5pp $-53 | base $-116 | +0.5pp $-181 | +1.0pp $-247 |
UW: 25.0% down · 7.5% · 30yr · 1.5% tax · 5.0% vac · 8.0% maint · 8.0% mgmt
Financing live
Cash to close
- Down payment
- $62,500
- Closing costs
- $7,500
- Reserves months
- —
- Total cash needed
- —
Loan-product check · same deal, 3 products live
Conventional
25% down · 7.5% · 30yr
- Down + closing
- —
- Monthly P&I
- —
- Monthly cashflow
- —
- DSCR
- —
- Eligible?
- —
Personal DTI + credit; lowest rate.
DSCR
20% down · 8.5% · 30yr
- Down + closing
- —
- Monthly P&I
- —
- Monthly cashflow
- —
- DSCR
- —
- Eligible?
- —
No personal income docs; deal must DSCR.
Hard money
10% down · 12.0% · 12mo
- Down + closing
- —
- Monthly P&I
- —
- Monthly cashflow
- —
- DSCR
- —
- Eligible?
- —
Short-term bridge; refi at stabilization.
Rent comps 26 comps
| Address | Beds | Baths | Sqft | Rent | $/sqft | DOM | Units | Dist |
|---|---|---|---|---|---|---|---|---|
| 1076 Martin Rd Stone Mountain, GA | 4.0 | 2.0 | 1760 | $2,011 | $1.14 | 17d | 1 | 0.15mi |
| 982 Chapman Cir Stone Mountain, GA | 3.0 | 2.0 | 1476 | $2,000 | $1.36 | 2d | 1 | 0.25mi |
| 1168 Perry Way Stone Mountain, GA | 4.0 | 3.0 | 2100 | $1,200 | $0.57 | 2d | 1 | 0.35mi |
| 5386 Kristian Ct Stone Mountain, GA | 4.0 | 2.0 | 1531 | $1,901 | $1.24 | 25d | 1 | 0.48mi |
| 855 Lost Creek Cir Stone Mountain, GA | 4.0 | 2.5 | 2619 | $1,946 | $0.74 | 44d | 1 | 0.50mi |
| 1078 Forest Path Stone Mountain, GA | 4.0 | 2.5 | 1554 | $1,845 | $1.19 | 44d | 1 | 0.51mi |
| 782 Fox Valley Dr Stone Mountain, GA | 4.0 | 2.0 | 1964 | $2,000 | $1.02 | 25d | 1 | 0.61mi |
| 1338 Mill Lake Cir Stone Mountain, GA | 3.0 | 2.0 | 1844 | $1,900 | $1.03 | 2d | 1 | 0.63mi |
| 5486 Fox Valley Ln Stone Mountain, GA | 3.0 | 2.5 | 1536 | $1,850 | $1.20 | 20d | 1 | 0.65mi |
| 1467 Muirfield Dr Stone Mountain, GA | 3.0 | 2.0 | 1630 | $1,870 | $1.15 | 23d | 1 | 0.70mi |
| 5118 Rocky Gln Stone Mountain, GA | 4.0 | 2.0 | 1932 | $2,100 | $1.09 | 44d | 1 | 0.75mi |
| 5482 Martins Crossing Rd Stone Mountain, GA | 3.0 | 2.0 | 1482 | $1,575 | $1.06 | 13d | 1 | 0.86mi |
| 905 Hemingway Rd Stone Mountain, GA | 3.0 | 2.0 | 1400 | $1,625 | $1.16 | 13d | 1 | 0.90mi |
| 869 Heritage Oaks Dr Stone Mountain, GA | 3.0 | 2.5 | 1400 | $1,199 | $0.86 | 0d | 1 | 0.90mi |
| 811 King Rd Stone Mountain, GA | 3.0 | 3.0 | 1840 | $3,300 | $1.79 | 44d | 1 | 0.94mi |
| 4899 Hairston Pl Stone Mountain, GA | 3.0 | 2.5 | 1468 | $1,981 | $1.35 | 13d | 1 | 0.99mi |
| 1401 Panola Rd Stone Mountain, GA | 4.0 | 4.5 | 2000 | $2,975 | $1.49 | 44d | 1 | 1.00mi |
| 867 Oakhill Ct Stone Mountain, GA | 3.0 | 2.5 | 1556 | $1,850 | $1.19 | 44d | 1 | 1.04mi |
| 841 Arbor Ct Stone Mountain, GA | 3.0 | 2.0 | 1448 | $1,845 | $1.27 | 23d | 1 | 1.14mi |
| 5799 Redan Rd Stone Mountain, GA | 3.0 | 2.0 | 1546 | $1,490 | $0.96 | 25d | 1 | 1.22mi |
| 5734 Lanny Ln Lithonia, GA | 3.0 | 2.0 | 1589 | $1,800 | $1.13 | 25d | 1 | 1.25mi |
| 4980 Fairforest Dr Stone Mountain, GA | 3.0 | 2.0 | 2181 | $2,075 | $0.95 | 13d | 1 | 1.35mi |
| 1433 Saint Dunstans Rd Lithonia, GA | 4.0 | 2.5 | 2283 | $1,911 | $0.84 | 25d | 1 | 1.36mi |
| 4852 Lost Colony Ct Stone Mountain, GA | 4.0 | 3.0 | 1694 | $1,775 | $1.05 | 25d | 1 | 1.37mi |
| 5308 Omalley Ln Stone Mountain, GA | 4.0 | 2.5 | 1950 | $1,949 | $1.00 | 44d | 1 | 1.45mi |
| 1487 Saint Dunstans Rd Lithonia, GA | 3.0 | 2.5 | 1650 | $1,973 | $1.20 | 0d | 1 | 1.49mi |
Listing history 18 events
-
2026-06-21days on market $250,000 Active 38 DOM
-
2026-06-18days on market $250,000 Active 35 DOM
-
2026-06-17days on market $250,000 Active 34 DOM
-
2026-06-16days on market $250,000 Active 33 DOM
-
2026-06-15days on market $250,000 Active 32 DOM
-
2026-06-13days on market $250,000 Active 30 DOM
-
2026-06-09days on market $250,000 Active 26 DOM
-
2026-06-08days on market $250,000 Active 25 DOM
-
2026-06-07days on market $250,000 Active 24 DOM
-
2026-06-04days on market $250,000 Active 21 DOM
-
2026-06-03days on market $250,000 Active 20 DOM
-
2026-06-02days on market $250,000 Active 19 DOM
-
2026-06-01days on market $250,000 Active 18 DOM
-
2026-05-31days on market $250,000 Active 17 DOM
-
2026-05-14$250,000 Active 826-char remark
Show marketing remark (826 chars)
Opportunity awaits with this spacious fixer-upper situated on a large lot, offering incredible potential for both homeowners and investors alike. Featuring a versatile layout ideal for multi-generational living, this property presents endless possibilities to customize and maximize its value. Whether you envision creating a split-pad setup with room rentals, converting the home into a duplex for income-producing potential, or designing a private in-law suite, this property offers the space and flexibility to bring your vision to life. The sellers have completed a pre-listing appraisal, and the home is priced below appraised value, creating an exceptional opportunity for the right buyer. Due to the property being occupied, showings are limited. Agent is related to the seller and is a part owner of the property.
-
2026-05-14$250,000 New 826-char remark
Show marketing remark (826 chars)
Opportunity awaits with this spacious fixer-upper situated on a large lot, offering incredible potential for both homeowners and investors alike. Featuring a versatile layout ideal for multi-generational living, this property presents endless possibilities to customize and maximize its value. Whether you envision creating a split-pad setup with room rentals, converting the home into a duplex for income-producing potential, or designing a private in-law suite, this property offers the space and flexibility to bring your vision to life. The sellers have completed a pre-listing appraisal, and the home is priced below appraised value, creating an exceptional opportunity for the right buyer. Due to the property being occupied, showings are limited. Agent is related to the seller and is a part owner of the property.
-
2007-01-03soldstatus $130,000
-
1990-01-19soldstatus $104,000
ⓘ Source: listings_history table (triggers on properties + properties_extension) + one-shot
backfill from property_details.listing_events for pre-trigger history.
Tax reassessment forecast GA · Resets to sale price
- Current annual tax
- $2,928 · $244/mo
- Projected year-2 tax
- $2,928 · $244/mo
- Expected delta
- $0/yr ($0/mo · 0.0%)
ⓘ Screening estimate from a state-policy table — verify with the county assessor before closing.
Climate risk First Street
- Flood 1/10 Low FEMA zone X (unshaded) · 0% chance over 30 yrs
- Wildfire 1/10 Low
- Heat 5/10 Major 7 d/yr ≥104°F today · 17 d/yr by 30 yrs out
- Wind 6/10 Major 27% chance of damaging wind over 30 yrs
- Air quality 6/10 Major 8 unhealthy d/yr today · 11 by 30 yrs out
Nearby sold comps map
Loading sold comps map…
Walkable amenities ~0.75 mi
Loading nearby amenities…
Taxation est. · year 1
- Rental income
- $23,439
- − Mortgage interest
- −$14,004
- − Property taxes
- −$2,928
- − Insurance
- −$1,250
- − Repairs & maintenance
- −$1,875
- − Management
- −$1,875
- − Depreciation
- −$7,273
- Taxable loss
- −$5,766
- Est. tax savings @ 24.0%
- +$1,384
- After-tax cash flow
- $-10/yr
For passive investors: Depreciation is non-cash, so a rental often shows a tax loss while cash-flowing — sheltering income. Rental losses are passive: they offset passive income freely, and up to $25,000/yr can offset ordinary (W-2) income if you actively participate and your MAGI is under $100k (phasing out to $0 by $150k); unused losses carry forward. On sale, claimed depreciation is recaptured at up to 25%, and gains may owe capital-gains tax (a 1031 exchange can defer both). Figures are a year-1 estimate at your 24.0% rate — not tax advice; consult a CPA.
Schools (NCES district)
- District
- Dekalb County
- NCES district ID
- 1301740
- Math proficiency
- 19% ▼ -12.00%
- Reading proficiency
- 28% ▼ -7.00%
- Median HH income
- $51,448
- Composite
- 20.92/100
- National rank
- #8482
- State rank
- #125 of 174 in GA
Livability — Redan
- Score
- 64/100
- State rank
- #274
- US rank
- #14766
Category grades
Schools grade is shown separately in the Schools card above.
Census & demographics
- County
- Dekalb County · 782,738 people
- City population
- 29,279
- Metro
- Atlanta-Sandy Springs-Alpharetta, GA
- Population (ZIP)
- 29,240
- Household income
- $70,325
- Rent vs Own
- Severe rent burden
- 1106.0
Population outlook (DeKalb County) Hauer SSP2
- Today (2025)
- 839,977 people
- By 2030
- 891,768 · +6.2%
- By 2040
- 988,894 · +17.7%
- By 2050
- 1,074,583 · +27.9%
- By 2075
- 1,245,026 · +48.2%
- By 2100
- 1,303,135 · +55.1%
Race, ethnicity, and origin ACS 2023
- Neighborhood character
- Predominantly Black (84%)
- Race & ethnicity
- Black 84% White 5% Hispanic / Latino 5% Two or more races 5%
- Common ancestry
- Swedish 1% Russian 1%
- Foreign-born
- 11% · Canada
- Languages at home
- 90% English-only · Spanish 4% French/Haitian/Cajun 1% Other Indo-European 1%
Political lean MEDSL · DeKalb
- 2024 margin
- Solid D (+64.8) · D 81.9% · R 17.1% · Other 1.0%
- 2008→2024 swing
- +6.1pp toward D · 2008: 58.6pp · 2024: 64.8pp
- All cycles
- 2024: D+64.8 2020: D+67.4 2016: D+64.8 2012: D+56.8 2008: D+58.6
Not yet ingested
- Civics
- —
Market trends
- HPI YoY
- ▼ -169.92%
- Current HPI
- 206.5421
- Rent YoY
- ▲ 3.72%
- Metro
- Atlanta-Sandy Springs-Alpharetta, GA
- State GDP YoY
- ▲ 2.66%
- F500 in state
- 28
Industry mix (Fortune 500 HQ in GA)
| Industry | F500 HQs | Revenue |
|---|---|---|
| Paper / Packaging | 2 | $29B |
|
||
| Retail | 1 | $160B |
|
||
| Transportation / Logistics | 1 | $91B |
|
||
| Airlines | 1 | $62B |
|
||
| Consumer Goods | 1 | $47B |
|
||
| Utilities | 1 | $25B |
|
||
Price history
+140.4% since first listed4 events — show timeline
- 2026-05-14 Listed $250,000 FMLS
- 2026-05-14 Listed $250,000 GAMLS
- 2007-01-03 Sold (Public Records) $130,000 Public Records
- 1990-01-19 Sold (Public Records) $104,000 Public Records
Property tax history
+3.2%/yrLatest (2025): $2,928 · -2.3% YoY. Source: county tax records.
Cash-flow waterfall
monthlySold comps — $/sqft
last 12 mo · ≤1 miLoading sold comps…