 Multi-family
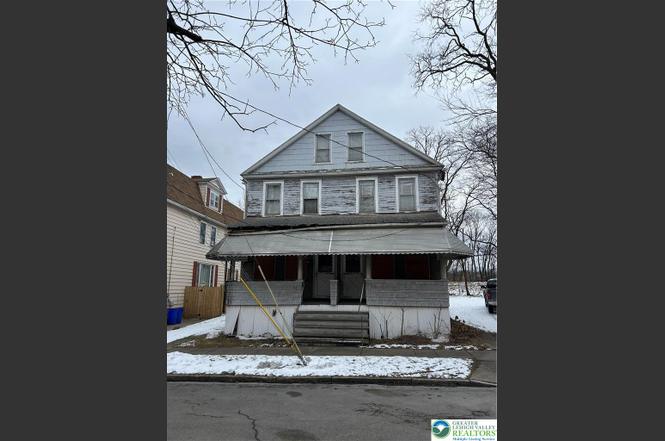
98 Brookside St · Wilkes-Barre, PA
Flood risk 9/10 · Severe
- FEMA flood zone
- X
- Chance of flooding over 30 yrs
- 0.99%
- Est. flood insurance / yr
- $507 – $1,088
Fire risk 1/10 · Minimal
- Est. fire insurance / yr
- $511 – $949
Heat risk 4/10 · Minor
- Hot days now (above 95°F)
- 7 days/yr
- Hot days in 30 yrs
- 17 days/yr
Wind risk 3/10 · Minor
- Chance of severe wind over 30 yrs
- 4.0%
Air-quality risk 3/10 · Minor
- Unhealthy air days now
- 2 days/yr
- Unhealthy air days in 30 yrs
- 4 days/yr
Risk factors via First Street. Map © Google.
Why this score? — see what drove the B grade
The composite is a weighted blend of 9 inputs, each scored 0–100. Each bar is that input's sub-score; the figure is the points it added to the 100-point composite (weight × sub-score).
- Cash flow +30.0/30.0
- ARV discount +15.0/15.0
- 1% rule +10.0/10.0
- DSCR +10.0/10.0
- Rent growth +2.5/5.0
- Livability +2.5/5.0
- Condition / age +2.5/5.0
- Schools +2.1/10.0
- Appreciation +0.0/10.0
$149,900
🖨 Deal sheet 📄 Offer letter ✓ Due diligence
Multi-family units
County records classify this as Multi-Family (2-4 Unit). Listing-text estimate: 1 unit. estimate disagrees with records
Listing remarks MLS
INVESTMENT OPPORTUNITY - HOME IS A TOTAL REHAB. 98 HAS 3 BEDROOM ONE BATH AND 100 HAS TWO ONE BEDROOM ONE BATH APARTMENTS. LARGE LOT WITH OFF STREET PARKING. CALL TODAY!
Key facts
- 0.39 acre lot
- 6 parking spots
- Listed 88 days
Neighborhood map
What this means for you Summary
Snapshot
- This is a 5-bed/3.0-bath multifamily listed at $150k.
Deal economics
- At list price, monthly cash flow is $2k ($21k/yr) — positive.
- The deal already cash-flows at list — no discount required.
- Meets the 1% rule at list price ($4k rent vs $150k).
- Recommended offer: $141k (6.0% below list) — sets the bar for market timing.
- Cap rate 21.0% vs local median 5.7% in Wilkes-Barre — top-decile yield for the area; either an underpriced asset or a hidden risk that comps aren't pricing in. Stress-test before assuming the spread holds.
Location & tenants
- Location reads: area grade B — affects rentability + tenant quality, not the cash-flow math above.
- Wilkes-Barre Area SD (urban): math 19% / reading 32% proficiency, ranked #469 of 539 in PA (top 87%) — low school quality limits family demand, transient renter base, plan for 1-2y turnover; 61% free/reduced lunch — lower-income household profile, screen leases tightly.
- Market conditions: 74 active listings in the ZIP; 349 units permitted in Luzerne County in 2024 (16 in 5+ unit buildings).
- At $3,643/mo this rent would consume 74% of the median local household income ($59k/yr) (locally 549% of renters already pay >50% of income on rent) — very limited rent-growth headroom before tenants either downsize or default.
Forward outlook
- Local home prices are declining (-3.0%/yr); year-one equity from $1k of loan paydown is wiped out by about $4k of value loss. Plan a longer hold.
- Luzerne County population projected at +4% by 2050 — modest demand growth; plan on rents tracking national, not racing it.
- At projected returns (-3.0% appreciation + 3.0% rent growth), your $42k cash investment doubles in ~3 years — after that, you're playing with house money.
Negotiation context
- It's been on market 88 days — a 6% lower offer ($141k) is reasonable based on typical stale-listing flexibility.
Risks & watch-outs
- Watch-outs: flood insurance adds $66/mo; built in 1900 — expect roof / HVAC / electrical / plumbing capex.
- Climate carrying-cost: severe flood risk — expect insurance premiums to compound above CPI over the hold.
Questions for the listing agent
- It's been on market 88 days. Have you received any prior offers? Is the seller open to a 6% concession, seller financing, or rate buy-down credit?
- Built in 1900 — when were the roof, HVAC, electrical panel, plumbing, and water heater last replaced?
- What's the actual annual flood-insurance premium (NFIP or private), and is the property in a SFHA with mandatory coverage?
- Why hasn't it sold? Are there any deal-killer items the seller is aware of (foundation, flood, title, zoning, code violations)?
- Is there a deadline driving the sale (1031 exchange, divorce, estate, relocation)? That informs how much negotiation room exists.
- What's the average days-on-market for RENTAL listings here right now (not sales)? A rising rental-DOM trend means longer vacancies and softer asking-rent achievability than the comps imply.
- What's the recent tenant-quality profile in this submarket — average credit score on applications, eviction rate, late-payment / NSF rate, and stable-employment percentage? A property-management company in the area should have these aggregated.
- How much new apartment / multifamily construction is in the pipeline within 1–3 miles? Heavy new supply (>2% of stock underway) typically softens rents 12–24 months out; light construction supports rent growth.
Investment metrics
- 1% rule
- 2.43% ✓
- Cap rate
- 21.04%
- Cash-on-cash
- 52.66%
- DSCR
- 3.34
- GRM
- 3.4
CMA / ARV
- ARV (median comp)
- $228,580
- List price
- $149,900
- Delta
- -34.42%
- Verdict
- UNDERPRICED
- Comps
- 20 within 1.0 mi
Show comp detail 7 sales within ~0.75 mi
| Address | Dist | Beds/Ba | Sqft | Sold | Price | $/sf | Match |
|---|---|---|---|---|---|---|---|
| 46 48 Chestnut St | 0.25mi | 6/2.0 (+1) | 2,465 (-12%) | 2mo | $200,000 | $81 | 58 |
| 801 Washington St | 0.20mi | 5/3.0 | 2,392 (-15%) | 16mo | $237,000 | $99 | 53 |
| 563 Franklin St | 0.53mi | 5/2.0 | 2,900 (+4%) | 21mo | $210,000 | $72 | 48 |
| 27-29 Oliver St | 0.62mi | 6/2.0 (+1) | 2,875 (+3%) | 13mo | $250,000 | $87 | 46 |
| 257 255 Bowman St | 0.57mi | 6/2.0 (+1) | 2,569 (-8%) | 17mo | $210,000 | $82 | 36 |
| 149 151 George Ave | 0.56mi | 6/2.0 (+1) | 2,560 (-9%) | 24mo | $216,000 | $84 | 31 |
| 13-15 John St | 0.63mi | 4/4.0 (-1) | 2,400 (-14%) | 18mo | $165,000 | $69 | 23 |
Match score weights: distance 35% · size 25% · config 20% · recency 20%. Top-matched comps best support the ARV.
Projected returns pro-forma
-3.0% appreciation · 3.0% rent growth · sell at horizon
- IRR
- 48.6%
- Equity multiple
- 3.12×
- Total profit
- $88,894
- Equity at exit
- $22,351
- IRR
- 54.2%
- Equity multiple
- 6.32×
- Total profit
- $223,415
- Equity at exit
- $12,961
Cash invested: $41,972 (down + closing). Projections, not guarantees.
Landlord ↔ Tenant lean methodology
- Overall (STATE)
- 62 Landlord-Friendly
- State Pennsylvania
- 62 Landlord-Friendly · EVEN
- County
- — inherits STATE
- City
- — inherits STATE
ZIP-level market 18705
- Home prices YoY
- -22.7%
- Active inventory
- 74
- Price-to-rent
- 9.0×
Monthly cashflow live
- Estimated rent
- $3,643 high interval (Pro) →
- Mortgage (P&I)
- −$786
- Tax est. 1.5%
- −$187 /mo · $2,248/yr
- Insurance
- −$62
- Flood insurance flood zone
- −$66 /mo · $798/yr
- HOA
- −$0
- Vacancy / Maint / Mgmt
- −$765
- Net cashflow
- $1,776
Break-even live
3-unit breakdown (identical units grouped — click to expand)
| Units | Beds | Baths | Est. rent |
|---|---|---|---|
| 1× unit | 3 | 1 | $1,381 |
| 2× units | 1 | 1 | $2,262 |
| #2 | 1 | 1 | $1,131 |
| #3 | 1 | 1 | $1,131 |
| Total (3 units) | $3,643 | ||
UW: 25.0% down · 7.5% · 30yr · 1.5% tax · 5.0% vac · 8.0% maint · 8.0% mgmt
Financing live
Cash to close
- Down payment
- $37,475
- Closing costs
- $4,497
- Reserves months
- —
- Total cash needed
- —
Loan-product check · same deal, 3 products live
Conventional
25% down · 7.5% · 30yr
- Down + closing
- —
- Monthly P&I
- —
- Monthly cashflow
- —
- DSCR
- —
- Eligible?
- —
Personal DTI + credit; lowest rate.
DSCR
20% down · 8.5% · 30yr
- Down + closing
- —
- Monthly P&I
- —
- Monthly cashflow
- —
- DSCR
- —
- Eligible?
- —
No personal income docs; deal must DSCR.
Hard money
10% down · 12.0% · 12mo
- Down + closing
- —
- Monthly P&I
- —
- Monthly cashflow
- —
- DSCR
- —
- Eligible?
- —
Short-term bridge; refi at stabilization.
Listing history 5 events
-
2026-06-02days on market $149,900 Active 88 DOM
-
2026-06-01days on market $149,900 Active 87 DOM
-
2026-05-31days on market $149,900 Active 86 DOM
-
2026-05-30days on market $149,900 Active 85 DOM
-
2026-03-05$149,900 Active 169-char remark
Show marketing remark (169 chars)
INVESTMENT OPPORTUNITY - HOME IS A TOTAL REHAB. 98 HAS 3 BEDROOM ONE BATH AND 100 HAS TWO ONE BEDROOM ONE BATH APARTMENTS. LARGE LOT WITH OFF STREET PARKING. CALL TODAY!
ⓘ Source: listings_history table (triggers on properties + properties_extension) + one-shot
backfill from property_details.listing_events for pre-trigger history.
Climate risk First Street
- Flood 9/10 Extreme FEMA zone X · 99% chance over 30 yrs
- Wildfire 1/10 Low
- Heat 4/10 Moderate 7 d/yr ≥95°F today · 17 d/yr by 30 yrs out
- Wind 3/10 Moderate 4% chance of damaging wind over 30 yrs
- Air quality 3/10 Moderate 2 unhealthy d/yr today · 4 by 30 yrs out
Nearby sold comps map
Loading sold comps map…
Walkable amenities ~0.75 mi
Loading nearby amenities…
Taxation est. · year 1
- Rental income
- $43,716
- − Mortgage interest
- −$8,397
- − Property taxes
- −$2,248
- − Insurance
- −$1,547
- − Repairs & maintenance
- −$3,497
- − Management
- −$3,497
- − Depreciation
- −$4,361
- Taxable income
- $20,168
- Est. tax owed @ 24.0%
- −$4,840
- After-tax cash flow
- $16,467/yr
For passive investors: Depreciation is non-cash, so a rental often shows a tax loss while cash-flowing — sheltering income. Rental losses are passive: they offset passive income freely, and up to $25,000/yr can offset ordinary (W-2) income if you actively participate and your MAGI is under $100k (phasing out to $0 by $150k); unused losses carry forward. On sale, claimed depreciation is recaptured at up to 25%, and gains may owe capital-gains tax (a 1031 exchange can defer both). Figures are a year-1 estimate at your 24.0% rate — not tax advice; consult a CPA.
Schools (NCES district)
- District
- Wilkes-Barre Area SD
- NCES district ID
- 4226300
- Math proficiency
- 19% ▼ -2.00%
- Reading proficiency
- 32% ▼ -9.00%
- Median HH income
- $37,420
- Composite
- 21.22/100
- National rank
- #8409
- State rank
- #469 of 539 in PA
Livability — Wilkes-Barre
No livability data for this city. (Only ~50 U.S. cities are tracked.)
Census & demographics
- Census place
- Wilkes-Barre, PA
- County
- Luzerne County · 118,885 people
- City population
- 73,981
- Metro
- Scranton--Wilkes-Barre, PA
- Population (ZIP)
- 15,624
- Household income
- $59,344
- Rent vs Own
- Severe rent burden
- 549.0
Population outlook (Luzerne County) Hauer SSP2
- Today (2025)
- 319,505 people
- By 2030
- 319,943 · +0.1%
- By 2040
- 322,643 · +1.0%
- By 2050
- 330,817 · +3.5%
- By 2075
- 379,145 · +18.7%
- By 2100
- 431,908 · +35.2%
Race, ethnicity, and origin ACS 2023
- Neighborhood character
- Predominantly White (68%)
- Race & ethnicity
- White 68% Hispanic / Latino 22% Two or more races 11% Black 4%
- Hispanic origin (detail)
- Mexican 7% Puerto Rican 5% Dominican 9%
- Common ancestry
- Romanian 19% Scotch-Irish 3% Polish 2%
- Foreign-born
- 11% · Canada
- Languages at home
- 79% English-only · Spanish 17% Other Indo-European 2% Russian/Polish/Slavic 1%
Political lean MEDSL · Luzerne
- 2024 margin
- R (+19.2) · D 40.0% · R 59.2%
- 2008→2024 swing
- -27.6pp toward R · 2008: 8.4pp · 2024: -19.2pp
- All cycles
- 2024: R+19.2 2020: R+14.4 2016: R+19.6 2012: D+4.8 2008: D+8.4
Not yet ingested
- Civics
- —
Market trends
- HPI YoY
- ▼ -71.77%
- Current HPI
- 243.9176
- Rent YoY
- —
- Metro
- Scranton--Wilkes-Barre, PA
- State GDP YoY
- ▲ 1.68%
- F500 in state
- 34
Industry mix (Fortune 500 HQ in PA)
| Industry | F500 HQs | Revenue |
|---|---|---|
| Healthcare | 2 | $309B |
|
||
| Insurance | 2 | $27B |
|
||
| Telecommunications / Media | 1 | $124B |
|
||
| Industrial Distribution | 1 | $22B |
|
||
| Financial Services | 1 | $20B |
|
||
| Chemicals / Materials | 1 | $18B |
|
||
Price history
1 event — show timeline
- 2026-03-05 Listed $149,900 GLVRMLS
Property tax history
+20.4%/yrLatest (2026): $10,040 · +0.1% YoY. Source: county tax records.
Cash-flow waterfall
monthlySold comps — $/sqft
last 12 mo · ≤1 miLoading sold comps…