 Triplex
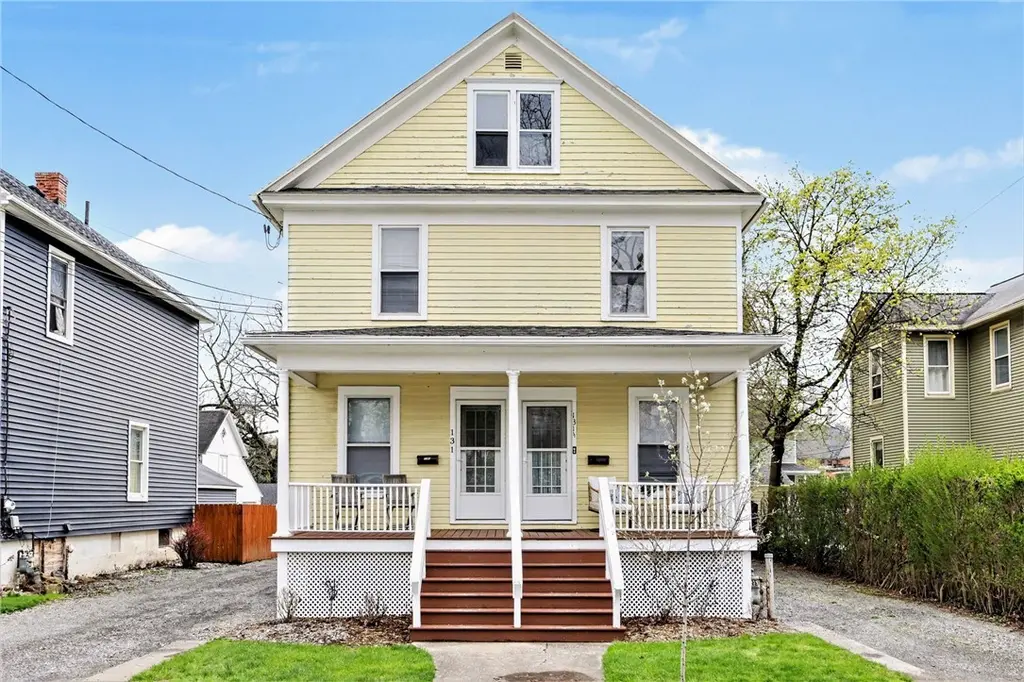
131 Chapin St · Canandaigua, NY
Flood risk 1/10 · Minimal
- FEMA flood zone
- AE
- Chance of flooding over 30 yrs
- 0.0%
- Est. flood insurance / yr
- $2,026 – $9,024
Fire risk 1/10 · Minimal
- Est. fire insurance / yr
- $691 – $1,283
Heat risk 2/10 · Minimal
- Hot days now (above 96°F)
- 7 days/yr
- Hot days in 30 yrs
- 16 days/yr
Wind risk 1/10 · Minimal
- Chance of severe wind over 30 yrs
- —
Air-quality risk 2/10 · Minimal
- Unhealthy air days now
- 0 days/yr
- Unhealthy air days in 30 yrs
- 1 days/yr
Risk factors via First Street. Map © Google.
Why this score? — see what drove the B- grade
The composite is a weighted blend of 9 inputs, each scored 0–100. Each bar is that input's sub-score; the figure is the points it added to the 100-point composite (weight × sub-score).
- Cash flow +30.0/30.0
- 1% rule +10.0/10.0
- DSCR +10.0/10.0
- Schools +4.7/10.0
- Rent growth +4.6/5.0
- ARV discount +3.9/15.0
- Livability +3.8/5.0
- Condition / age +2.5/5.0
- Appreciation +0.0/10.0
$279,900
🖨 Deal sheet 📄 Offer letter ✓ Due diligence
Multi-family units
County records classify this as Multi-Family (2-4 Unit). Listing-text estimate: 3 units. confirmed
Listing remarks MLS
Excellent Owner or Investment-Look at NET operating income-almost $16,000! All apts rented mo/mo, ample storage & attic spc for 2 apts, new flooring, kitchen & windows in apt 1, new appl's in apt 2, new floors & appls in apt 3. New roof, no yard but park nearby, convenient location. Many updates, well taken care of!
Key facts
- Ample parking
- Wrap around driveway
- 5,227 sq ft lot
Tags
Property features AI
Finance
- Other: Three separate gas meters and three separate electric meters; Operating expense details: see remarks
- Financial info: Owner pays trash collection and water; Rent includes trash collection and water; Units generate rental income (example rents listed per unit)
Exterior
- Parking: Gravel parking available with two or more spaces
- Utilities: Electricity connected (circuit breakers); Public water connected; Sewer connected; Cable available; High-speed internet available; Gas water heater
- Home design: Multi-unit property with 3 total units; 2 stories
- Construction: Wood siding; Copper plumbing; Asphalt shingle roof; Poured foundation; Built (existing structure)
- Exterior features: Rectangular residential lot; City street frontage; Walk-up exterior basement access; Sump pump in basement
Interior
- Kitchen: Oven / Range; Refrigerator
- Bedrooms: Two 1-bedroom units (one leased, one month-to-month); One 4-bedroom unit
- Flooring: Carpet; Hardwood; Luxury vinyl; Varied flooring by unit
- Bathrooms: Three full bathrooms (one in each unit)
- Heating & cooling: Gas forced-air heating; Has heating
- Interior features: Ceiling fans; Thermal windows
- Laundry & utility: Washer and Dryer in units
Neighborhood map
What this means for you Summary
Snapshot
- This is a 3 × 2-bed/1.0-bath units multifamily listed at $280k.
Deal economics
- At list price, monthly cash flow is $967 ($12k/yr) — positive. Per door: $322/mo.
- The deal already cash-flows at list — no discount required.
- Meets the 1% rule at list price ($4k rent vs $280k).
- Cap rate 12.4% vs local median 3.4% in Canandaigua — top-decile yield for the area; either an underpriced asset or a hidden risk that comps aren't pricing in. Stress-test before assuming the spread holds.
Location & tenants
- Location reads 75/100 on livability (#243 in NY, #3,822 nationally) — a middle-class / working-renter tenant base. Strengths: commute A+, housing A+, schools B+; Watch: employment C-, amenities F, health & safety D-.
- Canandaigua City School District (suburban): math 50% / reading 59% proficiency, ranked #305 of 590 in NY (top 52%) — acceptable for families but not a draw, mixed tenant base, ~2y average lease.
- Market conditions: Rents rising fast (+8.5%/yr); 223 active listings in the ZIP; 1 comparable units currently listed for rent nearby; solid renter incomes; 284 units permitted in Ontario County in 2024 (69 in 5+ unit buildings).
- At $4,259/mo this rent would consume 64% of the median local household income ($80k/yr) (locally 737% of renters already pay >50% of income on rent) — very limited rent-growth headroom before tenants either downsize or default.
Forward outlook
- Local home prices are declining (-3.0%/yr); year-one equity from $2k of loan paydown is wiped out by about $8k of value loss. Plan a longer hold.
- Ontario County population projected to shrink 6% by 2050 — rents likely to lag national; underwrite the cash flow, not the appreciation.
- At projected returns (-3.0% appreciation + 8.0% rent growth), your $78k cash investment doubles in ~6 years — after that, you're playing with house money.
Negotiation context
- Only 10 days on market — expect competitive offers; lowballing is unlikely to land.
- 2 sale attempts since 17y ago with the ask held roughly flat each time — persistent listings suggest the price (not the market) is what's stuck; bring a comps-based counter.
- Current owner paid $145k; list at $280k implies a 93% gain — meaningful room to come down on a strong offer.
Risks & watch-outs
- Watch-outs: flood insurance adds $460/mo; built in 1920 — expect roof / HVAC / electrical / plumbing capex.
- Climate carrying-cost: in FEMA flood zone AE (mandatory federal flood insurance) — expect insurance premiums to compound above CPI over the hold.
Questions for the listing agent
- Can we see the unit-by-unit rent roll, current vacancy, and any below-market leases? What's the average tenancy length?
- What capital expenditures (roof, boiler, parking lot, exteriors) have been made in the last 5 years, and what's planned in the next 2?
- Built in 1920 — when were the roof, HVAC, electrical panel, plumbing, and water heater last replaced?
- What's the actual annual flood-insurance premium (NFIP or private), and is the property in a SFHA with mandatory coverage?
- Is there a deadline driving the sale (1031 exchange, divorce, estate, relocation)? That informs how much negotiation room exists.
- Schools are B-rated — typically a magnet for longer-tenancy family renters. What's the average tenant stay here, and is there a school-zone premium baked into asking?
- What's the average days-on-market for RENTAL listings here right now (not sales)? A rising rental-DOM trend means longer vacancies and softer asking-rent achievability than the comps imply.
- What's the recent tenant-quality profile in this submarket — average credit score on applications, eviction rate, late-payment / NSF rate, and stable-employment percentage? A property-management company in the area should have these aggregated.
- How much new apartment / multifamily construction is in the pipeline within 1–3 miles? Heavy new supply (>2% of stock underway) typically softens rents 12–24 months out; light construction supports rent growth.
Investment metrics
- 1% rule
- 1.52% ✓
- Cap rate
- 12.41%
- Cash-on-cash
- 21.85%
- DSCR
- 1.97
- GRM
- 5.5
CMA / ARV
- ARV (on-the-fly)
- $259,072
- Comps found
- 3
Show comp detail 3 sales within ~0.75 mi
| Address | Dist | Beds/Ba | Sqft | Sold | Price | $/sf | Match |
|---|---|---|---|---|---|---|---|
| 73 W Gibson St | 0.28mi | 6/2.0 | 2,506 (-11%) | 12mo | $230,000 | $92 | 55 |
| 81 Chapin St | 0.11mi | 5/2.0 (-1) | 2,394 (-15%) | 18mo | $175,000 | $73 | 46 |
| 29 Dungan St | 0.55mi | 6/3.0 | 2,992 (+6%) | 24mo | $340,000 | $114 | 44 |
Match score weights: distance 35% · size 25% · config 20% · recency 20%. Top-matched comps best support the ARV.
Projected returns pro-forma
-3.0% appreciation · 8.0% rent growth · sell at horizon
- IRR
- 11.8%
- Equity multiple
- 1.50×
- Total profit
- $39,074
- Equity at exit
- $41,734
- IRR
- 24.9%
- Equity multiple
- 3.77×
- Total profit
- $217,170
- Equity at exit
- $24,201
Cash invested: $78,372 (down + closing). Projections, not guarantees.
Landlord ↔ Tenant lean methodology
- Overall (STATE)
- 15 Strongly Tenant-Friendly
- State New York
- 15 Strongly Tenant-Friendly · D+10
- County
- — inherits STATE
- City
- — inherits STATE
ZIP-level market 14424
- Home prices YoY
- -21.2%
- Rents YoY
- 8.5%
- Active inventory
- 223
- Price-to-rent
- 16.4×
Monthly cashflow live
- Estimated rent
- $4,259 medium interval (Pro) →
- Mortgage (P&I)
- −$1,468
- Tax from tax record
- −$353 /mo · $4,236/yr
- Insurance
- −$117
- Flood insurance flood zone
- −$460 /mo · $5,525/yr
- HOA
- −$0
- Vacancy / Maint / Mgmt
- −$894
- Net cashflow
- $967
Break-even live
3-unit breakdown (identical units grouped — click to expand)
| Units | Beds | Baths | Est. rent |
|---|---|---|---|
| 3× units | 2 | 1 | $4,260 |
| #1 | 2 | 1 | $1,420 |
| #2 | 2 | 1 | $1,420 |
| #3 | 2 | 1 | $1,420 |
| Total (3 units) | $4,259 | ||
UW: 25.0% down · 7.5% · 30yr · 1.5% tax · 5.0% vac · 8.0% maint · 8.0% mgmt
Financing live
Cash to close
- Down payment
- $69,975
- Closing costs
- $8,397
- Reserves months
- —
- Total cash needed
- —
Loan-product check · same deal, 3 products live
Conventional
25% down · 7.5% · 30yr
- Down + closing
- —
- Monthly P&I
- —
- Monthly cashflow
- —
- DSCR
- —
- Eligible?
- —
Personal DTI + credit; lowest rate.
DSCR
20% down · 8.5% · 30yr
- Down + closing
- —
- Monthly P&I
- —
- Monthly cashflow
- —
- DSCR
- —
- Eligible?
- —
No personal income docs; deal must DSCR.
Hard money
10% down · 12.0% · 12mo
- Down + closing
- —
- Monthly P&I
- —
- Monthly cashflow
- —
- DSCR
- —
- Eligible?
- —
Short-term bridge; refi at stabilization.
Rent comps 1 comps
| Address | Beds | Baths | Sqft | Rent | $/sqft | DOM | Units | Dist |
|---|---|---|---|---|---|---|---|---|
| 81 Pleasant St Canandaigua, NY | 5.0 | 2.0 | 2132 | $2,800 | $1.31 | 2d | 1 | 0.47mi |
Listing history 7 events
-
2026-05-01status Pending
-
2026-04-21$279,900 Active
-
2010-01-08soldstatus $145,000 335-char remark
Show marketing remark (335 chars)
Excellent Owner or Investment-Look at NET operating income-almost $16,000! All apts rented mo/mo, ample storage & attic spc for 2 apts, new flooring, kitchen & windows in apt 1, new appl's in apt 2, new floors & appls in apt 3. New roof, no yard but park nearby, convenient location. Many updates, well taken care of!
-
2010-01-08soldstatus $145,000
Show marketing remark (335 chars)
Excellent Owner or Investment-Look at NET operating income-almost $16,000! All apts rented mo/mo, ample storage & attic spc for 2 apts, new flooring, kitchen & windows in apt 1, new appl's in apt 2, new floors & appls in apt 3. New roof, no yard but park nearby, convenient location. Many updates, well taken care of!
-
2009-04-20$154,900 335-char remark
Show marketing remark (335 chars)
Excellent Owner or Investment-Look at NET operating income-almost $16,000! All apts rented mo/mo, ample storage & attic spc for 2 apts, new flooring, kitchen & windows in apt 1, new appl's in apt 2, new floors & appls in apt 3. New roof, no yard but park nearby, convenient location. Many updates, well taken care of!
-
2006-04-20soldstatus $100,000
-
1996-01-31soldstatus $97,000
ⓘ Source: listings_history table (triggers on properties + properties_extension) + one-shot
backfill from property_details.listing_events for pre-trigger history.
Tax reassessment forecast NY · Partial reset (capped growth)
- Current annual tax
- $4,236 · $353/mo
- Projected year-2 tax
- $4,483 · $374/mo
- Expected delta
- +$247/yr (+$21/mo · 5.8%)
ⓘ Screening estimate from a state-policy table — verify with the county assessor before closing.
Climate risk First Street
- Flood 1/10 Low FEMA zone AE · 0% chance over 30 yrs
- Wildfire 1/10 Low
- Heat 2/10 Low 7 d/yr ≥96°F today · 16 d/yr by 30 yrs out
- Wind 1/10 Low
- Air quality 2/10 Low 0 unhealthy d/yr today · 1 by 30 yrs out
Nearby sold comps map
Loading sold comps map…
Walkable amenities ~0.75 mi
Loading nearby amenities…
Taxation est. · year 1
- Rental income
- $51,108
- − Mortgage interest
- −$15,679
- − Property taxes
- −$4,236
- − Insurance
- −$6,925
- − Repairs & maintenance
- −$4,089
- − Management
- −$4,089
- − Depreciation
- −$8,143
- Taxable income
- $7,949
- Est. tax owed @ 24.0%
- −$1,908
- After-tax cash flow
- $9,693/yr
For passive investors: Depreciation is non-cash, so a rental often shows a tax loss while cash-flowing — sheltering income. Rental losses are passive: they offset passive income freely, and up to $25,000/yr can offset ordinary (W-2) income if you actively participate and your MAGI is under $100k (phasing out to $0 by $150k); unused losses carry forward. On sale, claimed depreciation is recaptured at up to 25%, and gains may owe capital-gains tax (a 1031 exchange can defer both). Figures are a year-1 estimate at your 24.0% rate — not tax advice; consult a CPA.
Schools (NCES district)
- District
- Canandaigua City School District
- NCES district ID
- 3606330
- Math proficiency
- 50% ▼ -10.00%
- Reading proficiency
- 59% ▲ 4.00%
- Median HH income
- $56,375
- Composite
- 47.09/100
- National rank
- #2335
- State rank
- #305 of 590 in NY
Livability — Canandaigua
- Score
- 75/100
- State rank
- #243
- US rank
- #3822
Category grades
Schools grade is shown separately in the Schools card above.
Census & demographics
- Census place
- Canandaigua, NY
- County
- Ontario County · 58,989 people
- City population
- 28,786
- Metro
- Rochester, NY
- Population (ZIP)
- 28,786
- Household income
- $79,778
- Rent vs Own
- Severe rent burden
- 737.0
Population outlook (Ontario County) Hauer SSP2
- Today (2025)
- 111,230 people
- By 2030
- 111,401 · +0.2%
- By 2040
- 109,535 · -1.5%
- By 2050
- 104,895 · -5.7%
- By 2075
- 92,999 · -16.4%
- By 2100
- 73,723 · -33.7%
Race, ethnicity, and origin ACS 2023
- Neighborhood character
- Predominantly White (90%)
- Race & ethnicity
- White 90% Hispanic / Latino 5% Two or more races 5% Black 1%
- Common ancestry
- Romanian 4% Iranian 4% Slovak 3%
- Foreign-born
- 3% · Canada
- Languages at home
- 94% English-only · Spanish 3% German/W. Germanic 1% Arabic 1%
Political lean MEDSL · Ontario
- 2024 margin
- Toss-up / Even · D 49.4% · R 50.6%
- 2008→2024 swing
- -1.0pp toward R · 2008: -0.1pp · 2024: -1.2pp
- All cycles
- 2024: R+1.2 2020: R+0.0 2016: R+8.6 2012: R+1.6 2008: R+0.1
Not yet ingested
- Civics
- —
Market trends
- HPI YoY
- ▼ -70.94%
- Current HPI
- 263.755
- Rent YoY
- ▲ 8.46%
- Metro
- Rochester, NY
- State GDP YoY
- ▲ 2.60%
- F500 in state
- 92
Industry mix (Fortune 500 HQ in NY)
| Industry | F500 HQs | Revenue |
|---|---|---|
| Financial Services | 10 | $950B |
|
||
| Consumer Goods | 9 | $162B |
|
||
| Insurance | 4 | $225B |
|
||
| Telecommunications | 2 | $144B |
|
||
| Pharmaceuticals | 2 | $112B |
|
||
| Media / Entertainment | 2 | $69B |
|
||
Price history
+188.6% since first listed7 events — show timeline
- 2026-05-01 Pending — UNYREIS
- 2026-04-21 Listed $279,900 UNYREIS
- 2010-01-08 Sold (Public Records) $145,000 Public Records
- 2010-01-08 Sold (MLS) $145,000 UNYREIS
- 2009-04-20 Listed $154,900 UNYREIS
- 2006-04-20 Sold (Public Records) $100,000 Public Records
- 1996-01-31 Sold (Public Records) $97,000 Public Records
Property tax history
+3.6%/yrLatest (2025): $4,236 · -1.9% YoY. Source: county tax records.
Cash-flow waterfall
monthlySold comps — $/sqft
last 12 mo · ≤1 miLoading sold comps…