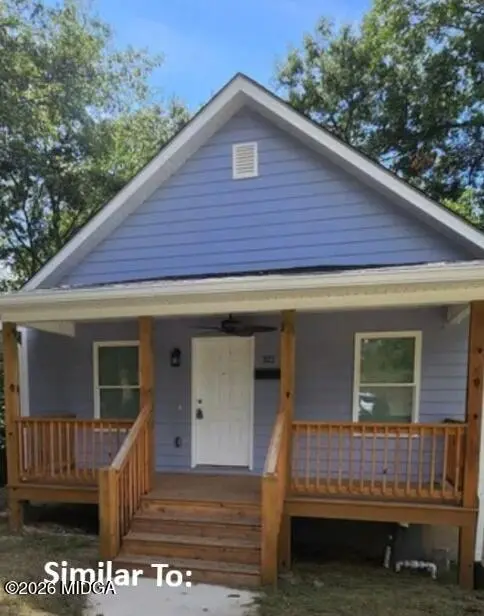
321 Madison St · Macon-Bibb County, GA
Flood risk 1/10 · Minimal
- FEMA flood zone
- X (unshaded)
- Chance of flooding over 30 yrs
- 0.0%
- Est. flood insurance / yr
- $507 – $1,088
Fire risk 1/10 · Minimal
- Est. fire insurance / yr
- $963 – $1,789
Heat risk 7/10 · Major
- Hot days now (above 108°F)
- 7 days/yr
- Hot days in 30 yrs
- 18 days/yr
Wind risk 6/10 · Moderate
- Chance of severe wind over 30 yrs
- 65.0%
Air-quality risk 4/10 · Minor
- Unhealthy air days now
- 5 days/yr
- Unhealthy air days in 30 yrs
- 5 days/yr
Risk factors via First Street. Map © Google.
Why this score? — see what drove the D grade
The composite is a weighted blend of 9 inputs, each scored 0–100. Each bar is that input's sub-score; the figure is the points it added to the 100-point composite (weight × sub-score).
- Cash flow +15.6/30.0
- ARV discount +7.5/15.0
- DSCR +4.8/10.0
- 1% rule +3.7/10.0
- Rent growth +2.9/5.0
- Livability +2.5/5.0
- Condition / age +2.5/5.0
- Schools +1.2/10.0
- Appreciation +0.0/10.0
$137,000
🖨 Deal sheet (PDF) 📄 Offer letter ✓ Due diligence
Listing remarks MLS
Charming 2-bedroom, 2-bath home featuring stylish LVP flooring throughout and a functional open layout. The kitchen is equipped with stainless steel appliances, and the washer and dryer will remain with the property for added convenience. Enjoy outdoor living on the spacious deck overlooking a fenced backyard, perfect for entertaining, pets, or relaxing evenings. Conveniently located just a short distance from Mercer University and Atrium Health Navicent, offering easy access to dining, shopping, medical facilities, and campus activities.
Key facts
- Open layout
- Spacious deck
- Lvp flooring
Tags
Property features AI
Finance
- Other: Lot approximately 0.12 acres; Located in Collinsville subdivision; Address: 321 Madison Street, Macon, GA 31210
- HOA & community: No HOA
Exterior
- Parking: Open parking with a parking pad
- Security: Security system
- Utilities: Public water; Public sewer; Cable available; Electricity available; Natural gas available
- Home design: Single-family house; One story; Resale property
- Construction: Built in 2021; Composition roof; Block foundation; Other construction materials
- Exterior features: Deck; Fenced yard
Interior
- Kitchen: Microwave; Refrigerator
- Bedrooms: 2 bedrooms on the main level
- Flooring: Other flooring
- Bathrooms: 2 full bathrooms, both on the main level
- Heating & cooling: Central heating; Central air conditioning
- Interior features: High ceilings; Dining room and living room combo; No basement
- Laundry & utility: Laundry located in hall
Neighborhood map
What this means for you Summary
Snapshot
- This is a 2-bed/2.0-bath single-family listed at $137k.
Deal economics
- At list price, monthly cash flow is $59 ($705/yr) — positive.
- The deal already cash-flows at list — no discount required.
- To meet the 1% rule (rent ≥ 1% of price), the offer needs to be $120k (12.5% below list).
- Recommended offer: $120k (12.5% below list) — sets the bar for 1% rule.
- Cap rate 6.8% vs local median 5.5% in Macon-Bibb County — meaningfully above typical; check what's discounted (condition, days-on-market, listing class) to confirm the premium yield is real.
Location & tenants
- Location reads: area grade D — affects rentability + tenant quality, not the cash-flow math above.
- Bibb County (urban): math 11% / reading 18% proficiency, ranked #161 of 174 in GA (top 92%) — low school quality limits family demand, transient renter base, plan for 1-2y turnover; 75% free/reduced lunch — lower-income household profile, screen leases tightly.
- Zoned schools: Williams Elementary School (math 2% / reading 8%, grade F, #1,160 of 1,228 statewide, top 98%, 349 students, 100% FRL); Miller Magnet Middle School (math 16% / reading 33%, grade F, #301 of 470 statewide, top 66%, 585 students, 100% FRL); Central High School (math 8% / reading 2%, grade F, #394 of 424 statewide, top 97%, 844 students, 100% FRL) — zoned schools average 100% FRL vs 75% district-wide (25 pts higher); higher-poverty schools than district average — tighter screening recommended.
- Market conditions: Rents rising (+1.7%/yr); 238 active listings in the ZIP; 40 comparable units currently listed for rent nearby; rentals at typical pace (median 23d on market — plan ~3-4 weeks tenant-placement turnaround); 45% of comp listings sitting > 30 days — soft ceiling on asking rent; solid renter incomes; 154 units permitted in Bibb County in 2024 (0 in 5+ unit buildings).
Forward outlook
- Local home prices are declining (-3.0%/yr); year-one equity from $947 of loan paydown is wiped out by about $4k of value loss. Plan a longer hold.
- Bibb County population projected at -12% by 2050 — secular population decline; favor cash flow + early exit over multi-decade hold.
Negotiation context
- It's been on market 20 days — a 2% lower offer ($135k) is reasonable based on typical stale-listing flexibility.
- 5 sale attempts since 4y ago; this cycle's ask has dropped $23k (14%) from the opening price — seller is motivated, your offer sets the floor, not the list.
Risks & watch-outs
- Climate carrying-cost: major wind risk, 65% chance of damaging wind over 30y; extreme-heat days projected 7→18/yr by 2055 (HVAC capex compounding) — expect insurance premiums to compound above CPI over the hold.
Questions for the listing agent
- Is there a deadline driving the sale (1031 exchange, divorce, estate, relocation)? That informs how much negotiation room exists.
- The area grade is low — what's the realistic commute time and amenity access for the typical tenant pool here? Any planned neighborhood developments (good or bad) we should know about?
- What's the average days-on-market for RENTAL listings here right now (not sales)? A rising rental-DOM trend means longer vacancies and softer asking-rent achievability than the comps imply.
- What's the recent tenant-quality profile in this submarket — average credit score on applications, eviction rate, late-payment / NSF rate, and stable-employment percentage? A property-management company in the area should have these aggregated.
- How much new for-sale + rental construction is in the pipeline within 1–3 miles? Heavy new supply typically softens prices + rents 12–24 months out; constrained supply supports both.
Investment metrics
- 1% rule
- 0.87% ✗
- Cap rate
- 6.81%
- Cash-on-cash
- 1.84%
- DSCR
- 1.08
- GRM
- 9.5
CMA / ARV
- ARV (on-the-fly)
- $62,124
- Comps found
- 12
Show comp detail 12 sales within ~0.75 mi
| Address | Dist | Beds/Ba | Sqft | Sold | Price | $/sf | Match |
|---|---|---|---|---|---|---|---|
| 1554 Walnut St | 0.26mi | 2/1.0 | 1,008 (+1%) | 1mo | $35,000 | $35 | 82 |
| 191 Madison St | 0.14mi | 2/1.0 | 1,024 (+2%) | 10mo | $30,000 | $29 | 78 |
| 349 Madison St | 0.04mi | 2/1.0 | 896 (-11%) | 2mo | $26,000 | $29 | 74 |
| 273 Madison St | 0.06mi | 3/2.0 (+1) | 1,056 (+5%) | 20mo | $125,000 | $118 | 66 |
| 1438 2nd Ave | 0.13mi | 2/1.0 | 894 (-11%) | 13mo | $15,000 | $17 | 61 |
| 827 Tattnall St | 0.53mi | 2/2.0 | 918 (-8%) | 2mo | $145,000 | $158 | 60 |
| 295 Moughon St | 0.50mi | 3/1.0 (+1) | 1,015 (+1%) | 20mo | $62,700 | $62 | 49 |
| 293 Moughon St | 0.50mi | 3/1.0 (+1) | 1,015 (+1%) | 20mo | $62,700 | $62 | 49 |
| 195 Forest Ave | 0.63mi | 2/2.0 | 872 (-13%) | 7mo | $17,000 | $19 | 43 |
| 1930 Mallory Dr | 0.72mi | 3/1.0 (+1) | 1,029 (+3%) | 15mo | $72,900 | $71 | 41 |
| 1959 3rd Ave | 0.51mi | 2/1.0 | 902 (-10%) | 21mo | $27,500 | $30 | 38 |
| 1930 Northbrook Ave | 0.73mi | 3/1.0 (+1) | 1,071 (+7%) | 9mo | $130,000 | $121 | 38 |
Match score weights: distance 35% · size 25% · config 20% · recency 20%. Top-matched comps best support the ARV.
Projected returns pro-forma
-3.0% appreciation · 1.71% rent growth · sell at horizon
- IRR
- -14.8%
- Equity multiple
- 0.48×
- Total profit
- $-20,012
- Equity at exit
- $20,427
- IRR
- -8.3%
- Equity multiple
- 0.51×
- Total profit
- $-18,821
- Equity at exit
- $11,845
Cash invested: $38,360 (down + closing). Projections, not guarantees.
Landlord ↔ Tenant lean methodology
- Overall (STATE)
- 90 Strongly Landlord-Friendly
- State Georgia
- 90 Strongly Landlord-Friendly · R+3
- County
- — inherits STATE
- City
- — inherits STATE
ZIP-level market 31210
- Rents YoY
- 1.7%
- Active inventory
- 238
- Price-to-rent
- 9.5×
Monthly cashflow live
- Estimated rent
- $1,198 high interval (Pro) →
- Mortgage (P&I)
- −$718
- Tax from tax record
- −$112 /mo · $1,348/yr
- Insurance
- −$57
- HOA
- −$0
- Vacancy / Maint / Mgmt
- −$252
- Net cashflow
- $59
Break-even live
Sensitivity live
| Price | -10% $136 | -5% $98 | +0% $59 | +5% $20 | +10% $-19 |
|---|---|---|---|---|---|
| Rent | -10% $-36 | -5% $11 | +0% $59 | +5% $106 | +10% $153 |
| Rate | -1.0pp $128 | -0.5pp $94 | base $59 | +0.5pp $23 | +1.0pp $-13 |
UW: 25.0% down · 7.5% · 30yr · 1.5% tax · 5.0% vac · 8.0% maint · 8.0% mgmt
Financing live
Cash to close
- Down payment
- $34,250
- Closing costs
- $4,110
- Reserves months
- —
- Total cash needed
- —
Loan-product check · same deal, 3 products live
Conventional
25% down · 7.5% · 30yr
- Down + closing
- —
- Monthly P&I
- —
- Monthly cashflow
- —
- DSCR
- —
- Eligible?
- —
Personal DTI + credit; lowest rate.
DSCR
20% down · 8.5% · 30yr
- Down + closing
- —
- Monthly P&I
- —
- Monthly cashflow
- —
- DSCR
- —
- Eligible?
- —
No personal income docs; deal must DSCR.
Hard money
10% down · 12.0% · 12mo
- Down + closing
- —
- Monthly P&I
- —
- Monthly cashflow
- —
- DSCR
- —
- Eligible?
- —
Short-term bridge; refi at stabilization.
Rent comps 40 comps
| Address | Beds | Baths | Sqft | Rent | $/sqft | DOM | Units | Dist |
|---|---|---|---|---|---|---|---|---|
| 391 Madison St Macon, GA | 3.0 | 2.0 | 1236 | $1,350 | $1.09 | 15d | 1 | 0.09mi |
| 347 College St Macon, GA | 2.0 | 1.0–2.0 | 725 | $2,600 | $3.59 | 15d | 4 | 0.11mi |
| 1417 Woodliff St Macon, GA | 3.0 | 1.0 | 908 | $1,100 | $1.21 | 23d | 1 | 0.18mi |
| 1094 Georgia Ave Unit C Macon, GA | 1.0 | 1.0 | 1125 | $1,350 | $1.20 | 15d | 1 | 0.25mi |
| 218 Orange St Macon, GA | 2.0 | 1.0 | 1100 | $1,300 | $1.18 | 23d | 1 | 0.28mi |
| 147 Orange St Macon, GA | 3.0 | 2.0 | 1500 | $1,695 | $1.13 | 15d | 1 | 0.32mi |
| 991 Magnolia St Unit 3 Macon, GA | 1.0 | 1.0 | 800 | $750 | $0.94 | 45d | 1 | 0.35mi |
| 952 Georgia Ave Unit 3 Macon, GA | 2.0 | 1.0 | 900 | $950 | $1.06 | 15d | 1 | 0.39mi |
| 952 Georgia Ave Macon, GA | 2.0 | 2.0 | 1115 | $1,295 | $1.16 | 45d | 1 | 0.39mi |
| 941 Hill Park Unit 2 Macon, GA | 2.0 | 1.0 | 800 | $850 | $1.06 | 23d | 1 | 0.42mi |
| 955 Walnut St Unit B Macon, GA | 2.0 | 1.0 | 840 | $1,075 | $1.28 | 45d | 1 | 0.46mi |
| 384 Spring St Unit 1 Macon, GA | 3.0 | 2.0 | 1200 | $1,250 | $1.04 | 45d | 1 | 0.47mi |
| 455 Pursley St Macon, GA | 1.0 | 1.0 | 850 | $625 | $0.74 | 23d | 9 | 0.47mi |
| 455 Pursley St Apt B15 Macon, GA | 1.0 | 1.0 | 850 | $650 | $0.76 | 15d | 1 | 0.47mi |
| 895 Mulberry St Unit A Macon, GA | 1.0 | 1.0 | 807 | $1,075 | $1.33 | 45d | 1 | 0.48mi |
| 285 Moughon St Macon, GA | 3.0 | 1.0 | 1015 | $900 | $0.89 | 15d | 1 | 0.49mi |
| 1975 Vineville Ave Macon, GA | 1.0–3.0 | 1.0 | 1050 | $825 | $0.79 | 23d | 5 | 0.50mi |
| 1975 Vineville Ave Apt F3 Macon, GA | 1.0 | 1.0 | 950 | $700 | $0.74 | 15d | 1 | 0.50mi |
| 888 Walnut Street Ln Macon, GA | 1.0 | 1.0 | 765 | $925 | $1.21 | 45d | 1 | 0.50mi |
| 841 Forsyth St Macon, GA | 1.0 | 1.0 | 780 | $1,400 | $1.79 | 45d | 1 | 0.57mi |
| 813 Forsyth St Unit C Macon, GA | 2.0 | 2.0 | 1105 | $1,400 | $1.27 | 15d | 1 | 0.58mi |
| 1121 Columbus St Unit A Macon, GA | 1.0 | 1.0 | 900 | $1,250 | $1.39 | 15d | 1 | 0.64mi |
| 484 1st St #300 Macon, GA | 2.0 | 1.0 | 1400 | $1,625 | $1.16 | 15d | 1 | 0.70mi |
| 867 Orange Ter #2 Macon, GA | 2.0 | 1.0 | 1088 | $1,500 | $1.38 | 45d | 1 | 0.70mi |
| 867 Orange Ter Unit B Macon, GA | 2.0 | 2.0 | 1088 | $1,400 | $1.29 | 45d | 1 | 0.70mi |
| 2063 Vineville Ave Unit N5 Macon, GA | 3.0 | 2.0 | 1169 | $1,200 | $1.03 | 23d | 1 | 0.71mi |
| 1930 Northbrook Ave Macon, GA | 3.0 | 1.0 | 1071 | $1,400 | $1.31 | 15d | 1 | 0.74mi |
| 1930 Northbrook Ave Macon, GA | 3.0 | 1.0 | 1071 | $1,400 | $1.31 | 45d | 1 | 0.74mi |
| 610 Mulberry St Unit 7 Macon, GA | 1.0 | 1.0 | 871 | $1,475 | $1.69 | 45d | 1 | 0.77mi |
| 610 Mulberry St Unit 6 Macon, GA | 1.0 | 1.0 | 778 | $1,600 | $2.06 | 45d | 1 | 0.77mi |
| 610 Mulberry St Unit 5 Macon, GA | 1.0 | 1.0 | 776 | $1,375 | $1.77 | 45d | 1 | 0.77mi |
| 957 New St Macon, GA | 2.0 | 1.5 | 1200 | $1,050 | $0.88 | 15d | 1 | 0.80mi |
| 530 2nd St Unit B Macon, GA | 1.0 | 1.0 | 760 | $1,275 | $1.68 | 15d | 1 | 0.80mi |
| 1232 Shamrock St Macon, GA | 3.0 | 2.0 | 1282 | $1,700 | $1.33 | 15d | 1 | 0.84mi |
| 1268 College St Unit 1 Macon, GA | 2.0 | 2.0 | 1500 | $1,730 | $1.15 | 45d | 1 | 0.86mi |
| 1227 Calhoun St Macon, GA | 2.0 | 1.5 | 1212 | $1,200 | $0.99 | 45d | 1 | 0.88mi |
| 1249 Duncan Ave Unit C Macon, GA | 2.0 | 2.0 | 900 | $795 | $0.88 | 45d | 1 | 0.89mi |
| 1249 Duncan Ave Unit B Macon, GA | 2.0 | 2.0 | 700 | $1,095 | $1.56 | 45d | 1 | 0.89mi |
| 526 3rd St Unit 3 Macon, GA | 1.0 | 1.0 | 1000 | $1,295 | $1.29 | 45d | 1 | 0.90mi |
| 476 3rd St Macon, GA | 2.0 | 1.0 | 942 | $1,850 | $1.96 | 15d | 8 | 0.92mi |
Listing history 15 events
-
2026-06-21days on market $137,000 Active 20 DOM
-
2026-06-19days on market $137,000 Active 18 DOM
-
2026-06-18days on market $137,000 Active 17 DOM
-
2026-06-17days on market $137,000 Active 16 DOM
-
2026-06-16days on market $137,000 Active 15 DOM
-
2026-06-15days on market $137,000 Active 14 DOM
-
2026-06-14statusdays on market $137,000 Active 12 DOM
-
2026-06-13pricestatusdays on market $137,000 Price Change 11 DOM
-
2026-06-10days on market $159,000 New 9 DOM
-
2026-06-09days on market $159,000 New 8 DOM
-
2026-06-08days on market $159,000 New 7 DOM
-
2026-06-07days on market $159,000 New 6 DOM
-
2026-06-03days on market $159,000 New 2 DOM
-
2026-06-02remarks 544-char remark
-
2026-06-02$159,000 New 1 DOM
ⓘ Source: listings_history table (triggers on properties + properties_extension) + one-shot
backfill from property_details.listing_events for pre-trigger history.
Tax reassessment forecast GA · Resets to sale price
- Current annual tax
- $1,348 · $112/mo
- Projected year-2 tax
- $1,348 · $112/mo
- Expected delta
- $0/yr ($0/mo · 0.0%)
ⓘ Screening estimate from a state-policy table — verify with the county assessor before closing.
Climate risk First Street
- Flood 1/10 Low FEMA zone X (unshaded) · 0% chance over 30 yrs
- Wildfire 1/10 Low
- Heat 7/10 Severe 7 d/yr ≥108°F today · 18 d/yr by 30 yrs out
- Wind 6/10 Major 65% chance of damaging wind over 30 yrs
- Air quality 4/10 Moderate 5 unhealthy d/yr today · 5 by 30 yrs out
Nearby sold comps map
Loading sold comps map…
Walkable amenities ~0.75 mi
Loading nearby amenities…
Taxation est. · year 1
- Rental income
- $14,379
- − Mortgage interest
- −$7,674
- − Property taxes
- −$1,348
- − Insurance
- −$685
- − Repairs & maintenance
- −$1,150
- − Management
- −$1,150
- − Depreciation
- −$3,985
- Taxable loss
- −$1,614
- Est. tax savings @ 24.0%
- +$387
- After-tax cash flow
- $1,092/yr
For passive investors: Depreciation is non-cash, so a rental often shows a tax loss while cash-flowing — sheltering income. Rental losses are passive: they offset passive income freely, and up to $25,000/yr can offset ordinary (W-2) income if you actively participate and your MAGI is under $100k (phasing out to $0 by $150k); unused losses carry forward. On sale, claimed depreciation is recaptured at up to 25%, and gains may owe capital-gains tax (a 1031 exchange can defer both). Figures are a year-1 estimate at your 24.0% rate — not tax advice; consult a CPA.
Schools (NCES district)
- District
- Bibb County
- NCES district ID
- 1300420
- Math proficiency
- 11% ▼ -14.00%
- Reading proficiency
- 18% ▼ -11.00%
- Median HH income
- $37,426
- Composite
- 12.13/100
- National rank
- #9654
- State rank
- #161 of 174 in GA
Livability — Macon-Bibb County
No livability data for this city. (Only ~50 U.S. cities are tracked.)
Census & demographics
- Census place
- Macon-Bibb County, GA
- County
- Bibb County · 164,332 people
- City population
- 143,186
- Metro
- Macon-Bibb County, GA
- Population (ZIP)
- 33,288
- Household income
- $78,447
- Rent vs Own
- Severe rent burden
- 1845.0
Population outlook (Bibb County) Hauer SSP2
- Today (2025)
- 148,772 people
- By 2030
- 145,904 · -1.9%
- By 2040
- 139,404 · -6.3%
- By 2050
- 131,603 · -11.5%
- By 2075
- 111,050 · -25.4%
- By 2100
- 83,346 · -44.0%
Race, ethnicity, and origin ACS 2023
- Neighborhood character
- Diverse neighborhood (Simpson 0.62)
- Race & ethnicity
- White 52% Black 32% Two or more races 7% Hispanic / Latino 6% Asian 4%
- Hispanic origin (detail)
- Mexican 2% Cuban 1%
- Common ancestry
- Slovak 3% Serbian 1% Italian 1%
- Foreign-born
- 5% · Canada, China, South Korea
- Languages at home
- 93% English-only · Spanish 3% Other Indo-European 1% Chinese 1%
Political lean MEDSL · Bibb
- 2024 margin
- Strong D (+22.4) · D 61.0% · R 38.5%
- 2008→2024 swing
- +4.4pp toward D · 2008: 18.0pp · 2024: 22.4pp
- All cycles
- 2024: D+22.4 2020: D+23.8 2016: D+20.2 2012: D+20.0 2008: D+18.0
Not yet ingested
- Civics
- —
Market trends
- HPI YoY
- ▼ -144.60%
- Current HPI
- 172.1313
- Rent YoY
- ▲ 1.71%
- Metro
- Macon-Bibb County, GA
- State GDP YoY
- ▲ 2.66%
- F500 in state
- 28
Industry mix (Fortune 500 HQ in GA)
| Industry | F500 HQs | Revenue |
|---|---|---|
| Paper / Packaging | 2 | $29B |
|
||
| Retail | 1 | $160B |
|
||
| Transportation / Logistics | 1 | $91B |
|
||
| Airlines | 1 | $62B |
|
||
| Consumer Goods | 1 | $47B |
|
||
| Utilities | 1 | $25B |
|
||
Price history
-1.3% since first listed9 events — show timeline
- 2026-06-01 Listed $159,900 MGMLS
- 2026-06-01 Listed $159,000 GAMLS
- 2022-10-21 Sold (MLS) $135,000 GAMLS
- 2022-08-24 Pending — GAMLS
- 2022-08-15 Relisted — GAMLS
- 2022-08-15 Pending — GAMLS
- 2022-07-08 Relisted — GAMLS
- 2022-07-07 Listing Removed — GAMLS
- 2022-01-07 Listed $162,000 GAMLS
Property tax history
+35.4%/yrLatest (2025): $1,348 · +3.9% YoY. Source: county tax records.
Cash-flow waterfall
monthlySold comps — $/sqft
last 12 mo · ≤1 miLoading sold comps…