 Triplex
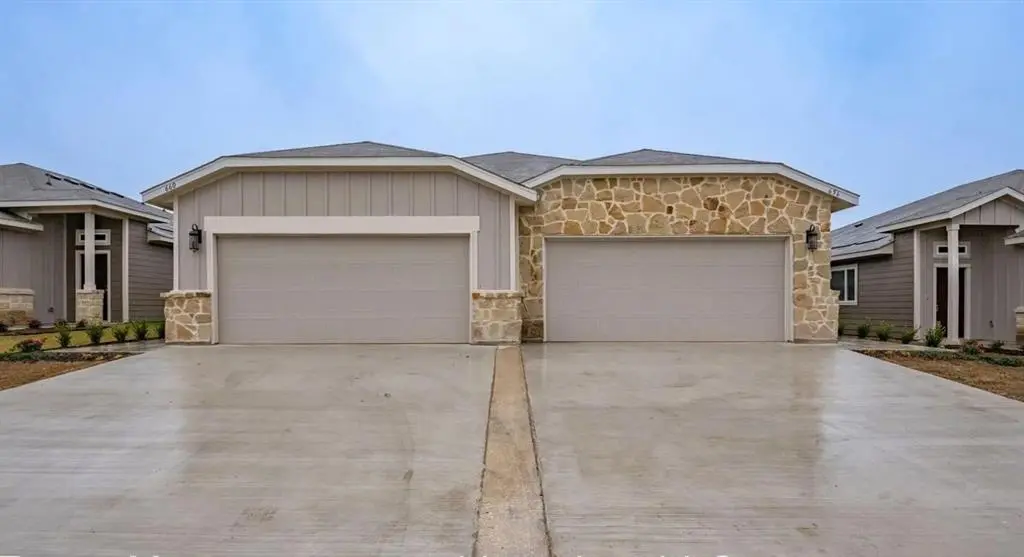
656-660 Wheatfield Dr · Venus, TX
Flood risk No data
- FEMA flood zone
- —
- Chance of flooding over 30 yrs
- —
- Est. flood insurance / yr
- —
Fire risk No data
- Est. fire insurance / yr
- —
Heat risk No data
- Hot days now (above threshold)
- —
- Hot days in 30 yrs
- —
Wind risk No data
- Chance of severe wind over 30 yrs
- —
Air-quality risk No data
- Unhealthy air days now
- —
- Unhealthy air days in 30 yrs
- —
Risk factors via First Street. Map © Google.
Why this score? — see what drove the B grade
The composite is a weighted blend of 9 inputs, each scored 0–100. Each bar is that input's sub-score; the figure is the points it added to the 100-point composite (weight × sub-score).
- Cash flow +25.3/30.0
- Appreciation +8.7/10.0
- DSCR +8.4/10.0
- ARV discount +7.4/15.0
- 1% rule +6.8/10.0
- Schools +4.8/10.0
- Condition / age +4.0/5.0
- Livability +3.5/5.0
- Rent growth +3.1/5.0
$519,000
🖨 Deal sheet 📄 Offer letter ✓ Due diligence
Multi-family units
County records classify this as Multi-Family (2-4 Unit). Listing-text estimate: 3 units. confirmed
Listing remarks
50% Lease! Purchase as your primary home and generate income to help offset your mortgage payment! Prime opportunity to invest in a Class-A luxury duplex in scorching hot DFW market. Strong tenant demand and fast leasing in DFW. Fantastic location across near Google's $600M Data Center. Ellis County has experienced explosive population growth in the last decade. Children attend Midlothian schools. This duplex has two 3-bedroom units with 2 baths. Each unit has a two-car garage and a fenced in back yard. Easy commute to major area employers. Wealth of opportunities to relax & play nearby. Professional property management in place at a favorable rate of 5%.
Key facts
- 8,124 sq ft lot
- 4 garage spots
- Built 2023
Property features AI
Finance
- Financial info: Property listed as residential income (duplex); Two units (one building); Occupancy rate 50%; Gross annual income reported; Gross annual expenses reported; Net operating income reported; Operating expenses include insurance, maintenance, and vacancy allowance; Cap rate 4.92%; Accepts cash and conventional financing
- HOA & community: Mandatory HOA; Annual association fee of 750; HOA covers grounds maintenance; HOA managed by Goodwin Company
Exterior
- Parking: Attached garage; Garage with 4 spaces; 2 parking spaces
- Utilities: City water; City sewer; No municipal utility district
- Home design: Duplex (Residential income); One story; Built in 2023
- Construction: Brick, siding, stone veneer, and wood construction; Composition roof; Slab foundation
- Exterior features: Asphalt surfaces; City water; City sewer
Interior
- Kitchen: Dishwasher; Electric range; Kitchen disposal; Granite counters; Kitchen island; Pantry
- Bedrooms: 6 bedrooms
- Flooring: Carpet; Luxury vinyl plank
- Bathrooms: 4 full bathrooms
- Heating & cooling: Central heating (electric); Central air conditioning
- Interior features: Granite counters; Kitchen island; Open floorplan; Pantry; Walk-in closets
- Laundry & utility: Electric water heater
Neighborhood map
What this means for you Summary
Snapshot
- This is a 3 × 3-bed/2.0-bath units multifamily listed at $519k. Condition is rated good.
Deal economics
- At list price, monthly cash flow is $1k ($14k/yr) — positive. Per door: $395/mo.
- The deal already cash-flows at list — no discount required.
- Meets the 1% rule at list price ($6k rent vs $519k).
- Recommended offer: $503k (3.0% below list) — sets the bar for market timing.
- Cap rate 9.0% vs local median 3.0% in Venus — top-decile yield for the area; either an underpriced asset or a hidden risk that comps aren't pricing in. Stress-test before assuming the spread holds.
Location & tenants
- Location reads 70/100 on livability (#356 in TX) — a middle-class / working-renter tenant base. Strengths: crime A+, employment A+, cost of living A+; Watch: amenities F, commute F, health & safety F.
- Midlothian ISD (suburban): math 53% / reading 52% proficiency, ranked #94 of 826 in TX (top 11%) — acceptable for families but not a draw, mixed tenant base, ~2y average lease.
- Zoned schools: J A Vitovsky El (math 34% / reading 34%, grade F, #2,149 of 4,322 statewide, top 50%, 646 students, 60% FRL) — zoned schools average 60% FRL vs 22% district-wide (38 pts higher); higher-poverty schools than district average — tighter screening recommended.
- Zoned-school proficiency averages 34% at this address vs 52% district-wide (-18 pts) — the specific schools serving this property underperform the Midlothian ISD average; the district grade overstates school quality for this exact location.
- Market conditions: Rents rising (+2.4%/yr); 426 active listings in the ZIP; 2 comparable units currently listed for rent nearby; solid renter incomes; 3,016 units permitted in Ellis County in 2024 (20 in 5+ unit buildings).
- At $6,121/mo this rent would consume 72% of the median local household income ($102k/yr) (locally 70% of renters already pay >50% of income on rent) — very limited rent-growth headroom before tenants either downsize or default.
Forward outlook
- In year one you build about $42k of equity ($4k loan paydown + $38k appreciation (7.3% local appreciation)).
- Ellis County population projected at +36% by 2050 — long-run rental-demand tailwind backs the buy-and-hold thesis.
- At projected returns (7.3% appreciation + 2.4% rent growth), your $145k cash investment doubles in ~3 years — after that, you're playing with house money.
- By year 2, paydown + projected appreciation supports a ~$67k cash-out refi (75% LTV) — recoverable capital for the next deal without selling this one.
Negotiation context
- It's been on market 45 days — a 3% lower offer ($503k) is reasonable based on typical stale-listing flexibility.
- 5 sale attempts with the ask held roughly flat each time — persistent listings suggest the price (not the market) is what's stuck; bring a comps-based counter.
Questions for the listing agent
- It's been on market 45 days. Have you received any prior offers? Is the seller open to a 3% concession, seller financing, or rate buy-down credit?
- Can we see the unit-by-unit rent roll, current vacancy, and any below-market leases? What's the average tenancy length?
- What capital expenditures (roof, boiler, parking lot, exteriors) have been made in the last 5 years, and what's planned in the next 2?
- What does the HOA fee cover, when was the last increase, and are there any pending special assessments or reserve-fund shortfalls?
- Is there a deadline driving the sale (1031 exchange, divorce, estate, relocation)? That informs how much negotiation room exists.
- Schools are D-rated, which usually means shorter tenancies and higher turnover. Who's the typical renter profile here, and what's been the actual vacancy rate?
- What's the average days-on-market for RENTAL listings here right now (not sales)? A rising rental-DOM trend means longer vacancies and softer asking-rent achievability than the comps imply.
- What's the recent tenant-quality profile in this submarket — average credit score on applications, eviction rate, late-payment / NSF rate, and stable-employment percentage? A property-management company in the area should have these aggregated.
- How much new apartment / multifamily construction is in the pipeline within 1–3 miles? Heavy new supply (>2% of stock underway) typically softens rents 12–24 months out; light construction supports rent growth.
Investment metrics
- 1% rule
- 1.18% ✓
- Cap rate
- 9.03%
- Cash-on-cash
- 9.79%
- DSCR
- 1.44
- GRM
- 7.1
CMA / ARV
- ARV (median comp)
- $517,365
- List price
- $519,000
- Delta
- 0.32%
- Verdict
- FAIR
- Comps
- 20 within 1.0 mi
Show comp detail 12 sales within ~0.75 mi
| Address | Dist | Beds/Ba | Sqft | Sold | Price | $/sf | Match |
|---|---|---|---|---|---|---|---|
| 700-704 Harvest Moon Dr | 0.12mi | 6/4.0 | 2,662 (0%) | 6mo | $519,000 | $195 | 88 |
| 652 Harvest Moon Dr | 0.12mi | 6/4.0 | 2,662 (0%) | 14mo | $519,000 | $195 | 83 |
| 748-752 Harvest Moon Dr | 0.15mi | 6/4.0 | 2,662 (0%) | 13mo | $519,000 | $195 | 82 |
| 601-605 Blackland Dr | 0.12mi | 6/4.0 | 2,662 (0%) | 18mo | $529,900 | $199 | 79 |
| 617-621 Blackland Dr | 0.11mi | 6/4.0 | 2,662 (0%) | 20mo | $529,900 | $199 | 78 |
| 641-645 Blackland Dr | 0.10mi | 6/4.0 | 2,662 (0%) | 21mo | $529,900 | $199 | 78 |
| 733-737 Blackland Dr | 0.11mi | 6/4.0 | 2,662 (0%) | 21mo | $529,900 | $199 | 77 |
| 657-661 Blackland Dr | 0.09mi | 6/4.0 | 2,662 (0%) | 23mo | $529,900 | $199 | 76 |
| 709-713 Blackland Dr | 0.10mi | 6/4.0 | 2,662 (0%) | 23mo | $529,900 | $199 | 76 |
| 717-721 Blackland Dr | 0.10mi | 6/4.0 | 2,662 (0%) | 24mo | $529,900 | $199 | 76 |
| 625-629 Blackland Dr | 0.11mi | 6/4.0 | 2,662 (0%) | 23mo | $529,900 | $199 | 75 |
| 725-729 Blackland Dr | 0.11mi | 6/4.0 | 2,662 (0%) | 23mo | $529,900 | $199 | 75 |
Match score weights: distance 35% · size 25% · config 20% · recency 20%. Top-matched comps best support the ARV.
Projected returns pro-forma
7.32% appreciation · 2.39% rent growth · sell at horizon
- IRR
- 25.9%
- Equity multiple
- 2.81×
- Total profit
- $263,427
- Equity at exit
- $370,576
- IRR
- 23.4%
- Equity multiple
- 5.82×
- Total profit
- $701,079
- Equity at exit
- $714,049
Cash invested: $145,320 (down + closing). Projections, not guarantees.
Landlord ↔ Tenant lean methodology
- Overall (STATE)
- 87 Strongly Landlord-Friendly
- State Texas
- 87 Strongly Landlord-Friendly · R+5
- County
- — inherits STATE
- City
- — inherits STATE
ZIP-level market 76084
- Home prices YoY
- 2.1%
- Rents YoY
- 2.4%
- Active inventory
- 426
- Price-to-rent
- 21.2×
Monthly cashflow live
- Estimated rent
- $6,121 medium interval (Pro) →
- Mortgage (P&I)
- −$2,722
- Tax est. 1.5%
- −$649 /mo · $7,785/yr
- Insurance
- −$216
- HOA
- −$63
- Vacancy / Maint / Mgmt
- −$1,285
- Net cashflow
- $1,186
Break-even live
3-unit breakdown (identical units grouped — click to expand)
| Units | Beds | Baths | Est. rent |
|---|---|---|---|
| 3× units | 3 | 2 | $6,120 |
| #1 | 3 | 2 | $2,040 |
| #2 | 3 | 2 | $2,040 |
| #3 | 3 | 2 | $2,040 |
| Total (3 units) | $6,121 | ||
UW: 25.0% down · 7.5% · 30yr · 1.5% tax · 5.0% vac · 8.0% maint · 8.0% mgmt
Financing live
Cash to close
- Down payment
- $129,750
- Closing costs
- $15,570
- Reserves months
- —
- Total cash needed
- —
Loan-product check · same deal, 3 products live
Conventional
25% down · 7.5% · 30yr
- Down + closing
- —
- Monthly P&I
- —
- Monthly cashflow
- —
- DSCR
- —
- Eligible?
- —
Personal DTI + credit; lowest rate.
DSCR
20% down · 8.5% · 30yr
- Down + closing
- —
- Monthly P&I
- —
- Monthly cashflow
- —
- DSCR
- —
- Eligible?
- —
No personal income docs; deal must DSCR.
Hard money
10% down · 12.0% · 12mo
- Down + closing
- —
- Monthly P&I
- —
- Monthly cashflow
- —
- DSCR
- —
- Eligible?
- —
Short-term bridge; refi at stabilization.
Rent comps 2 comps
| Address | Beds | Baths | Sqft | Rent | $/sqft | DOM | Units | Dist |
|---|---|---|---|---|---|---|---|---|
| 113 Franklin Ct Venus, TX | 5.0 | 2.0 | 2959 | $2,370 | $0.80 | 1d | 1 | 0.78mi |
| 201 John Laurens Dr Venus, TX | 3.0–5.0 | 2.0–2.5 | 1975 | $2,820 | $1.43 | 1d | 1 | 0.86mi |
HOA detail
- Monthly dues
- $63 · $756/yr
Listing history 24 events
-
2026-06-18days on market $519,000 Active 45 DOM
-
2026-06-17days on market $519,000 Active 44 DOM
-
2026-06-16days on market $519,000 Active 43 DOM
-
2026-06-15days on market $519,000 Active 42 DOM
-
2026-06-13days on market $519,000 Active 40 DOM
-
2026-06-09days on market $519,000 Active 36 DOM
-
2026-06-08days on market $519,000 Active 35 DOM
-
2026-06-07days on market $519,000 Active 34 DOM
-
2026-06-04days on market $519,000 Active 31 DOM
-
2026-06-03days on market $519,000 Active 30 DOM
-
2026-06-02days on market $519,000 Active 29 DOM
-
2026-06-01days on market $519,000 Active 28 DOM
-
2026-05-31days on market $519,000 Active 27 DOM
-
2026-05-04$519,000 Active 669-char remark
-
2026-02-06historical
-
2025-12-06status Active
-
2025-09-22status Pending
-
2025-09-16price $525,000
-
2025-08-20price $514,000
-
2025-06-12historical $1,995
-
2025-06-11$519,000 Active
-
2025-05-14$1,995
-
2025-05-14historical $1,995
-
2025-04-22$1,995
ⓘ Source: listings_history table (triggers on properties + properties_extension) + one-shot
backfill from property_details.listing_events for pre-trigger history.
Nearby sold comps map
Loading sold comps map…
Walkable amenities ~0.75 mi
Loading nearby amenities…
Taxation est. · year 1
- Rental income
- $73,452
- − Mortgage interest
- −$29,072
- − Property taxes
- −$7,785
- − Insurance
- −$2,595
- − Repairs & maintenance
- −$5,876
- − Management
- −$5,876
- − HOA
- −$756
- − Depreciation
- −$15,098
- Taxable income
- $6,393
- Est. tax owed @ 24.0%
- −$1,534
- After-tax cash flow
- $12,696/yr
For passive investors: Depreciation is non-cash, so a rental often shows a tax loss while cash-flowing — sheltering income. Rental losses are passive: they offset passive income freely, and up to $25,000/yr can offset ordinary (W-2) income if you actively participate and your MAGI is under $100k (phasing out to $0 by $150k); unused losses carry forward. On sale, claimed depreciation is recaptured at up to 25%, and gains may owe capital-gains tax (a 1031 exchange can defer both). Figures are a year-1 estimate at your 24.0% rate — not tax advice; consult a CPA.
Condition & rehab AI · 12 photos
This well-maintained, move-in-ready duplex is in good condition with a good condition score of 80. It has a good exterior, hardwood floors, and modern kitchens and bathrooms. The property is in a prime location with strong tenant demand and a favorable rental rate. Painting the exterior and improving landscaping would further enhance its curb appeal and value.
Value-add opportunities
- Both Painting exterior — Enhances curb appeal and value
- Both Landscaping — Improves curb appeal and rental value
- Resale Kitchen appliances — Modernizes kitchen and appeals to buyers
- Resale Bathroom fixtures — Modernizes bathrooms and appeals to buyers
Renovation cost estimate screening
Value-add ROI direction
- Both Painting exterior — Enhances curb appeal and value ↑
- Both Landscaping — Improves curb appeal and rental value ↑
- Resale Kitchen appliances — Modernizes kitchen and appeals to buyers ↑
- Resale Bathroom fixtures — Modernizes bathrooms and appeals to buyers ↑
ⓘ Cost ranges are severity-bucket heuristics (US national rule-of-thumb). Get contractor quotes + a written scope before underwriting a rehab budget.
Schools (NCES district)
- District
- Midlothian ISD
- NCES district ID
- 4830600
- Math proficiency
- 53% ▼ -7.00%
- Reading proficiency
- 52% ▼ -1.00%
- Median HH income
- $85,068
- Composite
- 48.22/100
- National rank
- #2165
- State rank
- #94 of 826 in TX
Livability — Venus
- Score
- 70/100
- State rank
- #356
- US rank
- #7724
Category grades
Schools grade is shown separately in the Schools card above.
Census & demographics
- Census place
- Venus, TX
- County
- Johnson County · 147,987 people
- Metro
- Dallas-Fort Worth-Arlington, TX
- Population (ZIP)
- 14,097
- Household income
- $102,115
- Rent vs Own
- Severe rent burden
- 70.0
Population outlook (Ellis County) Hauer SSP2
- Today (2025)
- 194,556 people
- By 2030
- 209,679 · +7.8%
- By 2040
- 238,837 · +22.8%
- By 2050
- 265,451 · +36.4%
- By 2075
- 326,571 · +67.9%
- By 2100
- 362,156 · +86.1%
Race, ethnicity, and origin ACS 2023
- Neighborhood character
- Diverse neighborhood (Simpson 0.63)
- Race & ethnicity
- White 52% Hispanic / Latino 30% Two or more races 24% Black 11% Asian 1%
- Hispanic origin (detail)
- Mexican 25% Puerto Rican 1%
- Common ancestry
- Romanian 2% Lithuanian 1% Slovak 1%
- Foreign-born
- 8% · Canada
- Languages at home
- 78% English-only · Spanish 18% Arabic 1% French/Haitian/Cajun 1%
Political lean MEDSL · Ellis
- 2024 margin
- Solid R (+31.1) · D 34.0% · R 65.1%
- 2008→2024 swing
- +11.2pp toward D · 2008: -42.2pp · 2024: -31.1pp
- All cycles
- 2024: R+31.1 2020: R+34.1 2016: R+45.4 2012: R+47.5 2008: R+42.2
Not yet ingested
- Civics
- —
Market trends
- HPI YoY
- ▲ 7.32%
- Current HPI
- 355.74
- Rent YoY
- ▲ 2.39%
- Metro
- Dallas-Fort Worth-Arlington, TX
- State GDP YoY
- ▲ 3.95%
- F500 in state
- 110
Industry mix (Fortune 500 HQ in TX)
| Industry | F500 HQs | Revenue |
|---|---|---|
| Energy | 16 | $1,198B |
|
||
| Technology | 5 | $198B |
|
||
| Engineering / Construction | 4 | $72B |
|
||
| Energy Services | 3 | $60B |
|
||
| Utilities | 3 | $41B |
|
||
| Healthcare | 2 | $330B |
|
||
Price history
+25915.0% since first listed11 events — show timeline
- 2026-05-04 Listed $519,000 NTREIS
- 2026-02-06 Listing Removed — NTREIS
- 2025-12-06 Relisted — NTREIS
- 2025-09-22 Pending — NTREIS
- 2025-09-16 Price Changed $525,000 NTREIS
- 2025-08-20 Price Changed $514,000 NTREIS
- 2025-06-12 Rental Removed $1,995 NTREIS
- 2025-06-11 Listed $519,000 NTREIS
- 2025-05-14 Listed for Rent $1,995 NTREIS
- 2025-05-14 Rental Removed $1,995 APPFOLIO
- 2025-04-22 Listed for Rent $1,995 APPFOLIO
Cash-flow waterfall
monthlySold comps — $/sqft
last 12 mo · ≤1 miLoading sold comps…