 🏗️ New Construction
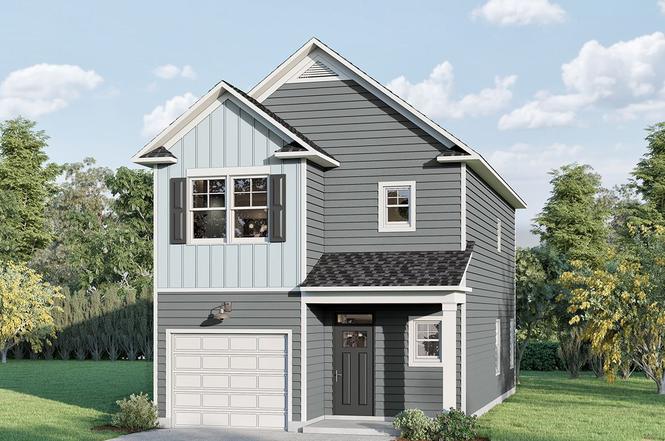
Pritchard II Plan · Blythewood, SC
Flood risk No data
- FEMA flood zone
- —
- Chance of flooding over 30 yrs
- —
- Est. flood insurance / yr
- —
Fire risk No data
- Est. fire insurance / yr
- —
Heat risk No data
- Hot days now (above threshold)
- —
- Hot days in 30 yrs
- —
Wind risk No data
- Chance of severe wind over 30 yrs
- —
Air-quality risk No data
- Unhealthy air days now
- —
- Unhealthy air days in 30 yrs
- —
Risk factors via First Street. Map © Google.
Why this score? — see what drove the D grade
The composite is a weighted blend of 9 inputs, each scored 0–100. Each bar is that input's sub-score; the figure is the points it added to the 100-point composite (weight × sub-score).
- Cash flow +14.8/30.0
- ARV discount +7.5/15.0
- DSCR +4.5/10.0
- 1% rule +4.1/10.0
- Schools +3.6/10.0
- Livability +3.5/5.0
- Rent growth +2.5/5.0
- Condition / age +1.0/5.0
- Appreciation +0.0/10.0
$252,900
🖨 Deal sheet (PDF) 📄 Offer letter ✓ Due diligence
Listing remarks
Main Level offers open kitchen with bar, large great room with optional fireplace, and dining room. Primary bedroom up offers large walk in closet, garden tub shower combo, double vanities and separate water closet. Two secondary bedrooms and full hall bath to complete.
Key facts
- Great room
- Walk in closet
- Double vanities
Tags
Property features AI
Finance
- Other: Living area approximately 1463
- Financial info: List price $252,900
- HOA & community:
Exterior
- Parking: 1 parking space
- Security:
- Utilities: Natural gas; Electric; Central air
- Home design: Pritchard II plan; New construction (plan)
- Construction:
- Exterior features: Located at 2010 Allan Crest Rd, Blythewood SC 29016
Interior
- Kitchen:
- Bedrooms: 3 bedrooms
- Flooring:
- Bathrooms: 2 full bathrooms and 1 half bathroom
- Heating & cooling: Natural gas and electric heating with heat pump; Central air conditioning
- Interior features: Open living area
- Laundry & utility:
Neighborhood map
What this means for you Summary
Snapshot
- This is a 3-bed/2.5-bath single-family listed at $253k. Condition is rated poor.
Deal economics
- At list price, monthly cash flow is $70 ($834/yr) — positive.
- The deal already cash-flows at list — no discount required.
- To meet the 1% rule (rent ≥ 1% of price), the offer needs to be $230k (9.0% below list).
- Recommended offer: $223k (12.0% below list) — sets the bar for market timing.
Location & tenants
- Location reads 70/100 on livability (#58 in SC) — a middle-class / working-renter tenant base. Strengths: crime A+, employment A+, housing A+; Watch: amenities F, commute F, health & safety F.
- Richland 02 (suburban): math 35% / reading 47% proficiency, ranked #29 of 80 in SC (top 36%) — families likely to look elsewhere, expect single-tenant / working-renter base with shorter leases.
- Zoned schools: Muller Road Middle (math 39% / reading 58%, grade D, #193 of 597 statewide, top 33%, 1,246 students, 46% FRL); Blythewood High (math 72% / reading 92%, grade A, #19 of 196 statewide, top 10%, 2,094 students, 39% FRL) — zoned schools at 43% FRL track the district average.
- Zoned-school proficiency averages 65% at this address vs 41% district-wide (+24 pts) — the actual schools serving this property are materially stronger than the Richland 02 average implies; a family-tenant draw the district grade alone would hide.
- Market conditions: 657 active listings in the ZIP; 1 comparable units currently listed for rent nearby; solid renter incomes; 3,472 units permitted in Richland County in 2024 (1,096 in 5+ unit buildings).
Forward outlook
- Local home prices are declining (-3.0%/yr); year-one equity from $2k of loan paydown is wiped out by about $8k of value loss. Plan a longer hold.
- Richland County population projected at +30% by 2050 — long-run rental-demand tailwind backs the buy-and-hold thesis.
Negotiation context
- It's been on market 136 days — a 12% lower offer ($223k) is reasonable based on typical stale-listing flexibility.
Questions for the listing agent
- It's been on market 136 days. Have you received any prior offers? Is the seller open to a 12% concession, seller financing, or rate buy-down credit?
- Have any recent inspections been done? Can we get a copy of the seller's disclosures and any deferred-maintenance estimates?
- Why hasn't it sold? Are there any deal-killer items the seller is aware of (foundation, flood, title, zoning, code violations)?
- Is there a deadline driving the sale (1031 exchange, divorce, estate, relocation)? That informs how much negotiation room exists.
- Schools are B-rated — typically a magnet for longer-tenancy family renters. What's the average tenant stay here, and is there a school-zone premium baked into asking?
- The area grade is low — what's the realistic commute time and amenity access for the typical tenant pool here? Any planned neighborhood developments (good or bad) we should know about?
- What's the average days-on-market for RENTAL listings here right now (not sales)? A rising rental-DOM trend means longer vacancies and softer asking-rent achievability than the comps imply.
- What's the recent tenant-quality profile in this submarket — average credit score on applications, eviction rate, late-payment / NSF rate, and stable-employment percentage? A property-management company in the area should have these aggregated.
- How much new for-sale + rental construction is in the pipeline within 1–3 miles? Heavy new supply typically softens prices + rents 12–24 months out; constrained supply supports both.
Investment metrics
- 1% rule
- 0.91% ✗
- Cap rate
- 6.62%
- Cash-on-cash
- 1.18%
- DSCR
- 1.05
- GRM
- 9.2
CMA / ARV
No comps found within radius.
Projected returns pro-forma
-3.0% appreciation · 3.0% rent growth · sell at horizon
- IRR
- -14.4%
- Equity multiple
- 0.48×
- Total profit
- $-36,518
- Equity at exit
- $37,708
- IRR
- -5.6%
- Equity multiple
- 0.63×
- Total profit
- $-25,956
- Equity at exit
- $21,866
Cash invested: $70,812 (down + closing). Projections, not guarantees.
Landlord ↔ Tenant lean methodology
- Overall (STATE)
- 90 Strongly Landlord-Friendly
- State South Carolina
- 90 Strongly Landlord-Friendly · R+6
- County
- — inherits STATE
- City
- — inherits STATE
ZIP-level market 29016
- Home prices YoY
- -26.3%
- Active inventory
- 657
- Price-to-rent
- 9.2×
Monthly cashflow live
- Estimated rent
- $2,300 medium interval (Pro) →
- Mortgage (P&I)
- −$1,326
- Tax est. 1.5%
- −$316 /mo · $3,794/yr
- Insurance
- −$105
- HOA
- −$0
- Vacancy / Maint / Mgmt
- −$483
- Net cashflow
- $70
Break-even live
Sensitivity live
| Price | -10% $244 | -5% $157 | +0% $70 | +5% $-18 | +10% $-105 |
|---|---|---|---|---|---|
| Rent | -10% $-112 | -5% $-21 | +0% $70 | +5% $160 | +10% $251 |
| Rate | -1.0pp $197 | -0.5pp $134 | base $70 | +0.5pp $4 | +1.0pp $-63 |
UW: 25.0% down · 7.5% · 30yr · 1.5% tax · 5.0% vac · 8.0% maint · 8.0% mgmt
Financing live
Cash to close
- Down payment
- $63,225
- Closing costs
- $7,587
- Reserves months
- —
- Total cash needed
- —
Loan-product check · same deal, 3 products live
Conventional
25% down · 7.5% · 30yr
- Down + closing
- —
- Monthly P&I
- —
- Monthly cashflow
- —
- DSCR
- —
- Eligible?
- —
Personal DTI + credit; lowest rate.
DSCR
20% down · 8.5% · 30yr
- Down + closing
- —
- Monthly P&I
- —
- Monthly cashflow
- —
- DSCR
- —
- Eligible?
- —
No personal income docs; deal must DSCR.
Hard money
10% down · 12.0% · 12mo
- Down + closing
- —
- Monthly P&I
- —
- Monthly cashflow
- —
- DSCR
- —
- Eligible?
- —
Short-term bridge; refi at stabilization.
Rent comps 1 comps
| Address | Beds | Baths | Sqft | Rent | $/sqft | DOM | Units | Dist |
|---|---|---|---|---|---|---|---|---|
| 227 Honey Hill Way Blythewood, SC | 3.0 | 2.5 | 1689 | $2,180 | $1.29 | 4d | 1 | 0.64mi |
Listing history 16 events
-
2026-06-22days on market $252,900 Active 136 DOM
-
2026-06-18days on market $252,900 Active 133 DOM
-
2026-06-17days on market $252,900 Active 132 DOM
-
2026-06-16days on market $252,900 Active 131 DOM
-
2026-06-15days on market $252,900 Active 130 DOM
-
2026-06-14days on market $252,900 Active 128 DOM
-
2026-06-13days on market $252,900 Active 127 DOM
-
2026-06-10days on market $252,900 Active 125 DOM
-
2026-06-09days on market $252,900 Active 124 DOM
-
2026-06-08days on market $252,900 Active 123 DOM
-
2026-06-07days on market $252,900 Active 122 DOM
-
2026-06-05days on market $252,900 Active 119 DOM
-
2026-06-03days on market $252,900 Active 118 DOM
-
2026-06-03days on market $252,900 Active 117 DOM
-
2026-06-01days on market $252,900 Active 116 DOM
-
2026-05-31days on market $252,900 Active 115 DOM
ⓘ Source: listings_history table (triggers on properties + properties_extension) + one-shot
backfill from property_details.listing_events for pre-trigger history.
Nearby sold comps map
Loading sold comps map…
Walkable amenities ~0.75 mi
Loading nearby amenities…
Taxation est. · year 1
- Rental income
- $27,604
- − Mortgage interest
- −$14,166
- − Property taxes
- −$3,794
- − Insurance
- −$1,264
- − Repairs & maintenance
- −$2,208
- − Management
- −$2,208
- − Depreciation
- −$7,357
- Taxable loss
- −$3,394
- Est. tax savings @ 24.0%
- +$815
- After-tax cash flow
- $1,649/yr
For passive investors: Depreciation is non-cash, so a rental often shows a tax loss while cash-flowing — sheltering income. Rental losses are passive: they offset passive income freely, and up to $25,000/yr can offset ordinary (W-2) income if you actively participate and your MAGI is under $100k (phasing out to $0 by $150k); unused losses carry forward. On sale, claimed depreciation is recaptured at up to 25%, and gains may owe capital-gains tax (a 1031 exchange can defer both). Figures are a year-1 estimate at your 24.0% rate — not tax advice; consult a CPA.
Condition & rehab AI · 1 photo
The home requires extensive repairs and maintenance, including a new roof, exterior siding, flooring, and interior painting. Significant improvements in these areas would substantially increase its resale and rental value.
Repairs flagged
- Major roof — Exposed underlying material indicates significant damage that requires replacement.
- Major exterior siding — Significant wear and discoloration suggest the siding needs to be replaced or repaired.
- Major flooring — Visible wear and tear indicates the flooring needs to be replaced or repaired.
- Major interior walls — Significant discoloration and wear suggest the walls need repainting or repair.
- Major systems — The overall condition suggests the systems may need repair or replacement, though specific issues are not visible in the photos.
Value-add opportunities
- Resale roof replacement — A new roof will significantly improve the home's curb appeal and overall condition.
- Resale exterior siding repair/replacement — A new exterior siding will enhance the home's appearance and increase its value.
- Resale flooring replacement — New flooring will improve the home's condition and make it more attractive to potential buyers.
- Resale interior wall repainting — Fresh paint will improve the home's appearance and make it more attractive to potential buyers.
- Both landscaping — A well-maintained landscape will improve the home's curb appeal and increase its value for both resale and rental purposes.
Renovation cost estimate screening
| Repair item | Severity | Est. cost |
|---|---|---|
| roof · Exposed underlying material indicates significant damage that requires replacement. | Major | $15,000–50,000 |
| exterior siding · Significant wear and discoloration suggest the siding needs to be replaced or repaired. | Major | $15,000–50,000 |
| flooring · Visible wear and tear indicates the flooring needs to be replaced or repaired. | Major | $15,000–50,000 |
| interior walls · Significant discoloration and wear suggest the walls need repainting or repair. | Major | $15,000–50,000 |
| systems · The overall condition suggests the systems may need repair or replacement, though specific issues are not visible in the photos. | Major | $15,000–50,000 |
| Total estimated repair cost · 5 items | $75,000–250,000 |
Value-add ROI direction
- Resale roof replacement — A new roof will significantly improve the home's curb appeal and overall condition. ↑
- Resale exterior siding repair/replacement — A new exterior siding will enhance the home's appearance and increase its value. ↑
- Resale flooring replacement — New flooring will improve the home's condition and make it more attractive to potential buyers. ↑
- Resale interior wall repainting — Fresh paint will improve the home's appearance and make it more attractive to potential buyers. ↑
- Both landscaping — A well-maintained landscape will improve the home's curb appeal and increase its value for both resale and rental purposes. ↑
ⓘ Cost ranges are severity-bucket heuristics (US national rule-of-thumb). Get contractor quotes + a written scope before underwriting a rehab budget.
Schools (NCES district)
- District
- Richland 02
- NCES district ID
- 4503390
- Math proficiency
- 35% ▼ -15.00%
- Reading proficiency
- 47% ▼ -5.00%
- Median HH income
- $59,684
- Composite
- 36.2/100
- National rank
- #4730
- State rank
- #29 of 80 in SC
Livability — Blythewood
- Score
- 70/100
- State rank
- #58
- US rank
- #7406
Category grades
Schools grade is shown separately in the Schools card above.
Census & demographics
- County
- Richland County · 389,530 people
- City population
- 30,454
- Metro
- Columbia, SC
- Population (ZIP)
- 30,454
- Household income
- $95,082
- Rent vs Own
- Severe rent burden
- 559.0
Population outlook (Richland County) Hauer SSP2
- Today (2025)
- 459,667 people
- By 2030
- 487,524 · +6.1%
- By 2040
- 542,035 · +17.9%
- By 2050
- 595,371 · +29.5%
- By 2075
- 732,998 · +59.5%
- By 2100
- 820,415 · +78.5%
Race, ethnicity, and origin ACS 2023
- Neighborhood character
- Diverse neighborhood (Simpson 0.64)
- Race & ethnicity
- Black 43% White 42% Two or more races 7% Hispanic / Latino 7% Asian 3%
- Hispanic origin (detail)
- Mexican 1% Puerto Rican 2%
- Common ancestry
- Lithuanian 2% Romanian 2% Slovak 2%
- Foreign-born
- 5% · Canada, China
- Languages at home
- 90% English-only · Spanish 5% Other Indo-European 1% German/W. Germanic 1%
Political lean MEDSL · Richland
- 2024 margin
- Solid D (+34.6) · D 66.4% · R 31.8% · Other 1.8%
- 2008→2024 swing
- +5.7pp toward D · 2008: 28.9pp · 2024: 34.6pp
- All cycles
- 2024: D+34.6 2020: D+38.3 2016: D+32.9 2012: D+33.3 2008: D+28.9
Not yet ingested
- Civics
- —
Market trends
- HPI YoY
- ▼ -65.48%
- Current HPI
- 183.5933
- Rent YoY
- —
- Metro
- Columbia, SC
- State GDP YoY
- ▲ 4.51%
- F500 in state
- 2
Industry mix (Fortune 500 HQ in SC)
| Industry | F500 HQs | Revenue |
|---|---|---|
| Packaging | 1 | $7B |
|
||
Cash-flow waterfall
monthlySold comps — $/sqft
last 12 mo · ≤1 miLoading sold comps…