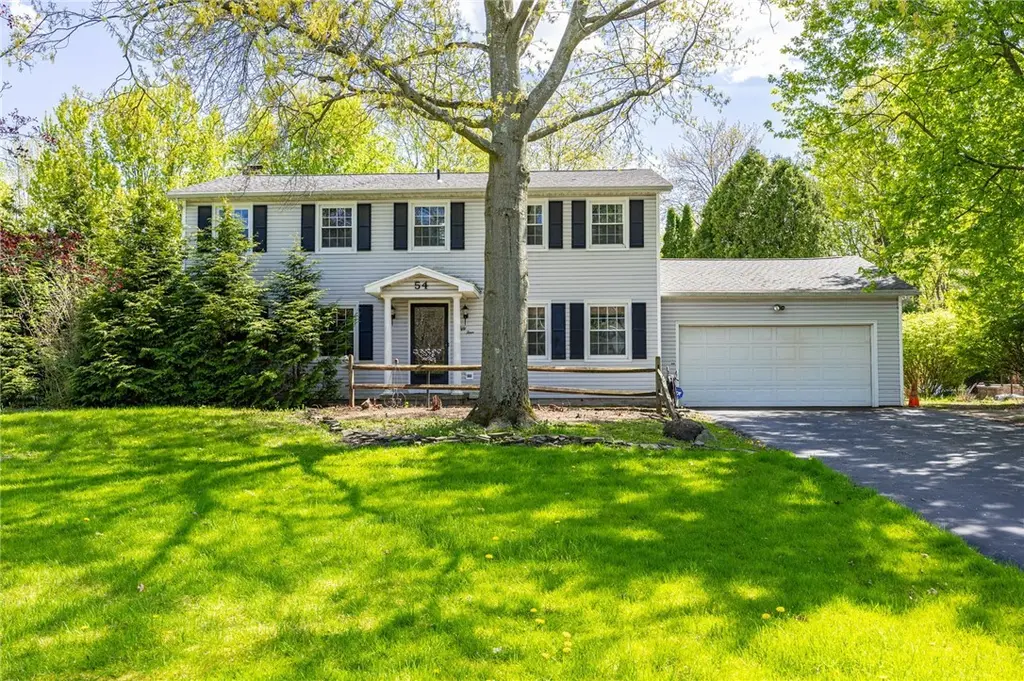
54 Glen Acre Dr · Brighton, NY
Flood risk 1/10 · Minimal
- FEMA flood zone
- X (unshaded)
- Chance of flooding over 30 yrs
- 0.0%
- Est. flood insurance / yr
- $473 – $860
Fire risk 1/10 · Minimal
- Est. fire insurance / yr
- $691 – $1,283
Heat risk 2/10 · Minimal
- Hot days now (above 94°F)
- 7 days/yr
- Hot days in 30 yrs
- 15 days/yr
Wind risk 1/10 · Minimal
- Chance of severe wind over 30 yrs
- —
Air-quality risk 2/10 · Minimal
- Unhealthy air days now
- 1 days/yr
- Unhealthy air days in 30 yrs
- 1 days/yr
Risk factors via First Street. Map © Google.
Why this score? — see what drove the C grade
The composite is a weighted blend of 9 inputs, each scored 0–100. Each bar is that input's sub-score; the figure is the points it added to the 100-point composite (weight × sub-score).
- Cash flow +17.2/30.0
- ARV discount +15.0/15.0
- 1% rule +5.9/10.0
- DSCR +5.4/10.0
- Schools +5.2/10.0
- Livability +4.0/5.0
- Rent growth +2.5/5.0
- Condition / age +2.5/5.0
- Appreciation +0.0/10.0
$299,900
🖨 Deal sheet (PDF) 📄 Offer letter ✓ Due diligence
Listing remarks
AMAZING OPPORTUNITY, TAKE A LOOK!! Pittsford mailing, Henrietta Schools, Great Location! Look no further! This is your chance to BUILD INSTANT EQUITY! This is a solid home, that just needs a cosmetic makeover! Furnace and A/C replaced 2020. Windows have been replaced throughout! Whole house generator comes with the home! This spacious 4-bedroom, 2.5-bath colonial is full of potential and ready for your personal touch. Ideally located near Tinker Nature Park, Wegmans, and a variety of shopping, this home also sits in a quiet, family-friendly neighborhood. With over 2,000 square feet of living space, the home features a formal dining room and an open-concept kitchen that flows into a comfort
Key facts
- 0.46 acre lot
- 2 garage spots
- Built 1976
Property features AI
Exterior
- Parking: Attached garage; Two garage spaces; Driveway
- Utilities: High-speed internet available; Public water connected; Sewer connected; Electric service with circuit breakers
- Home design: Two-story house; Resale property; Rectangular residential lot; City street frontage; Lot dimensions approximately 100 x 200
- Construction: Vinyl siding; Copper plumbing; Asphalt roof; Block foundation; Built (existing)
- Exterior features: Blacktop driveway; Deck; Open deck; Patio; Porch; Fully fenced yard; Shed(s) / storage
Interior
- Kitchen: Dishwasher; Electric oven; Electric range; Microwave; Garbage disposal; Eat-in kitchen
- Flooring: Carpet; Resilient flooring; Tile; Varied flooring
- Bathrooms: Two full bathrooms; One half bathroom; One main-level bathroom
- Heating & cooling: Gas forced-air heating; Central air conditioning
- Interior features: Ceiling fans; Den; Separate/formal dining room; Eat-in kitchen; Separate/formal living room; Sliding glass doors; Bath in primary bedroom; Sliding doors
- Laundry & utility: Washer; Dryer; Laundry in basement; Gas water heater; Generator
Neighborhood map
What this means for you Summary
Snapshot
- This is a 4-bed/2.5-bath single-family listed at $300k.
Deal economics
- At list price, monthly cash flow is $214 ($3k/yr) — positive.
- The deal already cash-flows at list — no discount required.
- Meets the 1% rule at list price ($3k rent vs $300k).
- Cap rate 7.2% vs local median 3.9% in Brighton — top-decile yield for the area; either an underpriced asset or a hidden risk that comps aren't pricing in. Stress-test before assuming the spread holds.
Location & tenants
- Location reads 81/100 on livability (#89 in NY, #1,379 nationally) — a professional / high-income tenant draw. Strengths: housing A+, health & safety A+, schools B+; Watch: crime D+, amenities D-.
- Rush-Henrietta Central School District (suburban): math 62% / reading 57% proficiency, ranked #237 of 590 in NY (top 40%) — acceptable for families but not a draw, mixed tenant base, ~2y average lease.
- Market conditions: 186 active listings in the ZIP; high-income renter base; 1,169 units permitted in Monroe County in 2024 (591 in 5+ unit buildings).
Forward outlook
- Local home prices are declining (-3.0%/yr); year-one equity from $2k of loan paydown is wiped out by about $9k of value loss. Plan a longer hold.
- Monroe County population projected to shrink 6% by 2050 — rents likely to lag national; underwrite the cash flow, not the appreciation.
Negotiation context
- Only 7 days on market — expect competitive offers; lowballing is unlikely to land.
Risks & watch-outs
- Watch-outs: property tax is 2.6% of price.
Questions for the listing agent
- Built in 1976 — when were the roof, HVAC, electrical panel, plumbing, and water heater last replaced?
- Property tax is high relative to price — has the assessment been appealed recently, and will the sale trigger a re-assessment?
- Is there a deadline driving the sale (1031 exchange, divorce, estate, relocation)? That informs how much negotiation room exists.
- Schools are B-rated — typically a magnet for longer-tenancy family renters. What's the average tenant stay here, and is there a school-zone premium baked into asking?
- Crime grade is D in this area — have there been break-ins, vandalism, or insurance claims at this property in the last 3 years? What carrier currently insures it and at what premium?
- What's the average days-on-market for RENTAL listings here right now (not sales)? A rising rental-DOM trend means longer vacancies and softer asking-rent achievability than the comps imply.
- What's the recent tenant-quality profile in this submarket — average credit score on applications, eviction rate, late-payment / NSF rate, and stable-employment percentage? A property-management company in the area should have these aggregated.
- How much new for-sale + rental construction is in the pipeline within 1–3 miles? Heavy new supply typically softens prices + rents 12–24 months out; constrained supply supports both.
Investment metrics
- 1% rule
- 1.09% ✓
- Cap rate
- 7.15%
- Cash-on-cash
- 3.07%
- DSCR
- 1.14
- GRM
- 7.7
CMA / ARV
- ARV (median comp)
- $397,178
- List price
- $299,900
- Delta
- -24.49%
- Verdict
- UNDERPRICED
- Comps
- 20 within 1.0 mi
Show comp detail 12 sales within ~0.75 mi
| Address | Dist | Beds/Ba | Sqft | Sold | Price | $/sf | Match |
|---|---|---|---|---|---|---|---|
| 124 Charleswood Dr | 0.21mi | 4/2.0 | 2,181 (+8%) | 2mo | $336,000 | $154 | 74 |
| 45 Barnfield Rd | 0.32mi | 4/2.0 | 1,898 (-6%) | 10mo | $310,000 | $163 | 64 |
| 26 Williamsburg Rd | 0.48mi | 4/3.0 | 2,116 (+4%) | 6mo | $360,000 | $170 | 63 |
| 10 Kathy Dr | 0.50mi | 4/2.5 | 1,914 (-6%) | 7mo | $332,000 | $173 | 62 |
| 165 Woodleaf | 0.73mi | 4/2.5 | 2,026 (-0%) | 6mo | $442,000 | $218 | 60 |
| 93 Parkmeadow Dr | 0.40mi | 3/2.0 (-1) | 1,814 (-11%) | 1mo | $367,000 | $202 | 56 |
| 32 Clearview Dr | 0.53mi | 3/2.5 (-1) | 1,896 (-6%) | 7mo | $333,500 | $176 | 54 |
| 40 Little Glen Rd | 0.28mi | 3/2.0 (-1) | 1,731 (-15%) | 10mo | $436,700 | $252 | 47 |
| 88 Butler Dr | 0.40mi | 3/2.5 (-1) | 1,752 (-14%) | 9mo | $315,000 | $180 | 46 |
| 140 Bradford Rd | 0.54mi | 3/2.5 (-1) | 1,752 (-14%) | 6mo | $238,000 | $136 | 43 |
| 1265 Calkins Rd | 0.50mi | 3/2.5 (-1) | 1,752 (-14%) | 8mo | $280,000 | $160 | 42 |
| 27 Marr Dr | 0.65mi | 3/1.5 (-1) | 1,814 (-11%) | 4mo | $332,000 | $183 | 40 |
Match score weights: distance 35% · size 25% · config 20% · recency 20%. Top-matched comps best support the ARV.
Projected returns pro-forma
-3.0% appreciation · 3.0% rent growth · sell at horizon
- IRR
- -11.4%
- Equity multiple
- 0.59×
- Total profit
- $-34,712
- Equity at exit
- $44,716
- IRR
- -2.1%
- Equity multiple
- 0.86×
- Total profit
- $-11,727
- Equity at exit
- $25,930
Cash invested: $83,972 (down + closing). Projections, not guarantees.
Landlord ↔ Tenant lean methodology
- Overall (STATE)
- 15 Strongly Tenant-Friendly
- State New York
- 15 Strongly Tenant-Friendly · D+10
- County
- — inherits STATE
- City
- — inherits STATE
ZIP-level market 14534
- Active inventory
- 186
- Price-to-rent
- 7.7×
Monthly cashflow live
- Estimated rent
- $3,255 medium interval (Pro) →
- Mortgage (P&I)
- −$1,573
- Tax from tax record
- −$659 /mo · $7,914/yr
- Insurance
- −$125
- HOA
- −$0
- Vacancy / Maint / Mgmt
- −$684
- Net cashflow
- $214
Break-even live
Sensitivity live
| Price | -10% $384 | -5% $299 | +0% $214 | +5% $130 | +10% $45 |
|---|---|---|---|---|---|
| Rent | -10% $-43 | -5% $86 | +0% $214 | +5% $343 | +10% $472 |
| Rate | -1.0pp $366 | -0.5pp $291 | base $214 | +0.5pp $137 | +1.0pp $58 |
UW: 25.0% down · 7.5% · 30yr · 1.5% tax · 5.0% vac · 8.0% maint · 8.0% mgmt
Financing live
Cash to close
- Down payment
- $74,975
- Closing costs
- $8,997
- Reserves months
- —
- Total cash needed
- —
Loan-product check · same deal, 3 products live
Conventional
25% down · 7.5% · 30yr
- Down + closing
- —
- Monthly P&I
- —
- Monthly cashflow
- —
- DSCR
- —
- Eligible?
- —
Personal DTI + credit; lowest rate.
DSCR
20% down · 8.5% · 30yr
- Down + closing
- —
- Monthly P&I
- —
- Monthly cashflow
- —
- DSCR
- —
- Eligible?
- —
No personal income docs; deal must DSCR.
Hard money
10% down · 12.0% · 12mo
- Down + closing
- —
- Monthly P&I
- —
- Monthly cashflow
- —
- DSCR
- —
- Eligible?
- —
Short-term bridge; refi at stabilization.
Listing history 2 events
-
2026-05-13status Pending 1426-char remark
-
2026-05-06$299,900 Active 1426-char remark
ⓘ Source: listings_history table (triggers on properties + properties_extension) + one-shot
backfill from property_details.listing_events for pre-trigger history.
Tax reassessment forecast NY · Partial reset (capped growth)
- Current annual tax
- $7,914 · $659/mo
- Projected year-2 tax
- $7,914 · $659/mo
- Expected delta
- $0/yr ($0/mo · 0.0%)
ⓘ Screening estimate from a state-policy table — verify with the county assessor before closing.
Climate risk First Street
- Flood 1/10 Low FEMA zone X (unshaded) · 0% chance over 30 yrs
- Wildfire 1/10 Low
- Heat 2/10 Low 7 d/yr ≥94°F today · 15 d/yr by 30 yrs out
- Wind 1/10 Low
- Air quality 2/10 Low 1 unhealthy d/yr today · 1 by 30 yrs out
Nearby sold comps map
Loading sold comps map…
Walkable amenities ~0.75 mi
Loading nearby amenities…
Taxation est. · year 1
- Rental income
- $39,063
- − Mortgage interest
- −$16,799
- − Property taxes
- −$7,914
- − Insurance
- −$1,500
- − Repairs & maintenance
- −$3,125
- − Management
- −$3,125
- − Depreciation
- −$8,724
- Taxable loss
- −$2,124
- Est. tax savings @ 24.0%
- +$510
- After-tax cash flow
- $3,084/yr
For passive investors: Depreciation is non-cash, so a rental often shows a tax loss while cash-flowing — sheltering income. Rental losses are passive: they offset passive income freely, and up to $25,000/yr can offset ordinary (W-2) income if you actively participate and your MAGI is under $100k (phasing out to $0 by $150k); unused losses carry forward. On sale, claimed depreciation is recaptured at up to 25%, and gains may owe capital-gains tax (a 1031 exchange can defer both). Figures are a year-1 estimate at your 24.0% rate — not tax advice; consult a CPA.
Schools (NCES district)
- District
- Rush-Henrietta Central School District
- NCES district ID
- 3625170
- Math proficiency
- 62% ▼ -6.00%
- Reading proficiency
- 57% ▲ 1.00%
- Median HH income
- $58,682
- Composite
- 51.52/100
- National rank
- #1720
- State rank
- #237 of 590 in NY
Livability — Brighton
- Score
- 81/100
- State rank
- #89
- US rank
- #1379
Category grades
Schools grade is shown separately in the Schools card above.
Census & demographics
- County
- Monroe County · 674,131 people
- City population
- 38,703
- Metro
- Rochester, NY
- Population (ZIP)
- 33,230
- Household income
- $143,694
- Rent vs Own
- Severe rent burden
- 398.0
Population outlook (Monroe County) Hauer SSP2
- Today (2025)
- 759,460 people
- By 2030
- 757,154 · -0.3%
- By 2040
- 740,644 · -2.5%
- By 2050
- 714,443 · -5.9%
- By 2075
- 645,883 · -15.0%
- By 2100
- 547,084 · -28.0%
Race, ethnicity, and origin ACS 2023
- Neighborhood character
- Predominantly White (81%)
- Race & ethnicity
- White 81% Asian 8% Two or more races 6% Hispanic / Latino 4% Black 2%
- Common ancestry
- Romanian 5% Italian 4% Lithuanian 3%
- Foreign-born
- 12% · Canada, China, South Korea
- Languages at home
- 87% English-only · Other Indo-European 3% Chinese 2% Spanish 2%
Political lean MEDSL · Monroe
- 2024 margin
- D (+19.1) · D 59.5% · R 40.5%
- 2008→2024 swing
- +1.4pp toward D · 2008: 17.7pp · 2024: 19.1pp
- All cycles
- 2024: D+19.1 2020: D+21.0 2016: D+14.1 2012: D+17.4 2008: D+17.7
Not yet ingested
- Civics
- —
Market trends
- HPI YoY
- ▼ -232.40%
- Current HPI
- 258.0726
- Rent YoY
- —
- Metro
- Rochester, NY
- State GDP YoY
- ▲ 2.60%
- F500 in state
- 92
Industry mix (Fortune 500 HQ in NY)
| Industry | F500 HQs | Revenue |
|---|---|---|
| Financial Services | 10 | $950B |
|
||
| Consumer Goods | 9 | $162B |
|
||
| Insurance | 4 | $225B |
|
||
| Telecommunications | 2 | $144B |
|
||
| Pharmaceuticals | 2 | $112B |
|
||
| Media / Entertainment | 2 | $69B |
|
||
Price history
2 events — show timeline
- 2026-05-13 Pending — UNYREIS
- 2026-05-06 Listed $299,900 UNYREIS
Property tax history
+3.8%/yrLatest (2025): $7,914 · +25.5% YoY. Source: county tax records.
Cash-flow waterfall
monthlySold comps — $/sqft
last 12 mo · ≤1 miLoading sold comps…