 Duplex
4411 1st Ave N · St. Petersburg, FL
Flood risk 3/10 · Minor
- FEMA flood zone
- X (unshaded)
- Chance of flooding over 30 yrs
- 0.2%
- Est. flood insurance / yr
- $507 – $1,088
Fire risk 1/10 · Minimal
- Est. fire insurance / yr
- $947 – $1,759
Heat risk 10/10 · Severe
- Hot days now (above 106°F)
- 7 days/yr
- Hot days in 30 yrs
- 24 days/yr
Wind risk 10/10 · Severe
- Chance of severe wind over 30 yrs
- 99.0%
Air-quality risk 4/10 · Minor
- Unhealthy air days now
- 4 days/yr
- Unhealthy air days in 30 yrs
- 4 days/yr
Risk factors via First Street. Map © Google.
Why this score? — see what drove the C- grade
The composite is a weighted blend of 9 inputs, each scored 0–100. Each bar is that input's sub-score; the figure is the points it added to the 100-point composite (weight × sub-score).
- Cash flow +20.7/30.0
- ARV discount +7.5/15.0
- DSCR +6.6/10.0
- 1% rule +5.1/10.0
- Schools +4.3/10.0
- Rent growth +2.7/5.0
- Livability +2.5/5.0
- Condition / age +2.5/5.0
- Appreciation +0.0/10.0
$395,000
🖨 Deal sheet 📄 Offer letter ✓ Due diligence
Multi-family units
County records classify this as Multi-Family (2-4 Unit). Listing-text estimate: 2 units. confirmed
Listing remarks MLS
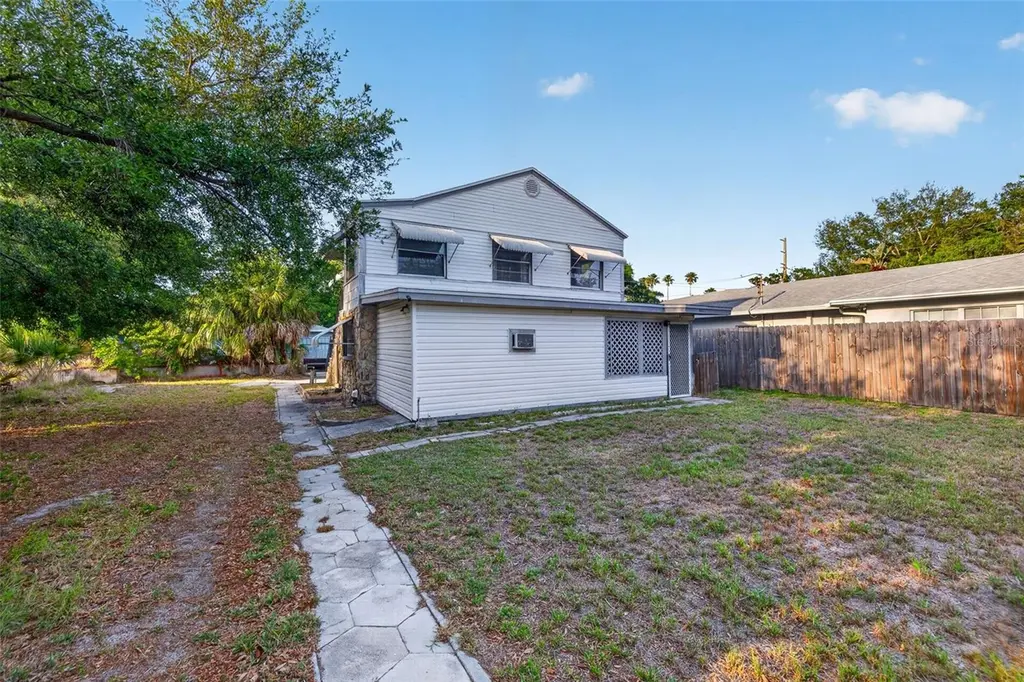
Short Sale. Steady income investment property duplex. Upstairs and downstairs apartments tenant occupied. Big front yard with plenty of room for utility sheds. Ample parking for tenants. Upstairs unit at some point had a second bedroom however it is a 1bdrm with a big living room. Downstairs has an air conditioned bonus room.
Key facts
- Zoned ntm-1
- Five-unit density
- 7,810 sq ft lot
Tags
Property features AI
Finance
- Other: Property type: Residential Income (Duplex); Total acreage: less than 1/4 acre (~0.18 acres); Living area (public records): 1,604 sq ft; Building area total: 1,896 sq ft; Total number of units: 2; Number of buildings: 1
- Financial info: Gross income reported: $33,420; Annual net income reported: $23,268; No lease restrictions reported; Number of separate water meters: 1; Pro forma income for 1-bedroom unit type: 1600
- HOA & community: No association
Exterior
- Parking: Driveway; Off-street parking; On-street parking
- Utilities: Public water; Public sewer; Electricity connected; Sewer connected; Water connected
- Home design: Residential income property (duplex); Two levels; One building
- Construction: Vinyl siding; Shingle roof; Slab foundation; Built area and lot information from public records
- Exterior features: Screened porch; Exterior lighting; Private mailbox; Near public transit; Oversized lot; Asphalt road access; Lot dimensions approximately 63 x 125
Interior
- Bedrooms: Two bedrooms total; Duplex units: two 1-bedroom units (one occupied)
- Flooring: Tile flooring; Wood flooring
- Bathrooms: One bathroom per 1-bedroom unit
- Heating & cooling: Central heating; Central air conditioning
- Interior features: Ceiling fans
- Laundry & utility: Laundry inside
Neighborhood map
What this means for you Summary
Snapshot
- This is a 2 × 2-bed/1.0-bath units multifamily listed at $395k.
Deal economics
- At list price, monthly cash flow is $532 ($6k/yr) — positive. Per door: $266/mo.
- The deal already cash-flows at list — no discount required.
- Meets the 1% rule at list price ($4k rent vs $395k).
- Cap rate 7.9% vs local median 2.6% in St. Petersburg — top-decile yield for the area; either an underpriced asset or a hidden risk that comps aren't pricing in. Stress-test before assuming the spread holds.
Location & tenants
- Location reads: area grade C — affects rentability + tenant quality, not the cash-flow math above.
- Pinellas (suburban): math 51% / reading 51% proficiency, ranked #31 of 73 in FL (top 42%) — acceptable for families but not a draw, mixed tenant base, ~2y average lease.
- Market conditions: Rents flat; 307 active listings in the ZIP; 40 comparable units currently listed for rent nearby; rentals leasing fast (median 8d on market — plan ~1-2 weeks tenant-placement turnaround); 2,676 units permitted in Pinellas County in 2024 (1,422 in 5+ unit buildings).
- At $3,982/mo this rent would consume 64% of the median local household income ($75k/yr) (locally 1076% of renters already pay >50% of income on rent) — very limited rent-growth headroom before tenants either downsize or default.
Forward outlook
- Local home prices are declining (-3.0%/yr); year-one equity from $3k of loan paydown is wiped out by about $12k of value loss. Plan a longer hold.
- Pinellas County population projected at +14% by 2050 — modest demand growth; plan on rents tracking national, not racing it.
Negotiation context
- Only 12 days on market — expect competitive offers; lowballing is unlikely to land.
- 2 sale attempts since 13y ago with the ask held roughly flat each time — persistent listings suggest the price (not the market) is what's stuck; bring a comps-based counter.
- Current owner paid $63k; list at $395k implies a 527% gain — meaningful room to come down on a strong offer.
Risks & watch-outs
- Watch-outs: built in 1942 — expect roof / HVAC / electrical / plumbing capex.
- Climate carrying-cost: severe wind risk, 99% chance of damaging wind over 30y; extreme-heat days projected 7→24/yr by 2055 (HVAC capex compounding) — expect insurance premiums to compound above CPI over the hold.
Questions for the listing agent
- Can we see the unit-by-unit rent roll, current vacancy, and any below-market leases? What's the average tenancy length?
- What capital expenditures (roof, boiler, parking lot, exteriors) have been made in the last 5 years, and what's planned in the next 2?
- Built in 1942 — when were the roof, HVAC, electrical panel, plumbing, and water heater last replaced?
- Is there a deadline driving the sale (1031 exchange, divorce, estate, relocation)? That informs how much negotiation room exists.
- What's the average days-on-market for RENTAL listings here right now (not sales)? A rising rental-DOM trend means longer vacancies and softer asking-rent achievability than the comps imply.
- What's the recent tenant-quality profile in this submarket — average credit score on applications, eviction rate, late-payment / NSF rate, and stable-employment percentage? A property-management company in the area should have these aggregated.
- How much new apartment / multifamily construction is in the pipeline within 1–3 miles? Heavy new supply (>2% of stock underway) typically softens rents 12–24 months out; light construction supports rent growth.
Investment metrics
- 1% rule
- 1.01% ✓
- Cap rate
- 7.91%
- Cash-on-cash
- 5.78%
- DSCR
- 1.26
- GRM
- 8.3
CMA / ARV
No comps found within radius.
Projected returns pro-forma
-3.0% appreciation · 0.67% rent growth · sell at horizon
- IRR
- -9.9%
- Equity multiple
- 0.65×
- Total profit
- $-39,234
- Equity at exit
- $58,896
- IRR
- -4.0%
- Equity multiple
- 0.76×
- Total profit
- $-26,277
- Equity at exit
- $34,152
Cash invested: $110,600 (down + closing). Projections, not guarantees.
Landlord ↔ Tenant lean methodology
- Overall (STATE)
- 87 Strongly Landlord-Friendly
- State Florida
- 87 Strongly Landlord-Friendly · R+3
- County
- — inherits STATE
- City
- — inherits STATE
ZIP-level market 33713
- Rents YoY
- 0.7%
- Active inventory
- 307
- Price-to-rent
- 16.5×
Monthly cashflow live
- Estimated rent
- $3,982 high interval (Pro) →
- Mortgage (P&I)
- −$2,071
- Tax from tax record
- −$377 /mo · $4,529/yr
- Insurance
- −$165
- HOA
- −$0
- Vacancy / Maint / Mgmt
- −$836
- Net cashflow
- $532
Break-even live
2-unit breakdown (identical units grouped — click to expand)
| Units | Beds | Baths | Est. rent |
|---|---|---|---|
| 2× units | 2 | 1 | $3,982 |
| #1 | 2 | 1 | $1,991 |
| #2 | 2 | 1 | $1,991 |
| Total (2 units) | $3,982 | ||
UW: 25.0% down · 7.5% · 30yr · 1.5% tax · 5.0% vac · 8.0% maint · 8.0% mgmt
Financing live
Cash to close
- Down payment
- $98,750
- Closing costs
- $11,850
- Reserves months
- —
- Total cash needed
- —
Loan-product check · same deal, 3 products live
Conventional
25% down · 7.5% · 30yr
- Down + closing
- —
- Monthly P&I
- —
- Monthly cashflow
- —
- DSCR
- —
- Eligible?
- —
Personal DTI + credit; lowest rate.
DSCR
20% down · 8.5% · 30yr
- Down + closing
- —
- Monthly P&I
- —
- Monthly cashflow
- —
- DSCR
- —
- Eligible?
- —
No personal income docs; deal must DSCR.
Hard money
10% down · 12.0% · 12mo
- Down + closing
- —
- Monthly P&I
- —
- Monthly cashflow
- —
- DSCR
- —
- Eligible?
- —
Short-term bridge; refi at stabilization.
Rent comps 40 comps
| Address | Beds | Baths | Sqft | Rent | $/sqft | DOM | Units | Dist |
|---|---|---|---|---|---|---|---|---|
| 4010 1st Ave S Saint Petersburg, FL | 3.0 | 1.5 | 1847 | $2,195 | $1.19 | 13d | 1 | 0.35mi |
| 4018 2nd Ave S Saint Petersburg, FL | 3.0 | 1.0 | 1176 | $2,095 | $1.78 | 4d | 1 | 0.37mi |
| 4519 5th Ave S Saint Petersburg, FL | 4.0 | 2.0 | 1448 | $2,900 | $2.00 | 3d | 1 | 0.38mi |
| 3911 2nd Ave N Saint Petersburg, FL | 3.0 | 1.5 | 1520 | $2,400 | $1.58 | 24d | 1 | 0.40mi |
| 4736 5th Ave S Saint Petersburg, FL | 4.0 | 1.0 | 1224 | $1,895 | $1.55 | 4d | 1 | 0.50mi |
| 404 Madison St S Saint Petersburg, FL | 3.0 | 1.0 | 1391 | $2,500 | $1.80 | 4d | 1 | 0.51mi |
| 600 40th St N Saint Petersburg, FL | 1.0–3.0 | 1.0–2.5 | 1187 | $2,100 | $1.77 | 4d | 12 | 0.52mi |
| 3720 3rd Ave N Unit 1/2 St. Petersburg, FL | 3.0 | 3.0 | 1392 | $3,000 | $2.16 | 24d | 1 | 0.58mi |
| 5055 3rd Ave S Saint Petersburg, FL | 3.0 | 2.0 | 1254 | $2,100 | $1.67 | 4d | 1 | 0.62mi |
| 4711 Fairfield Ave S Saint Petersburg, FL | 3.0 | 2.0 | 1135 | $2,800 | $2.47 | 4d | 1 | 0.62mi |
| 4948 5th Ave S Saint Petersburg, FL | 3.0 | 1.5 | 1379 | $2,450 | $1.78 | 4d | 1 | 0.63mi |
| 4594 10th Ave N Saint Petersburg, FL | 3.0 | 2.0 | 1432 | $3,100 | $2.16 | 24d | 1 | 0.68mi |
| 5201 1st Ave N Unit 5201 St. Petersburg, FL | 4.0 | 2.0 | 1597 | $2,895 | $1.81 | 20d | 1 | 0.69mi |
| 5156 5th Ave S Saint Petersburg, FL | 3.0 | 1.0 | 1139 | $1,995 | $1.75 | 24d | 1 | 0.75mi |
| 3855 8th Ave S Saint Petersburg, FL | 4.0 | 2.0 | 1565 | $3,530 | $2.26 | 4d | 1 | 0.82mi |
| 4136 13th Ave N Saint Petersburg, FL | 3.0 | 2.0 | 1154 | $2,600 | $2.25 | 11d | 1 | 0.87mi |
| 4801 10th Ave S Unit 1 St. Petersburg, FL | 3.0 | 1.0 | 1100 | $2,200 | $2.00 | 24d | 1 | 0.88mi |
| 4700 10th Ave S Unit 1 St. Petersburg, FL | 4.0 | 2.0 | 1300 | $2,650 | $2.04 | 24d | 1 | 0.88mi |
| 4700 10th Ave S Saint Petersburg, FL | 3.0 | 2.0 | 1300 | $2,500 | $1.92 | 20d | 1 | 0.88mi |
| 800 51st St S Gulfport, FL | 3.0 | 2.0 | 1258 | $3,200 | $2.54 | 4d | 1 | 0.88mi |
| 5318 9th Ave N Saint Petersburg, FL | 3.0 | 2.0 | 1142 | $2,600 | $2.28 | 4d | 1 | 0.99mi |
| 3259 Emerson Ave S Saint Petersburg, FL | 4.0 | 2.5 | 2136 | $3,950 | $1.85 | 3d | 1 | 1.02mi |
| 4029 13th Ave S St Petersburg, FL | 3.0 | 2.0 | 1152 | $2,650 | $2.30 | 24d | 1 | 1.03mi |
| 4718 13th Ave S Saint Petersburg, FL | 4.0 | 1.5 | 1520 | $2,881 | $1.90 | 12d | 1 | 1.07mi |
| 3133 4th Ter N Saint Petersburg, FL | 3.0 | 3.5 | 1952 | $4,275 | $2.19 | 3d | 1 | 1.09mi |
| 3129 4th Ter N Saint Petersburg, FL | 3.0 | 3.5 | 1952 | $4,250 | $2.18 | 12d | 1 | 1.09mi |
| 4721 14th Ave S Saint Petersburg, FL | 5.0 | 3.0 | 1788 | $3,700 | $2.07 | 24d | 1 | 1.10mi |
| 3053 2nd Ave N St Petersburg, FL | 4.0 | 2.5 | 1476 | $5,500 | $3.73 | 24d | 1 | 1.10mi |
| 3109 4th Ter N Saint Petersburg, FL | 3.0 | 3.5 | 1952 | $4,200 | $2.15 | 24d | 1 | 1.11mi |
| 3301 9th Ave N Saint Petersburg, FL | 3.0 | 2.0 | 1514 | $3,500 | $2.31 | 4d | 1 | 1.11mi |
| 3026 Burlington Ave N Saint Petersburg, FL | 3.0 | 1.0 | 1319 | $2,550 | $1.93 | 4d | 1 | 1.13mi |
| 3026 Burlington Ave N Saint Petersburg, FL | 3.0 | 1.0 | 1319 | $2,550 | $1.93 | 11d | 1 | 1.13mi |
| 1543 43rd St S Saint Petersburg, FL | 4.0 | 2.0 | 1198 | $3,495 | $2.92 | 4d | 1 | 1.19mi |
| 1711 Scranton St S Saint Petersburg, FL | 4.0 | 2.0 | 2041 | $3,400 | $1.67 | 4d | 1 | 1.28mi |
| 4631 Queensboro Ave S St Petersburg, FL | 3.0 | 2.0 | 1094 | $2,600 | $2.38 | 10d | 1 | 1.31mi |
| 4631 Queensboro Ave S Unit 4631 St. Petersburg, FL | 3.0 | 2.0 | 1094 | $2,600 | $2.38 | 7d | 1 | 1.31mi |
| 3603 16th Ave S Saint Petersburg, FL | 4.0 | 2.0 | 1235 | $3,000 | $2.43 | 4d | 1 | 1.34mi |
| 2900 Freemont Ter S Saint Petersburg, FL | 3.0 | 3.0 | 1376 | $2,560 | $1.86 | 4d | 1 | 1.36mi |
| 1734 39th St S Saint Petersburg, FL | 4.0 | 2.0 | 1152 | $2,000 | $1.74 | 24d | 1 | 1.37mi |
| 350 28th St S Saint Petersburg, FL | 4.0 | 3.0 | 1808 | $3,950 | $2.18 | 4d | 1 | 1.38mi |
Listing history 9 events
-
2026-05-01status Pending
-
2026-04-18$395,000 Active
-
2013-11-06soldstatus $63,000
-
2013-10-30soldstatus $63,000 327-char remark
Show marketing remark (327 chars)
Short Sale. Steady income investment property duplex. Upstairs and downstairs apartments tenant occupied. Big front yard with plenty of room for utility sheds. Ample parking for tenants. Upstairs unit at some point had a second bedroom however it is a 1bdrm with a big living room. Downstairs has an air conditioned bonus room.
-
2013-02-14$79,900 327-char remark
Show marketing remark (327 chars)
Short Sale. Steady income investment property duplex. Upstairs and downstairs apartments tenant occupied. Big front yard with plenty of room for utility sheds. Ample parking for tenants. Upstairs unit at some point had a second bedroom however it is a 1bdrm with a big living room. Downstairs has an air conditioned bonus room.
-
2004-04-19soldstatus $97,500
-
2000-04-07soldstatus $77,300
-
1988-04-18soldstatus $43,500
-
1983-05-01soldstatus $39,500
ⓘ Source: listings_history table (triggers on properties + properties_extension) + one-shot
backfill from property_details.listing_events for pre-trigger history.
Tax reassessment forecast FL · Resets to sale price
- Current annual tax
- $4,529 · $377/mo
- Projected year-2 tax
- $4,529 · $377/mo
- Expected delta
- $0/yr ($0/mo · 0.0%)
ⓘ Screening estimate from a state-policy table — verify with the county assessor before closing.
Climate risk First Street
- Flood 3/10 Moderate FEMA zone X (unshaded) · 20% chance over 30 yrs
- Wildfire 1/10 Low
- Heat 10/10 Extreme 7 d/yr ≥106°F today · 24 d/yr by 30 yrs out
- Wind 10/10 Extreme 99% chance of damaging wind over 30 yrs
- Air quality 4/10 Moderate 4 unhealthy d/yr today · 4 by 30 yrs out
Nearby sold comps map
Loading sold comps map…
Walkable amenities ~0.75 mi
Loading nearby amenities…
Taxation est. · year 1
- Rental income
- $47,784
- − Mortgage interest
- −$22,126
- − Property taxes
- −$4,529
- − Insurance
- −$1,975
- − Repairs & maintenance
- −$3,823
- − Management
- −$3,823
- − Depreciation
- −$11,491
- Taxable income
- $18
- Est. tax owed @ 24.0%
- −$4
- After-tax cash flow
- $6,384/yr
For passive investors: Depreciation is non-cash, so a rental often shows a tax loss while cash-flowing — sheltering income. Rental losses are passive: they offset passive income freely, and up to $25,000/yr can offset ordinary (W-2) income if you actively participate and your MAGI is under $100k (phasing out to $0 by $150k); unused losses carry forward. On sale, claimed depreciation is recaptured at up to 25%, and gains may owe capital-gains tax (a 1031 exchange can defer both). Figures are a year-1 estimate at your 24.0% rate — not tax advice; consult a CPA.
Schools (NCES district)
- District
- Pinellas
- NCES district ID
- 1201560
- Math proficiency
- 51% ▼ -5.00%
- Reading proficiency
- 51% ▼ -3.00%
- Median HH income
- $46,270
- Composite
- 43.27/100
- National rank
- #3046
- State rank
- #31 of 73 in FL
Livability — St. Petersburg
No livability data for this city. (Only ~50 U.S. cities are tracked.)
Census & demographics
- Census place
- St. Petersburg, FL
- County
- Pinellas County · 939,478 people
- City population
- 249,151
- Metro
- Tampa-St. Petersburg-Clearwater, FL
- Population (ZIP)
- 31,729
- Household income
- $74,707
- Rent vs Own
- Severe rent burden
- 1076.0
Population outlook (Pinellas County) Hauer SSP2
- Today (2025)
- 1,027,532 people
- By 2030
- 1,063,586 · +3.5%
- By 2040
- 1,125,020 · +9.5%
- By 2050
- 1,168,637 · +13.7%
- By 2075
- 1,265,188 · +23.1%
- By 2100
- 1,260,357 · +22.7%
Race, ethnicity, and origin ACS 2023
- Neighborhood character
- Predominantly White (71%)
- Race & ethnicity
- White 71% Hispanic / Latino 13% Two or more races 9% Black 7% Asian 6%
- Hispanic origin (detail)
- Mexican 3% Puerto Rican 2% Cuban 3%
- Common ancestry
- Romanian 3% Lithuanian 2% Slovak 2%
- Foreign-born
- 12% · Canada, Vietnam
- Languages at home
- 84% English-only · Spanish 9% Other Asian/Pacific 2% Vietnamese 2%
Political lean MEDSL · Pinellas
- 2024 margin
- Lean R (+5.2) · D 46.9% · R 52.1%
- 2008→2024 swing
- -13.5pp toward R · 2008: 8.3pp · 2024: -5.2pp
- All cycles
- 2024: R+5.2 2020: D+0.2 2016: R+1.1 2012: D+5.6 2008: D+8.3
Not yet ingested
- Civics
- —
Market trends
- HPI YoY
- ▼ -439.69%
- Current HPI
- 478.8317
- Rent YoY
- ▲ 0.67%
- Metro
- Tampa-St. Petersburg-Clearwater, FL
- State GDP YoY
- ▲ 3.28%
- F500 in state
- 36
Industry mix (Fortune 500 HQ in FL)
| Industry | F500 HQs | Revenue |
|---|---|---|
| Industrial Technology | 2 | $29B |
|
||
| Insurance | 2 | $17B |
|
||
| Retail | 1 | $60B |
|
||
| Technology Distribution | 1 | $58B |
|
||
| Homebuilding | 1 | $35B |
|
||
| Technology Manufacturing | 1 | $35B |
|
||
Price history
+900.0% since first listed9 events — show timeline
- 2026-05-01 Pending — Stellar MLS as Distributed by MLS Grid
- 2026-04-18 Listed $395,000 Stellar MLS as Distributed by MLS Grid
- 2013-11-06 Sold (Public Records) $63,000 Public Records
- 2013-10-30 Sold (MLS) $63,000 Stellar MLS as Distributed by MLS Grid
- 2013-02-14 Listed $79,900 Stellar MLS as Distributed by MLS Grid
- 2004-04-19 Sold (Public Records) $97,500 Public Records
- 2000-04-07 Sold (Public Records) $77,300 Public Records
- 1988-04-18 Sold (Public Records) $43,500 Public Records
- 1983-05-01 Sold (Public Records) $39,500 Public Records
Property tax history
+10.5%/yrLatest (2025): $4,529 · +13.7% YoY. Source: county tax records.
Cash-flow waterfall
monthlySold comps — $/sqft
last 12 mo · ≤1 miLoading sold comps…