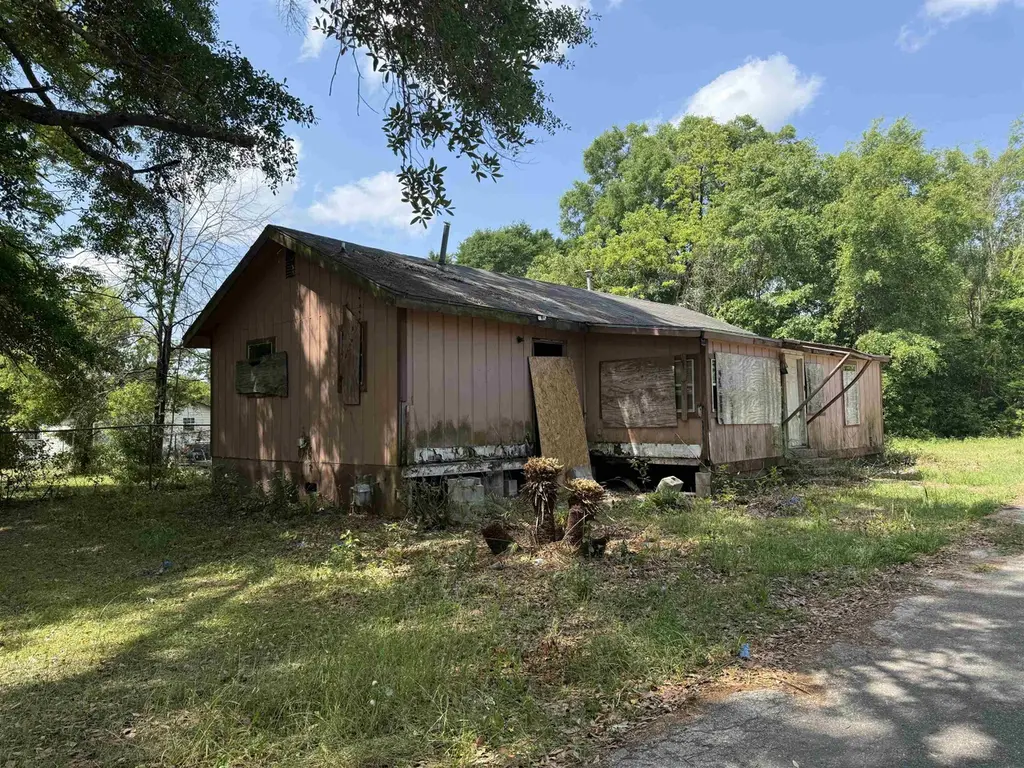
1733 Mckelvy St · Quincy, FL
Flood risk 1/10 · Minimal
- FEMA flood zone
- X (unshaded)
- Chance of flooding over 30 yrs
- 0.0%
- Est. flood insurance / yr
- $507 – $1,088
Fire risk 3/10 · Minor
- Est. fire insurance / yr
- $947 – $1,759
Heat risk 8/10 · Major
- Hot days now (above 107°F)
- 7 days/yr
- Hot days in 30 yrs
- 21 days/yr
Wind risk 9/10 · Severe
- Chance of severe wind over 30 yrs
- 99.0%
Air-quality risk 4/10 · Minor
- Unhealthy air days now
- 5 days/yr
- Unhealthy air days in 30 yrs
- 6 days/yr
Risk factors via First Street. Map © Google.
Why this score? — see what drove the B- grade
The composite is a weighted blend of 9 inputs, each scored 0–100. Each bar is that input's sub-score; the figure is the points it added to the 100-point composite (weight × sub-score).
- Cash flow +30.0/30.0
- 1% rule +10.0/10.0
- DSCR +10.0/10.0
- ARV discount +7.5/15.0
- Livability +3.3/5.0
- Schools +2.6/10.0
- Rent growth +2.5/5.0
- Condition / age +2.5/5.0
- Appreciation +0.0/10.0
$45,000
🖨 Deal sheet 📄 Offer letter ✓ Due diligence
Listing remarks
Real Estate Investor Special----2 Bed / 1 Bath Single-Family Home – Located in Quincy, FL—This property is an investor special with great bones and tons of upside! Low entry, renovate, and pocket a hefty return margin. With the right updates, this property can easily become a high-performing rental or a solid flip for a nice profit. Acquire this one with the mind to rebuild! Either totally renovate the home under it's current 2/2 footprint or enlarge the home to a 3/2 to increase your profit margin even more. Located minutes from grocery shopping, restaurants and dining. Quincy offers small-town charm, this location is just a short drive from Tallahassee. The area continues to g
Key facts
- 8,712 sq ft lot
- Parking
- Built 1945
Property features AI
Finance
- Other: Lot size approximately 0.2 acre
- Financial info: Offered for sale
Exterior
- Parking: Driveway
- Utilities: Public sewer
- Home design: Single-story; Crawlspace foundation
- Construction: Wood siding; Built on crawlspace
- Exterior features: Public maintained paved road; Lot dimensions approximately 100x90x100x90
Interior
- Bedrooms: Bedroom 2: 9x8
- Flooring: Plank; Vinyl
- Bathrooms: 2 full bathrooms
- Interior features: Plank and vinyl flooring
Neighborhood map
What this means for you Summary
Snapshot
- This is a 2-bed/1.0-bath single-family listed at $45k.
Deal economics
- At list price, monthly cash flow is $851 ($10k/yr) — positive.
- The deal already cash-flows at list — no discount required.
- Meets the 1% rule at list price ($1k rent vs $45k).
- Recommended offer: $44k (3.0% below list) — sets the bar for market timing.
- Cap rate 29.0% vs local median 3.9% in Quincy — top-decile yield for the area; either an underpriced asset or a hidden risk that comps aren't pricing in. Stress-test before assuming the spread holds.
Location & tenants
- Location reads 66/100 on livability (#588 in FL) — a middle-class / working-renter tenant base. Strengths: cost of living A+, health & safety B+; Watch: amenities F, commute F, employment F.
- Gadsden (rural): math 31% / reading 31% proficiency, ranked #70 of 73 in FL (top 96%) — families likely to look elsewhere, expect single-tenant / working-renter base with shorter leases; 83% free/reduced lunch — lower-income household profile, screen leases tightly.
- Market conditions: 117 active listings in the ZIP; 1 comparable units currently listed for rent nearby; 107 units permitted in Gadsden County in 2024 (36 in 5+ unit buildings).
Forward outlook
- Local home prices are declining (-3.0%/yr); year-one equity from $311 of loan paydown is wiped out by about $1k of value loss. Plan a longer hold.
- Gadsden County population projected at -27% by 2050 — secular population decline; favor cash flow + early exit over multi-decade hold.
- At projected returns (-3.0% appreciation + 3.0% rent growth), your $13k cash investment doubles in ~2 years — after that, you're playing with house money.
Negotiation context
- It's been on market 50 days — a 3% lower offer ($44k) is reasonable based on typical stale-listing flexibility.
- 3 sale attempts since 3y ago; this cycle's ask has dropped $5k (10%) from the opening price — seller is motivated, your offer sets the floor, not the list.
Risks & watch-outs
- Watch-outs: built in 1945 — expect roof / HVAC / electrical / plumbing capex.
- Climate carrying-cost: severe wind risk, 99% chance of damaging wind over 30y; extreme-heat days projected 7→21/yr by 2055 (HVAC capex compounding) — expect insurance premiums to compound above CPI over the hold.
Questions for the listing agent
- It's been on market 50 days. Have you received any prior offers? Is the seller open to a 3% concession, seller financing, or rate buy-down credit?
- Built in 1945 — when were the roof, HVAC, electrical panel, plumbing, and water heater last replaced?
- Is there a deadline driving the sale (1031 exchange, divorce, estate, relocation)? That informs how much negotiation room exists.
- What's the average days-on-market for RENTAL listings here right now (not sales)? A rising rental-DOM trend means longer vacancies and softer asking-rent achievability than the comps imply.
- What's the recent tenant-quality profile in this submarket — average credit score on applications, eviction rate, late-payment / NSF rate, and stable-employment percentage? A property-management company in the area should have these aggregated.
- How much new for-sale + rental construction is in the pipeline within 1–3 miles? Heavy new supply typically softens prices + rents 12–24 months out; constrained supply supports both.
Investment metrics
- 1% rule
- 3.22% ✓
- Cap rate
- 29.00%
- Cash-on-cash
- 81.08%
- DSCR
- 4.61
- GRM
- 2.6
CMA / ARV
- ARV (median comp)
- $113,809
- List price
- $45,000
- Delta
- -60.46%
- Verdict
- UNDERPRICED
- Comps
- 20 within 1.0 mi
Show comp detail 2 sales within ~0.75 mi
| Address | Dist | Beds/Ba | Sqft | Sold | Price | $/sf | Match |
|---|---|---|---|---|---|---|---|
| 733 S Shelfer St | 0.32mi | 3/1.0 (+1) | 1,040 (-2%) | 3mo | $140,000 | $135 | 74 |
| 513 Cooper St | 0.60mi | 3/2.0 (+1) | 1,071 (+1%) | 18mo | $125,000 | $117 | 47 |
Match score weights: distance 35% · size 25% · config 20% · recency 20%. Top-matched comps best support the ARV.
Projected returns pro-forma
-3.0% appreciation · 3.0% rent growth · sell at horizon
- IRR
- 81.3%
- Equity multiple
- 4.73×
- Total profit
- $46,945
- Equity at exit
- $6,710
- IRR
- 84.7%
- Equity multiple
- 9.79×
- Total profit
- $110,749
- Equity at exit
- $3,891
Cash invested: $12,600 (down + closing). Projections, not guarantees.
Landlord ↔ Tenant lean methodology
- Overall (STATE)
- 87 Strongly Landlord-Friendly
- State Florida
- 87 Strongly Landlord-Friendly · R+3
- County
- — inherits STATE
- City
- — inherits STATE
ZIP-level market 32351
- Home prices YoY
- -24.6%
- Active inventory
- 117
- Price-to-rent
- 2.6×
Monthly cashflow live
- Estimated rent
- $1,450 medium interval (Pro) →
- Mortgage (P&I)
- −$236
- Tax from tax record
- −$39 /mo · $473/yr
- Insurance
- −$19
- HOA
- −$0
- Vacancy / Maint / Mgmt
- −$304
- Net cashflow
- $851
Break-even live
UW: 25.0% down · 7.5% · 30yr · 1.5% tax · 5.0% vac · 8.0% maint · 8.0% mgmt
Financing live
Cash to close
- Down payment
- $11,250
- Closing costs
- $1,350
- Reserves months
- —
- Total cash needed
- —
Loan-product check · same deal, 3 products live
Conventional
25% down · 7.5% · 30yr
- Down + closing
- —
- Monthly P&I
- —
- Monthly cashflow
- —
- DSCR
- —
- Eligible?
- —
Personal DTI + credit; lowest rate.
DSCR
20% down · 8.5% · 30yr
- Down + closing
- —
- Monthly P&I
- —
- Monthly cashflow
- —
- DSCR
- —
- Eligible?
- —
No personal income docs; deal must DSCR.
Hard money
10% down · 12.0% · 12mo
- Down + closing
- —
- Monthly P&I
- —
- Monthly cashflow
- —
- DSCR
- —
- Eligible?
- —
Short-term bridge; refi at stabilization.
Rent comps 1 comps
| Address | Beds | Baths | Sqft | Rent | $/sqft | DOM | Units | Dist |
|---|---|---|---|---|---|---|---|---|
| 216 S Jackson St Quincy, FL | 3.0 | 2.0 | 1068 | $1,450 | $1.36 | 13d | 1 | 1.21mi |
Listing history 21 events
-
2026-06-16days on market $45,000 Active 50 DOM
-
2026-06-15days on market $45,000 Active 49 DOM
-
2026-06-14days on market $45,000 Active 47 DOM
-
2026-06-13days on market $45,000 Active 46 DOM
-
2026-06-10days on market $45,000 Active 44 DOM
-
2026-06-09days on market $45,000 Active 43 DOM
-
2026-06-08days on market $45,000 Active 42 DOM
-
2026-06-07days on market $45,000 Active 41 DOM
-
2026-06-05days on market $45,000 Active 38 DOM
-
2026-06-03days on market $45,000 Active 37 DOM
-
2026-06-02days on market $45,000 Active 36 DOM
-
2026-06-01days on market $45,000 Active 35 DOM
-
2026-05-31days on market $45,000 Active 34 DOM
-
2026-05-30days on market $45,000 Active 33 DOM
-
2026-04-27$50,000 Active 975-char remark
-
2024-02-25historical
-
2023-12-31price $18,000
-
2023-12-31price $19,900
-
2023-12-31status Active
-
2023-10-09status Pending
-
2023-08-24$18,000 Active
ⓘ Source: listings_history table (triggers on properties + properties_extension) + one-shot
backfill from property_details.listing_events for pre-trigger history.
Tax reassessment forecast FL · Resets to sale price
- Current annual tax
- $473 · $39/mo
- Projected year-2 tax
- $473 · $39/mo
- Expected delta
- $0/yr ($0/mo · 0.0%)
ⓘ Screening estimate from a state-policy table — verify with the county assessor before closing.
Climate risk First Street
- Flood 1/10 Low FEMA zone X (unshaded) · 0% chance over 30 yrs
- Wildfire 3/10 Moderate
- Heat 8/10 Severe 7 d/yr ≥107°F today · 21 d/yr by 30 yrs out
- Wind 9/10 Extreme 99% chance of damaging wind over 30 yrs
- Air quality 4/10 Moderate 5 unhealthy d/yr today · 6 by 30 yrs out
Nearby sold comps map
Loading sold comps map…
Walkable amenities ~0.75 mi
Loading nearby amenities…
Taxation est. · year 1
- Rental income
- $17,400
- − Mortgage interest
- −$2,521
- − Property taxes
- −$473
- − Insurance
- −$225
- − Repairs & maintenance
- −$1,392
- − Management
- −$1,392
- − Depreciation
- −$1,309
- Taxable income
- $10,089
- Est. tax owed @ 24.0%
- −$2,421
- After-tax cash flow
- $7,795/yr
For passive investors: Depreciation is non-cash, so a rental often shows a tax loss while cash-flowing — sheltering income. Rental losses are passive: they offset passive income freely, and up to $25,000/yr can offset ordinary (W-2) income if you actively participate and your MAGI is under $100k (phasing out to $0 by $150k); unused losses carry forward. On sale, claimed depreciation is recaptured at up to 25%, and gains may owe capital-gains tax (a 1031 exchange can defer both). Figures are a year-1 estimate at your 24.0% rate — not tax advice; consult a CPA.
Schools (NCES district)
- District
- Gadsden
- NCES district ID
- 1200600
- Math proficiency
- 31% ▼ -16.00%
- Reading proficiency
- 31% ▼ -7.00%
- Median HH income
- $36,470
- Composite
- 25.75/100
- National rank
- #7373
- State rank
- #70 of 73 in FL
Livability — Quincy
- Score
- 66/100
- State rank
- #588
- US rank
- #11260
Category grades
Schools grade is shown separately in the Schools card above.
Census & demographics
- Census place
- Quincy, FL
- Population (ZIP)
- 16,808
Population outlook (Gadsden County) Hauer SSP2
- Today (2025)
- 42,956 people
- By 2030
- 40,878 · -4.8%
- By 2040
- 36,218 · -15.7%
- By 2050
- 31,502 · -26.7%
- By 2075
- 21,828 · -49.2%
- By 2100
- 14,480 · -66.3%
Race, ethnicity, and origin ACS 2023
- Neighborhood character
- Diverse neighborhood (Simpson 0.61)
- Race & ethnicity
- Black 54% White 27% Hispanic / Latino 17% Two or more races 5% Native American 2%
- Hispanic origin (detail)
- Mexican 11%
- Common ancestry
- Serbian 1% Slovak 1% Romanian 1%
- Foreign-born
- 8% · Canada
- Languages at home
- 85% English-only · Spanish 14%
Political lean MEDSL · Gadsden
- 2024 margin
- Solid D (+30.7) · D 65.0% · R 34.3%
- 2008→2024 swing
- -8.3pp toward R · 2008: 39.0pp · 2024: 30.7pp
- All cycles
- 2024: D+30.7 2020: D+36.6 2016: D+37.5 2012: D+40.6 2008: D+39.0
Not yet ingested
- Civics
- —
Market trends
- HPI YoY
- ▼ -52.50%
- Current HPI
- 161.1446
- Rent YoY
- —
- Metro
- —
- State GDP YoY
- ▲ 3.28%
- F500 in state
- 36
Industry mix (Fortune 500 HQ in FL)
| Industry | F500 HQs | Revenue |
|---|---|---|
| Industrial Technology | 2 | $29B |
|
||
| Insurance | 2 | $17B |
|
||
| Retail | 1 | $60B |
|
||
| Technology Distribution | 1 | $58B |
|
||
| Homebuilding | 1 | $35B |
|
||
| Technology Manufacturing | 1 | $35B |
|
||
Price history
+150.0% since first listed9 events — show timeline
- 2026-06-16 Listing Removed — CATRS
- 2026-05-22 Price Changed $45,000 CATRS
- 2026-04-27 Listed $50,000 CATRS
- 2024-02-25 Listing Removed — Beaches MLS
- 2023-12-31 Price Changed $18,000 Beaches MLS
- 2023-12-31 Price Changed $19,900 Beaches MLS
- 2023-12-31 Relisted — Beaches MLS
- 2023-10-09 Pending — Beaches MLS
- 2023-08-24 Listed $18,000 Beaches MLS
Property tax history
+19.8%/yrLatest (2025): $473 · +2.7% YoY. Source: county tax records.
Cash-flow waterfall
monthlySold comps — $/sqft
last 12 mo · ≤1 miLoading sold comps…