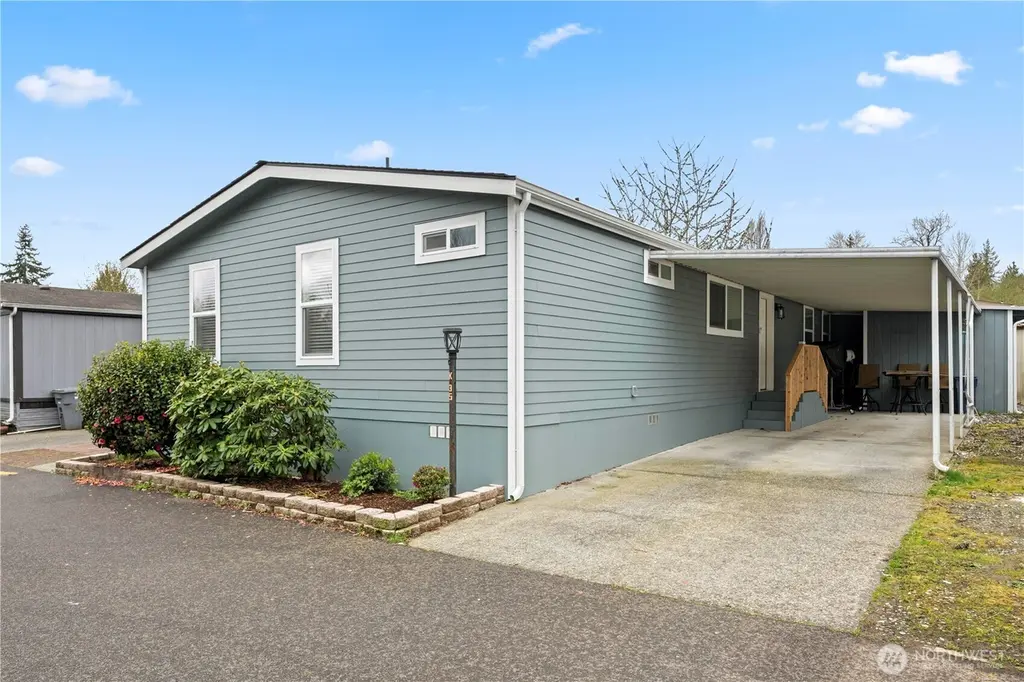
415 Lakeview Rd Unit K35 · Martha Lake, WA
Flood risk No data
- FEMA flood zone
- —
- Chance of flooding over 30 yrs
- —
- Est. flood insurance / yr
- —
Fire risk No data
- Est. fire insurance / yr
- —
Heat risk No data
- Hot days now (above threshold)
- —
- Hot days in 30 yrs
- —
Wind risk No data
- Chance of severe wind over 30 yrs
- —
Air-quality risk No data
- Unhealthy air days now
- —
- Unhealthy air days in 30 yrs
- —
Risk factors via First Street. Map © Google.
Why this score? — see what drove the C+ grade
The composite is a weighted blend of 9 inputs, each scored 0–100. Each bar is that input's sub-score; the figure is the points it added to the 100-point composite (weight × sub-score).
- Cash flow +24.9/30.0
- DSCR +8.1/10.0
- ARV discount +7.5/15.0
- Schools +5.4/10.0
- 1% rule +5.3/10.0
- Livability +4.2/5.0
- Rent growth +2.8/5.0
- Condition / age +2.5/5.0
- Appreciation +0.0/10.0
$275,000
🖨 Deal sheet 📄 Offer letter ✓ Due diligence
Listing remarks
Better than new! This home was completely remodeled last year. Starting with a new roof all the way down to the crawl space! Brand-new stainless-steel appliances, top of the line washer and dryer, brand-new furnace and water heater as well! turnkey and ready to go. Rare 4 bedroom in an all-ages park in a convenient location. Only minutes to I-5 and I-405 for the commuters dream. 3 parking spaces as well! Finished 12x14 shed with power off the carport. Could use for storage or could easily be turned into a craft room or gym! Don't miss out!
Key facts
- New furnace
- Remodeled
- New water heater
Tags
Neighborhood map
What this means for you Summary
Snapshot
- This is a 2-bed/2.0-bath manufactured listed at $275k.
Deal economics
- At list price, monthly cash flow is $595 ($7k/yr) — positive.
- The deal already cash-flows at list — no discount required.
- Meets the 1% rule at list price ($3k rent vs $275k).
- Recommended offer: $258k (6.0% below list) — sets the bar for market timing.
- Cap rate 8.9% vs local median 2.0% in Martha Lake — top-decile yield for the area; either an underpriced asset or a hidden risk that comps aren't pricing in. Stress-test before assuming the spread holds.
Location & tenants
- Location reads 84/100 on livability (#44 in WA, #775 nationally) — a professional / high-income tenant draw. Strengths: commute A+, employment A+, housing A+; Watch: schools D, cost of living F.
- Edmonds School District (suburban): math 54% / reading 65% proficiency, ranked #53 of 291 in WA (top 18%) — acceptable for families but not a draw, mixed tenant base, ~2y average lease.
- Market conditions: Rents rising (+1.2%/yr); 232 active listings in the ZIP; 34 comparable units currently listed for rent nearby; rentals leasing fast (median 5d on market — plan ~1-2 weeks tenant-placement turnaround); solid renter incomes; 3,982 units permitted in Snohomish County in 2024 (1,492 in 5+ unit buildings).
- This rent runs 32% of the median local income ($107k/yr) — at the standard rent-burdened threshold; future hikes will face affordability resistance.
Forward outlook
- Local home prices are declining (-3.0%/yr); year-one equity from $2k of loan paydown is wiped out by about $8k of value loss. Plan a longer hold.
- Snohomish County population projected at +30% by 2050 — long-run rental-demand tailwind backs the buy-and-hold thesis.
Negotiation context
- It's been on market 61 days — a 6% lower offer ($258k) is reasonable based on typical stale-listing flexibility.
- 5 sale attempts since 26y ago with the ask held roughly flat each time — persistent listings suggest the price (not the market) is what's stuck; bring a comps-based counter.
Questions for the listing agent
- It's been on market 61 days. Have you received any prior offers? Is the seller open to a 6% concession, seller financing, or rate buy-down credit?
- Why hasn't it sold? Are there any deal-killer items the seller is aware of (foundation, flood, title, zoning, code violations)?
- Is there a deadline driving the sale (1031 exchange, divorce, estate, relocation)? That informs how much negotiation room exists.
- Schools are D-rated, which usually means shorter tenancies and higher turnover. Who's the typical renter profile here, and what's been the actual vacancy rate?
- What's the average days-on-market for RENTAL listings here right now (not sales)? A rising rental-DOM trend means longer vacancies and softer asking-rent achievability than the comps imply.
- What's the recent tenant-quality profile in this submarket — average credit score on applications, eviction rate, late-payment / NSF rate, and stable-employment percentage? A property-management company in the area should have these aggregated.
- How much new for-sale + rental construction is in the pipeline within 1–3 miles? Heavy new supply typically softens prices + rents 12–24 months out; constrained supply supports both.
Investment metrics
- 1% rule
- 1.03% ✓
- Cap rate
- 8.89%
- Cash-on-cash
- 9.27%
- DSCR
- 1.41
- GRM
- 8.1
CMA / ARV
- ARV (median comp)
- $139,311
- List price
- $275,000
- Delta
- 97.40%
- Verdict
- OVERPRICED
- Comps
- 2 within 1.0 mi
Show comp detail 2 sales within ~0.75 mi
| Address | Dist | Beds/Ba | Sqft | Sold | Price | $/sf | Match |
|---|---|---|---|---|---|---|---|
| 415 Lakeview Rd Unit K10 | 0.00mi | 3/2.0 (+1) | 1,512 (-5%) | 14mo | $177,000 | $117 | 75 |
| 415 Lake View Rd Unit K13 | 0.00mi | 2/2.0 | 1,404 (-12%) | 18mo | $110,000 | $78 | 65 |
Match score weights: distance 35% · size 25% · config 20% · recency 20%. Top-matched comps best support the ARV.
Projected returns pro-forma
-3.0% appreciation · 1.22% rent growth · sell at horizon
- IRR
- -4.2%
- Equity multiple
- 0.85×
- Total profit
- $-11,803
- Equity at exit
- $41,003
- IRR
- 3.5%
- Equity multiple
- 1.24×
- Total profit
- $18,250
- Equity at exit
- $23,777
Cash invested: $77,000 (down + closing). Projections, not guarantees.
Landlord ↔ Tenant lean methodology
- Overall (STATE)
- 28 Tenant-Leaning
- State Washington
- 28 Tenant-Leaning · D+8
- County
- — inherits STATE
- City
- — inherits STATE
ZIP-level market 98087
- Rents YoY
- 1.2%
- Active inventory
- 232
- Price-to-rent
- 8.1×
Monthly cashflow live
- Estimated rent
- $2,838 high interval (Pro) →
- Mortgage (P&I)
- −$1,442
- Tax from tax record
- −$90 /mo · $1,085/yr
- Insurance
- −$115
- HOA
- −$0
- Vacancy / Maint / Mgmt
- −$596
- Net cashflow
- $595
Break-even live
UW: 25.0% down · 7.5% · 30yr · 1.5% tax · 5.0% vac · 8.0% maint · 8.0% mgmt
Financing live
Cash to close
- Down payment
- $68,750
- Closing costs
- $8,250
- Reserves months
- —
- Total cash needed
- —
Loan-product check · same deal, 3 products live
Conventional
25% down · 7.5% · 30yr
- Down + closing
- —
- Monthly P&I
- —
- Monthly cashflow
- —
- DSCR
- —
- Eligible?
- —
Personal DTI + credit; lowest rate.
DSCR
20% down · 8.5% · 30yr
- Down + closing
- —
- Monthly P&I
- —
- Monthly cashflow
- —
- DSCR
- —
- Eligible?
- —
No personal income docs; deal must DSCR.
Hard money
10% down · 12.0% · 12mo
- Down + closing
- —
- Monthly P&I
- —
- Monthly cashflow
- —
- DSCR
- —
- Eligible?
- —
Short-term bridge; refi at stabilization.
Rent comps 34 comps
| Address | Beds | Baths | Sqft | Rent | $/sqft | DOM | Units | Dist |
|---|---|---|---|---|---|---|---|---|
| 1011 147th St SW Lynnwood, WA | 3.0 | 2.5 | 2243 | $3,500 | $1.56 | 43d | 1 | 0.47mi |
| 15319 Ash Way Lynnwood, WA | 2.0–3.0 | 2.5 | 1366 | $2,695 | $1.97 | 43d | 2 | 0.57mi |
| 609 142nd St SW Lynnwood, WA | 3.0 | 2.0 | 1646 | $3,399 | $2.07 | 43d | 1 | 0.65mi |
| 1602 151st Pl SW Lynnwood, WA | 3.0 | 2.5 | 1597 | $3,800 | $2.38 | 24d | 1 | 0.68mi |
| 14615 Madison Way Lynnwood, WA | 2.0–4.0 | 2.0 | 1288 | $1,899 | $1.47 | 4d | 1 | 0.71mi |
| 15 164th St SW Bothell, WA | 3.0 | 2.5 | 1522 | $2,895 | $1.90 | 13d | 1 | 0.78mi |
| 15631 Ash Way Lynnwood, WA | 2.0 | 1.0–2.0 | 786 | $2,401 | $3.05 | 2d | 18 | 0.79mi |
| 16201 Meadow Rd Unit B1 Lynnwood, WA | 3.0 | 2.5 | 1971 | $3,200 | $1.62 | 4d | 1 | 0.80mi |
| 1717 153rd St SW Lynnwood, WA | 3.0 | 1.5 | 1372 | $3,100 | $2.26 | 43d | 1 | 0.80mi |
| 15706 Ash Way Unit 1234677P Lynnwood, WA | 2.0 | 1.0 | 1991 | $5,350 | $2.69 | 12d | 1 | 0.81mi |
| 14509 16th Pl W Lynnwood, WA | 3.0 | 2.5 | 1920 | $3,500 | $1.82 | 4d | 1 | 0.83mi |
| 16619 Larch Way Lynnwood, WA | 1.0–3.0 | 1.0–2.0 | 1005 | $2,334 | $2.32 | 2d | 13 | 0.84mi |
| 418 138th Pl SW Everett, WA | 3.0 | 2.0 | 1600 | $3,000 | $1.88 | 43d | 1 | 0.86mi |
| 16626 6th Ave W Lynnwood, WA | 1.0–3.0 | 1.0–2.0 | 904 | $2,043 | $2.26 | 1d | 7 | 0.89mi |
| 16605 6th Ave W Lynnwood, WA | 3.0 | 1.0–2.0 | 953 | $1,888 | $1.98 | 1d | 9 | 0.89mi |
| 13921 12th Pl W Lynnwood, WA | 3.0 | 3.5 | 2175 | $3,600 | $1.66 | 24d | 1 | 0.91mi |
| 16503 13th Ave W Unit B2 Lynnwood, WA | 3.0 | 3.0 | 1614 | $3,200 | $1.98 | 43d | 1 | 0.93mi |
| 16503 13th Ave W Unit B10 Lynnwood, WA | 3.0 | 3.0 | 1614 | $3,250 | $2.01 | 43d | 1 | 0.93mi |
| 16503 13th Ave W Unit B4 Lynnwood, WA | 3.0 | 3.0 | 1614 | $3,200 | $1.98 | 24d | 1 | 0.93mi |
| 1830 145th St SW Lynnwood, WA | 3.0 | 2.5 | 1873 | $3,500 | $1.87 | 16d | 1 | 0.95mi |
| 16720 6th Ave W Lynnwood, WA | 1.0–3.0 | 1.0–2.0 | 826 | $2,081 | $2.52 | 1d | 10 | 0.96mi |
| 16720 North Rd Bothell, WA | 1.0–3.0 | 1.0–2.0 | 926 | $2,032 | $2.19 | 4d | 3 | 0.96mi |
| 14701 Main St Mill Creek, WA | 1.0–3.0 | 1.0–2.0 | 998 | $2,570 | $2.57 | 1d | 15 | 1.01mi |
| 16116 Ash Way Lynnwood, WA | 1.0–3.0 | 1.0–2.0 | 1000 | $2,420 | $2.42 | 2d | 9 | 1.06mi |
| 14420 N Creek Dr Mill Creek, WA | 1.0–3.0 | 1.0–2.0 | 1117 | $2,672 | $2.39 | 1d | 25 | 1.09mi |
| 15520 Mill Creek Blvd Mill Creek, WA | 2.0 | 2.0 | 1117 | $2,473 | $2.21 | 1d | 8 | 1.11mi |
| 16101 Bothell Everett Hwy Unit E207 Mill Creek, WA | 3.0 | 2.0 | 1077 | $2,600 | $2.41 | 4d | 1 | 1.22mi |
| 16605 Ash Way Lynnwood, WA | 2.0 | 1.0–2.0 | 802 | $3,125 | $3.89 | 2d | 71 | 1.31mi |
| 13004 Meridian Ave S Everett, WA | 1.0–3.0 | 1.0–2.0 | 1025 | $1,961 | $1.91 | 1d | 1 | 1.36mi |
| 13117 3rd Ave SE Unit J1 Everett, WA | 3.0 | 3.0 | 1659 | $3,249 | $1.96 | 43d | 1 | 1.41mi |
| 13730 Manor Way Unit F2 Lynnwood, WA | 3.0 | 3.5 | 1626 | $3,400 | $2.09 | 43d | 1 | 1.41mi |
| 13510 N Creek Dr Mill Creek, WA | 1.0–4.0 | 1.0–2.0 | 1020 | $1,642 | $1.61 | 3d | 1 | 1.47mi |
| 15433 Country Club Dr Unit A204 Mill Creek, WA | 3.0 | 2.0 | 1152 | $2,850 | $2.47 | 17d | 1 | 1.48mi |
| 15433 Country Club Dr Unit A204 Mill Creek, WA | 3.0 | 2.0 | 1152 | $2,700 | $2.34 | 4d | 1 | 1.48mi |
Listing history 25 events
-
2026-06-18days on market $275,000 Active 61 DOM
-
2026-06-17days on market $275,000 Active 60 DOM
-
2026-06-16days on market $275,000 Active 59 DOM
-
2026-06-15days on market $275,000 Active 58 DOM
-
2026-06-13days on market $275,000 Active 56 DOM
-
2026-06-13days on market $275,000 Active 55 DOM
-
2026-06-09days on market $275,000 Active 52 DOM
-
2026-06-08days on market $275,000 Active 51 DOM
-
2026-06-07days on market $275,000 Active 50 DOM
-
2026-06-04days on market $275,000 Active 47 DOM
-
2026-06-03days on market $275,000 Active 46 DOM
-
2026-06-02days on market $275,000 Active 45 DOM
-
2026-06-01days on market $275,000 Active 44 DOM
-
2026-05-31days on market $275,000 Active 43 DOM
-
2026-04-18$275,000 Active
-
2025-04-09soldstatus $250,000
-
2025-04-01soldstatus $250,000
-
2025-04-01$250,000
-
2017-11-30soldstatus $65,000 Sold
-
2017-11-02status Pending Inspection
-
2017-10-05$69,500 Active
-
2004-01-07soldstatus $32,500
-
2003-11-03$39,500
-
2000-06-22soldstatus $65,000
-
2000-05-11$65,000
ⓘ Source: listings_history table (triggers on properties + properties_extension) + one-shot
backfill from property_details.listing_events for pre-trigger history.
Tax reassessment forecast WA · Resets to sale price
- Current annual tax
- $1,085 · $90/mo
- Projected year-2 tax
- $2,695 · $225/mo
- Expected delta
- +$1,610/yr (+$134/mo · 148.3%)
ⓘ Screening estimate from a state-policy table — verify with the county assessor before closing.
Nearby sold comps map
Loading sold comps map…
Walkable amenities ~0.75 mi
Loading nearby amenities…
Taxation est. · year 1
- Rental income
- $34,051
- − Mortgage interest
- −$15,404
- − Property taxes
- −$1,085
- − Insurance
- −$1,375
- − Repairs & maintenance
- −$2,724
- − Management
- −$2,724
- − Depreciation
- −$8,000
- Taxable income
- $2,738
- Est. tax owed @ 24.0%
- −$657
- After-tax cash flow
- $6,477/yr
For passive investors: Depreciation is non-cash, so a rental often shows a tax loss while cash-flowing — sheltering income. Rental losses are passive: they offset passive income freely, and up to $25,000/yr can offset ordinary (W-2) income if you actively participate and your MAGI is under $100k (phasing out to $0 by $150k); unused losses carry forward. On sale, claimed depreciation is recaptured at up to 25%, and gains may owe capital-gains tax (a 1031 exchange can defer both). Figures are a year-1 estimate at your 24.0% rate — not tax advice; consult a CPA.
Schools (NCES district)
- District
- Edmonds School District
- NCES district ID
- 5302400
- Math proficiency
- 54% ▼ -1.00%
- Reading proficiency
- 65% ▬ 0.00%
- Median HH income
- $67,451
- Composite
- 53.94/100
- National rank
- #3026
- State rank
- #53 of 291 in WA
Livability — Martha Lake
- Score
- 84/100
- State rank
- #44
- US rank
- #775
Category grades
Schools grade is shown separately in the Schools card above.
Census & demographics
- Census place
- Martha Lake, WA
- County
- Snohomish County · 786,756 people
- Metro
- Seattle-Tacoma-Bellevue, WA
- Population (ZIP)
- 41,796
- Household income
- $106,693
- Rent vs Own
- Severe rent burden
- 2303.0
Population outlook (Snohomish County) Hauer SSP2
- Today (2025)
- 899,800 people
- By 2030
- 960,975 · +6.8%
- By 2040
- 1,074,447 · +19.4%
- By 2050
- 1,171,954 · +30.2%
- By 2075
- 1,384,849 · +53.9%
- By 2100
- 1,497,296 · +66.4%
Race, ethnicity, and origin ACS 2023
- Neighborhood character
- Highly diverse neighborhood (Simpson 0.71)
- Race & ethnicity
- White 48% Asian 20% Two or more races 13% Hispanic / Latino 12% Black 8% Pacific Islander 2%
- Hispanic origin (detail)
- Mexican 8%
- Common ancestry
- Portuguese 3% Slovak 3% Italian 3%
- Foreign-born
- 29% · Canada, South Korea, Vietnam
- Languages at home
- 64% English-only · Spanish 6% Russian/Polish/Slavic 5% Other Indo-European 5%
Political lean MEDSL · Snohomish
- 2024 margin
- D (+19.0) · D 57.8% · R 38.9% · Other 3.3%
- 2008→2024 swing
- +0.1pp no change · 2008: 18.9pp · 2024: 19.0pp
- All cycles
- 2024: D+19.0 2020: D+20.6 2016: D+16.6 2012: D+16.2 2008: D+18.9
Not yet ingested
- Civics
- —
Market trends
- HPI YoY
- ▼ -723.54%
- Current HPI
- 320.6888
- Rent YoY
- ▲ 1.22%
- Metro
- Seattle-Tacoma-Bellevue, WA
- State GDP YoY
- ▲ 4.65%
- F500 in state
- 22
Industry mix (Fortune 500 HQ in WA)
| Industry | F500 HQs | Revenue |
|---|---|---|
| Retail | 2 | $269B |
|
||
| Technology / Retail | 1 | $638B |
|
||
| Technology | 1 | $245B |
|
||
| Telecommunications | 1 | $38B |
|
||
| Food / Beverage | 1 | $36B |
|
||
| Automotive / Trucks | 1 | $34B |
|
||
Price history
+323.1% since first listed11 events — show timeline
- 2026-04-18 Listed $275,000 NWMLS as Distributed by MLS Grid
- 2025-04-09 Sold (Public Records) $250,000 Public Records
- 2025-04-01 Listed $250,000 NWMLS as Distributed by MLS Grid
- 2025-04-01 Sold (MLS) $250,000 NWMLS as Distributed by MLS Grid
- 2017-11-30 Sold (MLS) $65,000 NWMLS as Distributed by MLS Grid
- 2017-11-02 Pending — NWMLS as Distributed by MLS Grid
- 2017-10-05 Listed $69,500 NWMLS as Distributed by MLS Grid
- 2004-01-07 Sold (MLS) $32,500 NWMLS as Distributed by MLS Grid
- 2003-11-03 Listed $39,500 NWMLS as Distributed by MLS Grid
- 2000-06-22 Sold (MLS) $65,000 NWMLS as Distributed by MLS Grid
- 2000-05-11 Listed $65,000 NWMLS as Distributed by MLS Grid
Property tax history
+6.4%/yrLatest (2026): $1,085 · +9.9% YoY. Source: county tax records.
Cash-flow waterfall
monthlySold comps — $/sqft
last 12 mo · ≤1 miLoading sold comps…