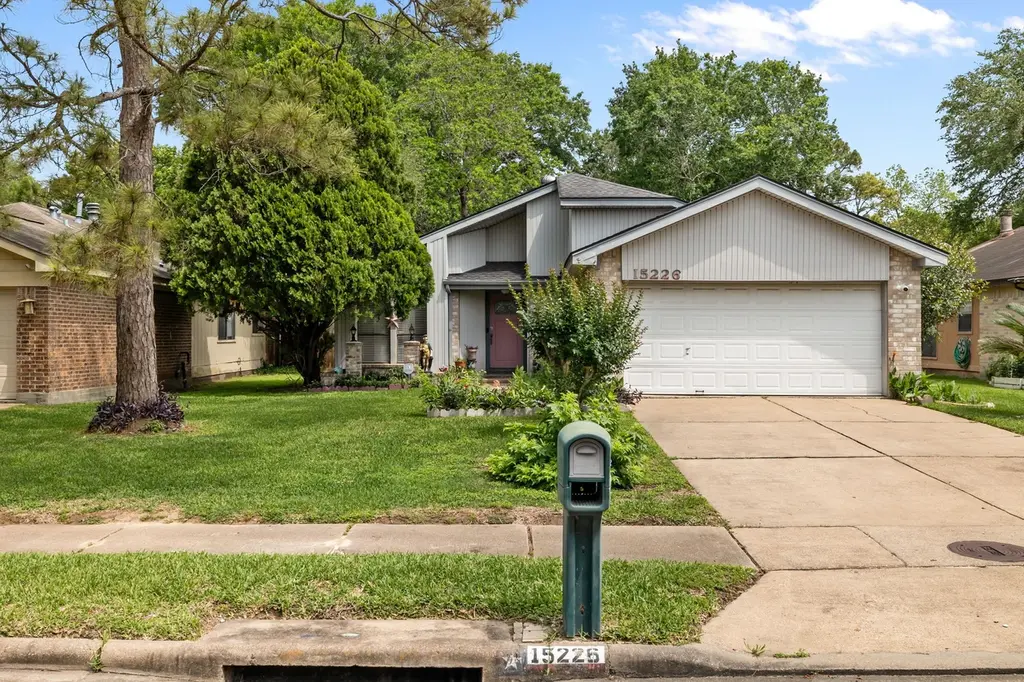
15226 Loma Paseo Dr · Mission Bend, TX
Flood risk 3/10 · Minor
- FEMA flood zone
- X (unshaded)
- Chance of flooding over 30 yrs
- 0.18%
- Est. flood insurance / yr
- $507 – $1,088
Fire risk 1/10 · Minimal
- Est. fire insurance / yr
- $1,222 – $2,270
Heat risk 9/10 · Severe
- Hot days now (above 110°F)
- 7 days/yr
- Hot days in 30 yrs
- 23 days/yr
Wind risk 9/10 · Severe
- Chance of severe wind over 30 yrs
- 99.0%
Air-quality risk 2/10 · Minimal
- Unhealthy air days now
- 1 days/yr
- Unhealthy air days in 30 yrs
- 2 days/yr
Risk factors via First Street. Map © Google.
Why this score? — see what drove the D grade
The composite is a weighted blend of 9 inputs, each scored 0–100. Each bar is that input's sub-score; the figure is the points it added to the 100-point composite (weight × sub-score).
- ARV discount +12.6/15.0
- Cash flow +10.1/30.0
- Schools +4.5/10.0
- 1% rule +3.3/10.0
- Livability +3.2/5.0
- Rent growth +3.0/5.0
- DSCR +2.9/10.0
- Condition / age +2.5/5.0
- Appreciation +0.0/10.0
$230,000
🖨 Deal sheet (PDF) 📄 Offer letter ✓ Due diligence
Listing remarks
Welcome home to 15226 Loma Paseo Drive. NEW ROOF, NEW A/C, NEVER FLOODED. This beautiful home is located in Mission Bend San Miguel. This charming home features 3 bedrooms and 2 full bathrooms, offering a perfect and functional layout for growing families and first time home buyers. Close to shopping, dining, Fort Bend Schools and parks this home is a must see. Schedule your showing today.
Key facts
- 6,743 sq ft lot
- 2 garage spots
- Built 1981
Property features AI
Finance
- Other: Seller disclosure available
- HOA & community: San Miguel Civic Association with an annual fee of $144
Exterior
- Parking: Attached 2-car garage
- Security: Smoke detectors
- Utilities: Public water; Public sewer
- Home design: Residential property; Built in 1981; Slab foundation; Composition roof; Concrete road access; Subdivision lot
- Construction: Brick construction
- Exterior features: Fenced backyard; Porch
Interior
- Kitchen: Double oven; Gas cooktop; Dishwasher; Garbage disposal; Microwave; Refrigerator
- Bedrooms: Primary bedroom (First floor) — 17x11; Bedroom (First floor) — 11x9; Bedroom (First floor) — 11x9
- Flooring: Laminate; Tile
- Bathrooms: 2 full bathrooms; Primary bathroom (First floor) — 5x8; Bathroom (First floor) — 11x5
- Heating & cooling: Central heating (Gas); Central air (Electric)
- Interior features: One fireplace; Pots & pan drawers; Tub with shower; Ceiling fans
- Laundry & utility: Washer; Dryer
Neighborhood map
What this means for you Summary
Snapshot
- This is a 3-bed/2.0-bath single-family listed at $230k.
Deal economics
- At list price, monthly cash flow is $-135 ($-2k/yr) — negative.
- To cash-flow at today's rent, offer at most $206k (10.3% below list).
- To meet the 1% rule (rent ≥ 1% of price), the offer needs to be $191k (16.8% below list).
- Recommended offer: $191k (16.8% below list) — sets the bar for 1% rule.
- Cap rate 5.6% vs local median 4.2% in Mission Bend — top-decile yield for the area; either an underpriced asset or a hidden risk that comps aren't pricing in. Stress-test before assuming the spread holds.
Location & tenants
- Location reads 65/100 on livability (#715 in TX) — a middle-class / working-renter tenant base. Strengths: cost of living A+, housing A+; Watch: crime D-, amenities F, commute F.
- Fort Bend ISD (suburban): math 44% / reading 53% proficiency, ranked #140 of 826 in TX (top 17%) — families likely to look elsewhere, expect single-tenant / working-renter base with shorter leases.
- Zoned schools: Mission Glen El (math 22% / reading 37%, grade F, #2,525 of 4,322 statewide, top 62%, 370 students, 84% FRL); Fort Bend Co Alter (26 students, 0% FRL).
- Zoned-school proficiency averages 30% at this address vs 48% district-wide (-19 pts) — the specific schools serving this property underperform the Fort Bend ISD average; the district grade overstates school quality for this exact location.
- Market conditions: Rents rising (+1.9%/yr); 263 active listings in the ZIP; 12 comparable units currently listed for rent nearby; rentals at typical pace (median 27d on market — plan ~3-4 weeks tenant-placement turnaround); 42% of comp listings sitting > 30 days — soft ceiling on asking rent; 12,093 units permitted in Fort Bend County in 2024 (815 in 5+ unit buildings).
- This rent runs 36% of the median local income ($64k/yr) — at the standard rent-burdened threshold; future hikes will face affordability resistance.
Forward outlook
- Local home prices are declining (-3.0%/yr); year-one equity from $2k of loan paydown is wiped out by about $7k of value loss. Plan a longer hold.
- Fort Bend County population projected at +75% by 2050 — long-run rental-demand tailwind backs the buy-and-hold thesis.
Negotiation context
- It's been on market 27 days — a 2% lower offer ($227k) is reasonable based on typical stale-listing flexibility.
Risks & watch-outs
- Climate carrying-cost: severe wind risk, 99% chance of damaging wind over 30y; extreme-heat days projected 7→23/yr by 2055 (HVAC capex compounding) — expect insurance premiums to compound above CPI over the hold.
Questions for the listing agent
- What do current leases actually rent for vs. the listed asking? Can we see a recent rent roll and the last 12 months of T-12 income?
- What does the HOA fee cover, when was the last increase, and are there any pending special assessments or reserve-fund shortfalls?
- Is there a deadline driving the sale (1031 exchange, divorce, estate, relocation)? That informs how much negotiation room exists.
- Schools are D-rated, which usually means shorter tenancies and higher turnover. Who's the typical renter profile here, and what's been the actual vacancy rate?
- Crime grade is D in this area — have there been break-ins, vandalism, or insurance claims at this property in the last 3 years? What carrier currently insures it and at what premium?
- The area grade is low — what's the realistic commute time and amenity access for the typical tenant pool here? Any planned neighborhood developments (good or bad) we should know about?
- What's the average days-on-market for RENTAL listings here right now (not sales)? A rising rental-DOM trend means longer vacancies and softer asking-rent achievability than the comps imply.
- What's the recent tenant-quality profile in this submarket — average credit score on applications, eviction rate, late-payment / NSF rate, and stable-employment percentage? A property-management company in the area should have these aggregated.
- How much new for-sale + rental construction is in the pipeline within 1–3 miles? Heavy new supply typically softens prices + rents 12–24 months out; constrained supply supports both.
Investment metrics
- 1% rule
- 0.83% ✗
- Cap rate
- 5.59%
- Cash-on-cash
- -2.51%
- DSCR
- 0.89
- GRM
- 10.0
CMA / ARV
- ARV (median comp)
- $259,309
- List price
- $230,000
- Delta
- -11.30%
- Verdict
- UNDERPRICED
- Comps
- 20 within 1.0 mi
Show comp detail 12 sales within ~0.75 mi
| Address | Dist | Beds/Ba | Sqft | Sold | Price | $/sf | Match |
|---|---|---|---|---|---|---|---|
| 8118 Vista Del Sol Dr | 0.13mi | 3/2.0 | 1,868 (0%) | 1mo | $269,000 | $144 | 93 |
| 8011 Suspiro Dr | 0.41mi | 3/2.0 | 1,833 (-2%) | 2mo | $250,000 | $136 | 76 |
| 15526 Camino Del Sol Dr | 0.59mi | 3/2.0 | 1,876 (+0%) | 3mo | $250,000 | $133 | 69 |
| 8026 Suspiro Dr | 0.41mi | 4/2.0 (+1) | 1,818 (-3%) | 3mo | $249,000 | $137 | 69 |
| 14631 Alannah Lagoon Ct | 0.51mi | 3/2.5 | 1,802 (-4%) | 2mo | $269,000 | $149 | 67 |
| 9123 Chesney Downs Dr | 0.66mi | 3/2.0 | 1,849 (-1%) | 2mo | $305,000 | $165 | 65 |
| 15519 Montesa Dr | 0.34mi | 4/2.0 (+1) | 2,017 (+8%) | 1mo | $289,000 | $143 | 65 |
| 14735 Delbarton Dr | 0.51mi | 3/2.0 | 2,024 (+8%) | 0mo | $285,000 | $141 | 62 |
| 15818 Beechnut St | 0.59mi | 3/2.0 | 2,040 (+9%) | 1mo | $270,000 | $132 | 56 |
| 7910 Picador Dr | 0.75mi | 4/2.0 (+1) | 1,916 (+3%) | 2mo | $240,000 | $125 | 54 |
| 15526 Barbarossa Dr | 0.32mi | 4/2.5 (+1) | 2,141 (+15%) | 3mo | $235,000 | $110 | 51 |
| 15410 Empanada Dr | 0.70mi | 4/2.0 (+1) | 2,083 (+12%) | 1mo | $200,000 | $96 | 43 |
Match score weights: distance 35% · size 25% · config 20% · recency 20%. Top-matched comps best support the ARV.
Projected returns pro-forma
-3.0% appreciation · 1.89% rent growth · sell at horizon
- IRR
- -21.7%
- Equity multiple
- 0.26×
- Total profit
- $-47,889
- Equity at exit
- $34,294
- IRR
- -18.4%
- Equity multiple
- 0.05×
- Total profit
- $-60,957
- Equity at exit
- $19,886
Cash invested: $64,400 (down + closing). Projections, not guarantees.
Landlord ↔ Tenant lean methodology
- Overall (STATE)
- 87 Strongly Landlord-Friendly
- State Texas
- 87 Strongly Landlord-Friendly · R+5
- County
- — inherits STATE
- City
- — inherits STATE
ZIP-level market 77083
- Home prices YoY
- -19.3%
- Rents YoY
- 1.9%
- Active inventory
- 263
- Price-to-rent
- 10.0×
Monthly cashflow live
- Estimated rent
- $1,913 high interval (Pro) →
- Mortgage (P&I)
- −$1,206
- Tax from tax record
- −$332 /mo · $3,982/yr
- Insurance
- −$96
- HOA
- −$12
- Vacancy / Maint / Mgmt
- −$402
- Net cashflow
- $-135
Break-even live
Sensitivity live
| Price | -10% $-4 | -5% $-69 | +0% $-135 | +5% $-200 | +10% $-265 |
|---|---|---|---|---|---|
| Rent | -10% $-286 | -5% $-210 | +0% $-135 | +5% $-59 | +10% $17 |
| Rate | -1.0pp $-19 | -0.5pp $-76 | base $-135 | +0.5pp $-194 | +1.0pp $-255 |
UW: 25.0% down · 7.5% · 30yr · 1.5% tax · 5.0% vac · 8.0% maint · 8.0% mgmt
Financing live
Cash to close
- Down payment
- $57,500
- Closing costs
- $6,900
- Reserves months
- —
- Total cash needed
- —
Loan-product check · same deal, 3 products live
Conventional
25% down · 7.5% · 30yr
- Down + closing
- —
- Monthly P&I
- —
- Monthly cashflow
- —
- DSCR
- —
- Eligible?
- —
Personal DTI + credit; lowest rate.
DSCR
20% down · 8.5% · 30yr
- Down + closing
- —
- Monthly P&I
- —
- Monthly cashflow
- —
- DSCR
- —
- Eligible?
- —
No personal income docs; deal must DSCR.
Hard money
10% down · 12.0% · 12mo
- Down + closing
- —
- Monthly P&I
- —
- Monthly cashflow
- —
- DSCR
- —
- Eligible?
- —
Short-term bridge; refi at stabilization.
Rent comps 12 comps
| Address | Beds | Baths | Sqft | Rent | $/sqft | DOM | Units | Dist |
|---|---|---|---|---|---|---|---|---|
| 15511 Evergreen Grove Dr Houston, TX | 3.0 | 2.0 | 1634 | $1,786 | $1.09 | 7d | 1 | 0.26mi |
| 15306 Evergreen Place Dr Houston, TX | 3.0 | 2.0 | 1726 | $1,730 | $1.00 | 26d | 1 | 0.39mi |
| 7610 San Benito Dr Houston, TX | 3.0 | 2.0 | 1322 | $1,786 | $1.35 | 15d | 1 | 0.50mi |
| 7214 Addicks Clodine Rd Houston, TX | 4.0 | 2.0 | 1969 | $1,900 | $0.96 | 7d | 1 | 0.90mi |
| 14507 Empanada Dr Unit 2206 Houston, TX | 3.0 | 2.0 | 1295 | $1,235 | $0.95 | 45d | 1 | 0.93mi |
| 9403 Coatsworth Dr Sugar Land, TX | 3.0 | 2.5 | 2265 | $2,050 | $0.91 | 1d | 1 | 0.93mi |
| 16131 April Ridge Dr Houston, TX | 3.0 | 2.0 | 1782 | $2,000 | $1.12 | 45d | 1 | 1.04mi |
| 14501 Empanada Dr Houston, TX | 1.0–3.0 | 1.0–2.0 | 944 | $1,549 | $1.64 | 1d | 68 | 1.06mi |
| 16243 April Ridge Dr Houston, TX | 4.0 | 2.0 | 2189 | $2,295 | $1.05 | 45d | 1 | 1.09mi |
| 7431 Navidad Rd Houston, TX | 3.0 | 2.0 | 1904 | $1,621 | $0.85 | 45d | 1 | 1.10mi |
| 6514 Winkleman Rd Houston, TX | 3.0 | 2.0 | 2225 | $2,095 | $0.94 | 15d | 1 | 1.33mi |
| 9323 Westacre Pl Houston, TX | 3.0 | 3.0 | 1659 | $1,470 | $0.89 | 45d | 1 | 1.41mi |
HOA detail
- Monthly dues
- $12 · $144/yr
Listing history 2 events
-
2026-05-08price $230,000 392-char remark
-
2026-04-29$250,000 Active 392-char remark
ⓘ Source: listings_history table (triggers on properties + properties_extension) + one-shot
backfill from property_details.listing_events for pre-trigger history.
Tax reassessment forecast TX · Resets to sale price
- Current annual tax
- $3,982 · $332/mo
- Projected year-2 tax
- $4,209 · $351/mo
- Expected delta
- +$227/yr (+$19/mo · 5.7%)
ⓘ Screening estimate from a state-policy table — verify with the county assessor before closing.
Climate risk First Street
- Flood 3/10 Moderate FEMA zone X (unshaded) · 18% chance over 30 yrs
- Wildfire 1/10 Low
- Heat 9/10 Extreme 7 d/yr ≥110°F today · 23 d/yr by 30 yrs out
- Wind 9/10 Extreme 99% chance of damaging wind over 30 yrs
- Air quality 2/10 Low 1 unhealthy d/yr today · 2 by 30 yrs out
Nearby sold comps map
Loading sold comps map…
Walkable amenities ~0.75 mi
Loading nearby amenities…
Taxation est. · year 1
- Rental income
- $22,956
- − Mortgage interest
- −$12,884
- − Property taxes
- −$3,982
- − Insurance
- −$1,150
- − Repairs & maintenance
- −$1,836
- − Management
- −$1,836
- − HOA
- −$144
- − Depreciation
- −$6,691
- Taxable loss
- −$5,568
- Est. tax savings @ 24.0%
- +$1,336
- After-tax cash flow
- $-278/yr
For passive investors: Depreciation is non-cash, so a rental often shows a tax loss while cash-flowing — sheltering income. Rental losses are passive: they offset passive income freely, and up to $25,000/yr can offset ordinary (W-2) income if you actively participate and your MAGI is under $100k (phasing out to $0 by $150k); unused losses carry forward. On sale, claimed depreciation is recaptured at up to 25%, and gains may owe capital-gains tax (a 1031 exchange can defer both). Figures are a year-1 estimate at your 24.0% rate — not tax advice; consult a CPA.
Schools (NCES district)
- District
- Fort Bend ISD
- NCES district ID
- 4819650
- Math proficiency
- 44% ▼ -15.00%
- Reading proficiency
- 53% ▼ -4.00%
- Median HH income
- $82,360
- Composite
- 44.61/100
- National rank
- #2779
- State rank
- #140 of 826 in TX
Livability — Mission Bend
- Score
- 65/100
- State rank
- #715
- US rank
- #13356
Category grades
Schools grade is shown separately in the Schools card above.
Census & demographics
- Census place
- Mission Bend, TX
- County
- Harris County · 4,702,590 people
- City population
- 74,843
- Metro
- Houston-The Woodlands-Sugar Land, TX
- Population (ZIP)
- 73,230
- Household income
- $64,418
- Rent vs Own
- Severe rent burden
- 2410.0
Population outlook (Fort Bend County) Hauer SSP2
- Today (2025)
- 1,004,526 people
- By 2030
- 1,153,104 · +14.8%
- By 2040
- 1,453,718 · +44.7%
- By 2050
- 1,753,781 · +74.6%
- By 2075
- 2,455,772 · +144.5%
- By 2100
- 2,930,528 · +191.7%
Race, ethnicity, and origin ACS 2023
- Neighborhood character
- Highly diverse neighborhood (Simpson 0.72)
- Race & ethnicity
- Hispanic / Latino 35% Black 30% Asian 23% Two or more races 14% White 8%
- Hispanic origin (detail)
- Mexican 16% Puerto Rican 1% Cuban 1%
- Foreign-born
- 47% · Canada, Vietnam, China
- Languages at home
- 38% English-only · Spanish 29% Vietnamese 11% Other Indo-European 6%
Political lean MEDSL · Fort Bend
- 2024 margin
- Toss-up / Even · D 49.5% · R 47.9% · Other 2.6%
- 2008→2024 swing
- +4.0pp toward D · 2008: -2.4pp · 2024: 1.6pp
- All cycles
- 2024: D+1.6 2020: D+10.6 2016: D+6.6 2012: R+6.8 2008: R+2.4
Not yet ingested
- Civics
- —
Market trends
- HPI YoY
- ▼ -65.00%
- Current HPI
- 271.2157
- Rent YoY
- ▲ 1.89%
- Metro
- Houston-The Woodlands-Sugar Land, TX
- State GDP YoY
- ▲ 3.95%
- F500 in state
- 110
Industry mix (Fortune 500 HQ in TX)
| Industry | F500 HQs | Revenue |
|---|---|---|
| Energy | 16 | $1,198B |
|
||
| Technology | 5 | $198B |
|
||
| Engineering / Construction | 4 | $72B |
|
||
| Energy Services | 3 | $60B |
|
||
| Utilities | 3 | $41B |
|
||
| Healthcare | 2 | $330B |
|
||
Price history
-8.0% since first listed5 events — show timeline
- 2026-05-27 Pending — HARMLS
- 2026-05-20 Pending — HARMLS
- 2026-05-20 Listing Removed — HARMLS
- 2026-05-08 Price Changed $230,000 HARMLS
- 2026-04-29 Listed $250,000 HARMLS
Property tax history
+2.9%/yrLatest (2025): $3,982 · -3.5% YoY. Source: county tax records.
Cash-flow waterfall
monthlySold comps — $/sqft
last 12 mo · ≤1 miLoading sold comps…