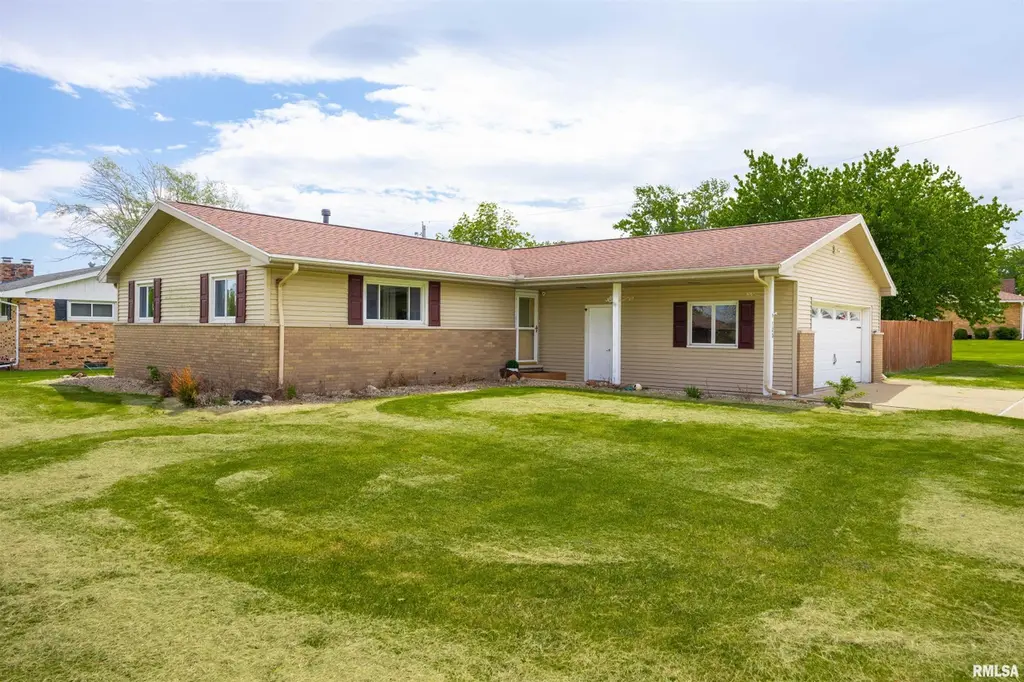
320 W Michigan Ave · Metamora, IL
Flood risk 1/10 · Minimal
- FEMA flood zone
- X (unshaded)
- Chance of flooding over 30 yrs
- 0.0%
- Est. flood insurance / yr
- $473 – $860
Fire risk 1/10 · Minimal
- Est. fire insurance / yr
- $804 – $1,492
Heat risk 3/10 · Minor
- Hot days now (above 105°F)
- 7 days/yr
- Hot days in 30 yrs
- 18 days/yr
Wind risk 2/10 · Minimal
- Chance of severe wind over 30 yrs
- 1.0%
Air-quality risk 2/10 · Minimal
- Unhealthy air days now
- 1 days/yr
- Unhealthy air days in 30 yrs
- 1 days/yr
Risk factors via First Street. Map © Google.
Why this score? — see what drove the F grade
The composite is a weighted blend of 9 inputs, each scored 0–100. Each bar is that input's sub-score; the figure is the points it added to the 100-point composite (weight × sub-score).
- Appreciation +7.6/10.0
- Cash flow +6.1/30.0
- Schools +4.1/10.0
- Livability +4.0/5.0
- Rent growth +2.5/5.0
- Condition / age +2.5/5.0
- 1% rule +2.1/10.0
- DSCR +0.4/10.0
- ARV discount +0.0/15.0
$235,000
🖨 Deal sheet (PDF) 📄 Offer letter ✓ Due diligence
Listing remarks MLS
Check out this this 3 bed, 2 bath ranch within walking distance of Metamora High School! Updates include, Anderson sliding glass doors (2019), lovely kitchen remodel (2020), privacy fence (2016), new paint/carpet, and new landscaping. The basement has a beautiful wood burning fireplace and offers endless possibilities! Catch all of the Friday night football games or entertain your guests in your very own private backyard oasis. Hurry so you can call this place HOME!
Key facts
- 0.27 acre lot
- 2 garage spots
- Built 1967
Property features AI
Exterior
- Parking: Attached 2-car garage; On-street parking; Paved driveway
- Utilities: Public water; Public sewer
- Home design: Single family residence; Shingle roof; Built in 1967
- Construction: Not new construction
- Exterior features: Level lot
Interior
- Kitchen: Dishwasher; Microwave; Refrigerator
- Bedrooms: 3 bedrooms; Primary bedroom on the main level; Second bedroom on the main level; Third bedroom in the basement (no egress window)
- Flooring: Laminate flooring in some bedrooms; Hardwood flooring in kitchen and basement bedroom; Carpet in living room
- Bathrooms: 2 full bathrooms
- Heating & cooling: Forced air heating; Central air conditioning
- Interior features: Full, partially finished basement; Wood-burning fireplace (1)
- Laundry & utility: Washer; Dryer
Neighborhood map
What this means for you Summary
Snapshot
- This is a 1-bed/2.0-bath single-family listed at $235k.
Deal economics
- At list price, monthly cash flow is $-442 ($-5k/yr) — negative.
- To cash-flow at today's rent, offer at most $157k (33.3% below list).
- To meet the 1% rule (rent ≥ 1% of price), the offer needs to be $168k (28.7% below list).
- Recommended offer: $157k (33.3% below list) — sets the bar for cash-flow.
Location & tenants
- Location reads 81/100 on livability (#98 in IL, #1,582 nationally) — a professional / high-income tenant draw. Strengths: crime A+, employment A+, cost of living A+; Watch: amenities F, commute F.
- County Of Woodford School (town): math 47% / reading 44% proficiency, ranked #75 of 620 in IL (top 12%) — families likely to look elsewhere, expect single-tenant / working-renter base with shorter leases.
- Zoned schools: Metamora High School (math 47% / reading 44%, grade D-, #58 of 693 statewide, top 8%, 915 students, 0% FRL).
- Market conditions: 98 active listings in the ZIP; 35 units permitted in Woodford County in 2024 (0 in 5+ unit buildings).
Forward outlook
- In year one you build about $14k of equity ($2k loan paydown + $12k appreciation (5.2% local appreciation)).
- Woodford County population projected to shrink 3% by 2050 — rents likely to lag national; underwrite the cash flow, not the appreciation.
- By year 3, paydown + projected appreciation supports a ~$34k cash-out refi (75% LTV) — recoverable capital for the next deal without selling this one.
Negotiation context
- Only 1 days on market — expect competitive offers; lowballing is unlikely to land.
- 3 sale attempts since 11y ago with the ask held roughly flat each time — persistent listings suggest the price (not the market) is what's stuck; bring a comps-based counter.
- Current owner paid $158k; 49% above their basis — modest negotiation headroom, anchor on the comps not their cost.
Questions for the listing agent
- What do current leases actually rent for vs. the listed asking? Can we see a recent rent roll and the last 12 months of T-12 income?
- Built in 1967 — when were the roof, HVAC, electrical panel, plumbing, and water heater last replaced?
- Is there a deadline driving the sale (1031 exchange, divorce, estate, relocation)? That informs how much negotiation room exists.
- Schools are A-rated — typically a magnet for longer-tenancy family renters. What's the average tenant stay here, and is there a school-zone premium baked into asking?
- The area grade is low — what's the realistic commute time and amenity access for the typical tenant pool here? Any planned neighborhood developments (good or bad) we should know about?
- What's the average days-on-market for RENTAL listings here right now (not sales)? A rising rental-DOM trend means longer vacancies and softer asking-rent achievability than the comps imply.
- What's the recent tenant-quality profile in this submarket — average credit score on applications, eviction rate, late-payment / NSF rate, and stable-employment percentage? A property-management company in the area should have these aggregated.
- How much new for-sale + rental construction is in the pipeline within 1–3 miles? Heavy new supply typically softens prices + rents 12–24 months out; constrained supply supports both.
Investment metrics
- 1% rule
- 0.71% ✗
- Cap rate
- 4.03%
- Cash-on-cash
- -8.07%
- DSCR
- 0.64
- GRM
- 11.7
CMA / ARV
- ARV (on-the-fly)
- $177,633
- Comps found
- 3
Show comp detail 3 sales within ~0.75 mi
| Address | Dist | Beds/Ba | Sqft | Sold | Price | $/sf | Match |
|---|---|---|---|---|---|---|---|
| 721 E Partridge St | 0.68mi | 2/1.0 (+1) | 1,291 (-6%) | 2mo | $175,000 | $136 | 48 |
| 216 W Partridge St | 0.29mi | 2/1.0 (+1) | 1,538 (+12%) | 16mo | $161,000 | $105 | 45 |
| 511 S Davenport St | 0.68mi | 2/2.0 (+1) | 1,560 (+13%) | 10mo | $200,500 | $129 | 33 |
Match score weights: distance 35% · size 25% · config 20% · recency 20%. Top-matched comps best support the ARV.
Projected returns pro-forma
5.15% appreciation · 3.0% rent growth · sell at horizon
- IRR
- 6.6%
- Equity multiple
- 1.43×
- Total profit
- $28,117
- Equity at exit
- $135,311
- IRR
- 8.7%
- Equity multiple
- 2.65×
- Total profit
- $108,688
- Equity at exit
- $235,318
Cash invested: $65,800 (down + closing). Projections, not guarantees.
Landlord ↔ Tenant lean methodology
- Overall (STATE)
- 43 Moderately Tenant-Leaning
- State Illinois
- 43 Moderately Tenant-Leaning · D+7
- County
- — inherits STATE
- City
- — inherits STATE
ZIP-level market 61548
- Home prices YoY
- 1.5%
- Active inventory
- 98
- Price-to-rent
- 11.7×
Monthly cashflow live
- Estimated rent
- $1,676 medium interval (Pro) →
- Mortgage (P&I)
- −$1,232
- Tax from tax record
- −$436 /mo · $5,232/yr
- Insurance
- −$98
- HOA
- −$0
- Vacancy / Maint / Mgmt
- −$352
- Net cashflow
- $-442
Break-even live
Sensitivity live
| Price | -10% $-309 | -5% $-376 | +0% $-442 | +5% $-509 | +10% $-575 |
|---|---|---|---|---|---|
| Rent | -10% $-575 | -5% $-509 | +0% $-442 | +5% $-376 | +10% $-310 |
| Rate | -1.0pp $-324 | -0.5pp $-383 | base $-442 | +0.5pp $-503 | +1.0pp $-565 |
UW: 25.0% down · 7.5% · 30yr · 1.5% tax · 5.0% vac · 8.0% maint · 8.0% mgmt
Financing live
Cash to close
- Down payment
- $58,750
- Closing costs
- $7,050
- Reserves months
- —
- Total cash needed
- —
Loan-product check · same deal, 3 products live
Conventional
25% down · 7.5% · 30yr
- Down + closing
- —
- Monthly P&I
- —
- Monthly cashflow
- —
- DSCR
- —
- Eligible?
- —
Personal DTI + credit; lowest rate.
DSCR
20% down · 8.5% · 30yr
- Down + closing
- —
- Monthly P&I
- —
- Monthly cashflow
- —
- DSCR
- —
- Eligible?
- —
No personal income docs; deal must DSCR.
Hard money
10% down · 12.0% · 12mo
- Down + closing
- —
- Monthly P&I
- —
- Monthly cashflow
- —
- DSCR
- —
- Eligible?
- —
Short-term bridge; refi at stabilization.
Listing history 10 events
-
2026-05-03status Pending
-
2026-05-02$235,000 Active
-
2026-04-30historical $235,000
-
2021-05-12soldstatus $158,100
-
2021-05-10soldstatus $158,000 471-char remark
Show marketing remark (471 chars)
Check out this this 3 bed, 2 bath ranch within walking distance of Metamora High School! Updates include, Anderson sliding glass doors (2019), lovely kitchen remodel (2020), privacy fence (2016), new paint/carpet, and new landscaping. The basement has a beautiful wood burning fireplace and offers endless possibilities! Catch all of the Friday night football games or entertain your guests in your very own private backyard oasis. Hurry so you can call this place HOME!
-
2021-03-08$159,900 471-char remark
Show marketing remark (471 chars)
Check out this this 3 bed, 2 bath ranch within walking distance of Metamora High School! Updates include, Anderson sliding glass doors (2019), lovely kitchen remodel (2020), privacy fence (2016), new paint/carpet, and new landscaping. The basement has a beautiful wood burning fireplace and offers endless possibilities! Catch all of the Friday night football games or entertain your guests in your very own private backyard oasis. Hurry so you can call this place HOME!
-
2016-06-01soldstatus $160,000
-
2016-05-27soldstatus $160,000 590-char remark
Show marketing remark (590 chars)
Absolutely move-in-ready ranch. All kitchen and laundry appliances are included PLUS remodeled bath with Corian tops and step in shower plus a tub, roof (complete tear-off) new in 2014, hardwood in the kitchen and dining, extra master bedroom closets, a finished basement with wood burning fireplace and bar with own refrigerator, basement bedroom #3 with a full bath, powered patio awning and privacy fence, egress door to the basement, a basement workshop, and a great location close to schools. Many updates since 2001. Appliances not warranted. Sizes deemed reliable but not guaranteed.
-
2015-09-30$169,500 590-char remark
Show marketing remark (590 chars)
Absolutely move-in-ready ranch. All kitchen and laundry appliances are included PLUS remodeled bath with Corian tops and step in shower plus a tub, roof (complete tear-off) new in 2014, hardwood in the kitchen and dining, extra master bedroom closets, a finished basement with wood burning fireplace and bar with own refrigerator, basement bedroom #3 with a full bath, powered patio awning and privacy fence, egress door to the basement, a basement workshop, and a great location close to schools. Many updates since 2001. Appliances not warranted. Sizes deemed reliable but not guaranteed.
-
2002-08-30soldstatus $132,000
ⓘ Source: listings_history table (triggers on properties + properties_extension) + one-shot
backfill from property_details.listing_events for pre-trigger history.
Tax reassessment forecast IL · Partial reset (capped growth)
- Current annual tax
- $5,232 · $436/mo
- Projected year-2 tax
- $5,283 · $440/mo
- Expected delta
- +$51/yr (+$4/mo · 1.0%)
ⓘ Screening estimate from a state-policy table — verify with the county assessor before closing.
Climate risk First Street
- Flood 1/10 Low FEMA zone X (unshaded) · 0% chance over 30 yrs
- Wildfire 1/10 Low
- Heat 3/10 Moderate 7 d/yr ≥105°F today · 18 d/yr by 30 yrs out
- Wind 2/10 Low 100% chance of damaging wind over 30 yrs
- Air quality 2/10 Low 1 unhealthy d/yr today · 1 by 30 yrs out
Nearby sold comps map
Loading sold comps map…
Walkable amenities ~0.75 mi
Loading nearby amenities…
Taxation est. · year 1
- Rental income
- $20,111
- − Mortgage interest
- −$13,164
- − Property taxes
- −$5,232
- − Insurance
- −$1,175
- − Repairs & maintenance
- −$1,609
- − Management
- −$1,609
- − Depreciation
- −$6,836
- Taxable loss
- −$9,514
- Est. tax savings @ 24.0%
- +$2,283
- After-tax cash flow
- $-3,025/yr
For passive investors: Depreciation is non-cash, so a rental often shows a tax loss while cash-flowing — sheltering income. Rental losses are passive: they offset passive income freely, and up to $25,000/yr can offset ordinary (W-2) income if you actively participate and your MAGI is under $100k (phasing out to $0 by $150k); unused losses carry forward. On sale, claimed depreciation is recaptured at up to 25%, and gains may owe capital-gains tax (a 1031 exchange can defer both). Figures are a year-1 estimate at your 24.0% rate — not tax advice; consult a CPA.
Schools (NCES district)
- District
- County Of Woodford School
- NCES district ID
- 1725770
- Math proficiency
- 47% ▼ -5.00%
- Reading proficiency
- 44% ▼ -6.00%
- Median HH income
- $72,248
- Composite
- 41.2/100
- National rank
- #3540
- State rank
- #75 of 620 in IL
Livability — Metamora
- Score
- 81/100
- State rank
- #98
- US rank
- #1582
Category grades
Schools grade is shown separately in the Schools card above.
Census & demographics
- Census place
- Metamora, IL
- Population (ZIP)
- 12,165
Population outlook (Woodford County) Hauer SSP2
- Today (2025)
- 39,897 people
- By 2030
- 40,038 · +0.4%
- By 2040
- 39,745 · -0.4%
- By 2050
- 38,585 · -3.3%
- By 2075
- 34,769 · -12.9%
- By 2100
- 27,616 · -30.8%
Race, ethnicity, and origin ACS 2023
- Neighborhood character
- Predominantly White (96%)
- Race & ethnicity
- White 96% Two or more races 3% Hispanic / Latino 2%
- Common ancestry
- Romanian 4% Slovak 3% Portuguese 2%
- Foreign-born
- 2% · Canada, South Korea
- Languages at home
- 98% English-only · Spanish 1%
Political lean MEDSL · Woodford
- 2024 margin
- Solid R (+42.0) · D 28.2% · R 70.3% · Other 1.5%
- 2008→2024 swing
- -15.4pp toward R · 2008: -26.6pp · 2024: -42.0pp
- All cycles
- 2024: R+42.0 2020: R+40.2 2016: R+41.8 2012: R+39.2 2008: R+26.6
Not yet ingested
- Civics
- —
Market trends
- HPI YoY
- ▲ 5.15%
- Current HPI
- 345.14
- Rent YoY
- —
- Metro
- —
- State GDP YoY
- ▲ 1.59%
- F500 in state
- 60
Industry mix (Fortune 500 HQ in IL)
| Industry | F500 HQs | Revenue |
|---|---|---|
| Insurance | 4 | $201B |
|
||
| Consumer Goods | 4 | $87B |
|
||
| Industrial Machinery | 3 | $64B |
|
||
| Healthcare | 2 | $55B |
|
||
| Retail / Pharmacy | 1 | $148B |
|
||
| Agriculture / Food | 1 | $86B |
|
||
Price history
+78.0% since first listed10 events — show timeline
- 2026-05-03 Pending — RMLSA as Distributed by MLS Grid
- 2026-05-02 Listed $235,000 RMLSA as Distributed by MLS Grid
- 2026-04-30 Coming Soon $235,000 RMLSA as Distributed by MLS Grid
- 2021-05-12 Sold (Public Records) $158,100 Public Records
- 2021-05-10 Sold (MLS) $158,000 RMLSA as Distributed by MLS Grid
- 2021-03-08 Listed $159,900 RMLSA as Distributed by MLS Grid
- 2016-06-01 Sold (Public Records) $160,000 Public Records
- 2016-05-27 Sold (MLS) $160,000 RMLSA as Distributed by MLS Grid
- 2015-09-30 Listed $169,500 RMLSA as Distributed by MLS Grid
- 2002-08-30 Sold (Public Records) $132,000 Public Records
Property tax history
+4.9%/yrLatest (2024): $5,232 · +10.0% YoY. Source: county tax records.
Cash-flow waterfall
monthlySold comps — $/sqft
last 12 mo · ≤1 miLoading sold comps…