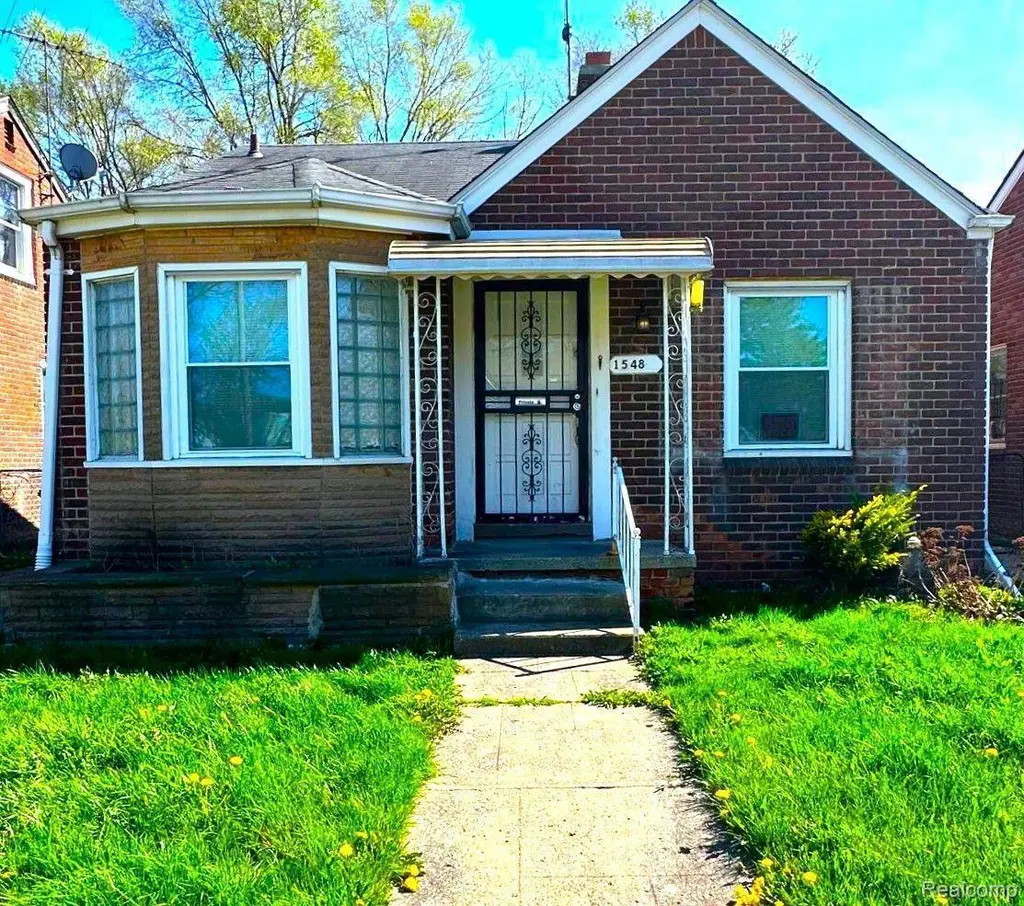
15480 Saratoga St · Detroit, MI
Flood risk 4/10 · Minor
- FEMA flood zone
- X (unshaded)
- Chance of flooding over 30 yrs
- 0.21%
- Est. flood insurance / yr
- $473 – $860
Fire risk 1/10 · Minimal
- Est. fire insurance / yr
- $784 – $1,456
Heat risk 3/10 · Minor
- Hot days now (above 95°F)
- 7 days/yr
- Hot days in 30 yrs
- 15 days/yr
Wind risk 2/10 · Minimal
- Chance of severe wind over 30 yrs
- —
Air-quality risk 3/10 · Minor
- Unhealthy air days now
- 2 days/yr
- Unhealthy air days in 30 yrs
- 5 days/yr
Risk factors via First Street. Map © Google.
Why this score? — see what drove the C+ grade
The composite is a weighted blend of 9 inputs, each scored 0–100. Each bar is that input's sub-score; the figure is the points it added to the 100-point composite (weight × sub-score).
- Cash flow +30.0/30.0
- 1% rule +10.0/10.0
- DSCR +10.0/10.0
- Livability +3.7/5.0
- Rent growth +2.8/5.0
- Condition / age +2.5/5.0
- Schools +1.3/10.0
- ARV discount +0.0/15.0
- Appreciation +0.0/10.0
$75,000
🖨 Deal sheet 📄 Offer letter ✓ Due diligence
Listing remarks MLS
Terrific Value on This Affordable Brick Ranch! Don't miss this 2-bedroom all-brick ranch featuring a full basement, located on a beautifully maintained street in Detroit's desirable Mapleridge neighborhood. The home offers a spacious living room, two comfortable bedrooms, a full bath, and an eat-in kitchen with plenty of cabinetry, granite countertops, and a cozy breakfast nook. Enjoy low-maintenance living with newer vinyl windows and lower utility costs year-round. Located in Northeast Detroit, this area is popular with homeowners due to its proximity to neighboring suburbs, dining, shopping, and schools - including historic Denby High School. Call or text today for more information or to schedule your private showing!
Key facts
- Newer vinyl windows
- Proximity to dining
- Full basement
Tags
Neighborhood map
What this means for you Summary
Snapshot
- This is a 2-bed/1.0-bath single-family listed at $75k.
Deal economics
- At list price, monthly cash flow is $377 ($5k/yr) — positive.
- The deal already cash-flows at list — no discount required.
- Meets the 1% rule at list price ($1k rent vs $75k).
- Recommended offer: $73k (3.0% below list) — sets the bar for market timing.
- Cap rate 12.3% vs local median 10.2% in Detroit — meaningfully above typical; check what's discounted (condition, days-on-market, listing class) to confirm the premium yield is real.
Location & tenants
- Location reads 73/100 on livability (#218 in MI) — a middle-class / working-renter tenant base. Strengths: amenities A+, commute A+, cost of living A+; Watch: schools F, crime F, employment F.
- Detroit Public Schools Community District (urban): math 10% / reading 24% proficiency, ranked #499 of 540 in MI (top 92%) — low school quality limits family demand, transient renter base, plan for 1-2y turnover; 90% free/reduced lunch — lower-income household profile, screen leases tightly.
- Market conditions: Rents rising (+1.3%/yr); 373 active listings in the ZIP; 38 comparable units currently listed for rent nearby; rentals at typical pace (median 18d on market — plan ~3-4 weeks tenant-placement turnaround); lower-income renter base — watch delinquency; 2,639 units permitted in Wayne County in 2024 (1,216 in 5+ unit buildings).
- This rent runs 36% of the median local income ($39k/yr) — at the standard rent-burdened threshold; future hikes will face affordability resistance.
Forward outlook
- Local home prices are declining (-3.0%/yr); year-one equity from $519 of loan paydown is wiped out by about $2k of value loss. Plan a longer hold.
- Wayne County population projected at -17% by 2050 — secular population decline; favor cash flow + early exit over multi-decade hold.
- At projected returns (-3.0% appreciation + 1.3% rent growth), your $21k cash investment doubles in ~7 years — after that, you're playing with house money.
Negotiation context
- It's been on market 57 days — a 3% lower offer ($73k) is reasonable based on typical stale-listing flexibility.
- 10 sale attempts since 5y ago; this cycle's ask has dropped $9k (11%) from the opening price — seller is motivated, your offer sets the floor, not the list.
Risks & watch-outs
- Watch-outs: built in 1940 — expect roof / HVAC / electrical / plumbing capex.
Questions for the listing agent
- It's been on market 57 days. Have you received any prior offers? Is the seller open to a 3% concession, seller financing, or rate buy-down credit?
- Built in 1940 — when were the roof, HVAC, electrical panel, plumbing, and water heater last replaced?
- Is there a deadline driving the sale (1031 exchange, divorce, estate, relocation)? That informs how much negotiation room exists.
- Schools are F-rated, which usually means shorter tenancies and higher turnover. Who's the typical renter profile here, and what's been the actual vacancy rate?
- Crime grade is F in this area — have there been break-ins, vandalism, or insurance claims at this property in the last 3 years? What carrier currently insures it and at what premium?
- What's the average days-on-market for RENTAL listings here right now (not sales)? A rising rental-DOM trend means longer vacancies and softer asking-rent achievability than the comps imply.
- What's the recent tenant-quality profile in this submarket — average credit score on applications, eviction rate, late-payment / NSF rate, and stable-employment percentage? A property-management company in the area should have these aggregated.
- How much new for-sale + rental construction is in the pipeline within 1–3 miles? Heavy new supply typically softens prices + rents 12–24 months out; constrained supply supports both.
Investment metrics
- 1% rule
- 1.58% ✓
- Cap rate
- 12.33%
- Cash-on-cash
- 21.56%
- DSCR
- 1.96
- GRM
- 5.3
CMA / ARV
- ARV (median comp)
- $55,922
- List price
- $75,000
- Delta
- 34.12%
- Verdict
- OVERPRICED
- Comps
- 20 within 1.0 mi
Show comp detail 12 sales within ~0.75 mi
| Address | Dist | Beds/Ba | Sqft | Sold | Price | $/sf | Match |
|---|---|---|---|---|---|---|---|
| 15294 Saratoga St | 0.11mi | 3/1.0 (+1) | 802 (+7%) | 7mo | $65,000 | $81 | 73 |
| 12505 Laing St | 0.56mi | 3/1.0 (+1) | 752 (0%) | 3mo | $54,600 | $73 | 66 |
| 11974 Duchess St | 0.65mi | 2/1.0 | 724 (-4%) | 5mo | $37,000 | $51 | 59 |
| 18700 Mccormick St | 0.57mi | 2/1.0 | 706 (-6%) | 5mo | $63,000 | $89 | 59 |
| 18591 Kingsville St | 0.60mi | 2/1.0 | 824 (+10%) | 1mo | $74,000 | $90 | 55 |
| 12897 Riad St | 0.49mi | 3/1.0 (+1) | 831 (+10%) | 1mo | $63,000 | $76 | 53 |
| 18547 Mccormick St | 0.54mi | 3/1.0 (+1) | 689 (-8%) | 7mo | $30,000 | $44 | 50 |
| 16100 Liberal St | 0.61mi | 2/1.0 | 679 (-10%) | 7mo | $15,900 | $23 | 49 |
| 12641 Kelly Rd | 0.65mi | 2/1.0 | 840 (+12%) | 4mo | $15,000 | $18 | 46 |
| 18801 Washtenaw St | 0.73mi | 2/1.0 | 836 (+11%) | 7mo | $32,555 | $39 | 42 |
| 18933 Kingsville St | 0.73mi | 2/1.0 | 672 (-11%) | 8mo | $72,000 | $107 | 42 |
| 19401 Kelly Rd | 0.67mi | 3/1.0 (+1) | 850 (+13%) | 7mo | $38,000 | $45 | 36 |
Match score weights: distance 35% · size 25% · config 20% · recency 20%. Top-matched comps best support the ARV.
Projected returns pro-forma
-3.0% appreciation · 1.33% rent growth · sell at horizon
- IRR
- 12.2%
- Equity multiple
- 1.47×
- Total profit
- $9,963
- Equity at exit
- $11,183
- IRR
- 19.7%
- Equity multiple
- 2.53×
- Total profit
- $32,029
- Equity at exit
- $6,485
Cash invested: $21,000 (down + closing). Projections, not guarantees.
Landlord ↔ Tenant lean methodology
- Overall (STATE)
- 62 Landlord-Friendly
- State Michigan
- 62 Landlord-Friendly · EVEN
- County
- — inherits STATE
- City
- — inherits STATE
ZIP-level market 48205
- Home prices YoY
- -28.1%
- Rents YoY
- 1.3%
- Active inventory
- 373
- Price-to-rent
- 5.3×
Monthly cashflow live
- Estimated rent
- $1,183 high interval (Pro) →
- Mortgage (P&I)
- −$393
- Tax from tax record
- −$133 /mo · $1,591/yr
- Insurance
- −$31
- HOA
- −$0
- Vacancy / Maint / Mgmt
- −$248
- Net cashflow
- $377
Break-even live
UW: 25.0% down · 7.5% · 30yr · 1.5% tax · 5.0% vac · 8.0% maint · 8.0% mgmt
Financing live
Cash to close
- Down payment
- $18,750
- Closing costs
- $2,250
- Reserves months
- —
- Total cash needed
- —
Loan-product check · same deal, 3 products live
Conventional
25% down · 7.5% · 30yr
- Down + closing
- —
- Monthly P&I
- —
- Monthly cashflow
- —
- DSCR
- —
- Eligible?
- —
Personal DTI + credit; lowest rate.
DSCR
20% down · 8.5% · 30yr
- Down + closing
- —
- Monthly P&I
- —
- Monthly cashflow
- —
- DSCR
- —
- Eligible?
- —
No personal income docs; deal must DSCR.
Hard money
10% down · 12.0% · 12mo
- Down + closing
- —
- Monthly P&I
- —
- Monthly cashflow
- —
- DSCR
- —
- Eligible?
- —
Short-term bridge; refi at stabilization.
Rent comps 38 comps
| Address | Beds | Baths | Sqft | Rent | $/sqft | DOM | Units | Dist |
|---|---|---|---|---|---|---|---|---|
| 15494 Mapleridge St Detroit, MI | 3.0 | 1.0 | 937 | $1,275 | $1.36 | 43d | 1 | 0.28mi |
| 15909 Maddelein St Detroit, MI | 3.0 | 1.0 | 894 | $1,266 | $1.42 | 43d | 1 | 0.36mi |
| 12716 Riad St Detroit, MI | 3.0 | 1.0 | 974 | $1,275 | $1.31 | 17d | 1 | 0.45mi |
| 16212 Maddelein St Detroit, MI | 2.0 | 1.0 | 800 | $1,200 | $1.50 | 12d | 1 | 0.47mi |
| 16241 Seven Mile E Unit 4 Detroit, MI | 1.0 | 1.0 | 650 | $650 | $1.00 | 43d | 1 | 0.48mi |
| 12201 Morang Ave Unit 8 Detroit, MI | 2.0 | 1.0 | 610 | $875 | $1.43 | 43d | 1 | 0.55mi |
| 15010 Cedargrove St Detroit, MI | 3.0 | 1.5 | 1018 | $1,350 | $1.33 | 43d | 1 | 0.62mi |
| 14461 Lappin St Detroit, MI | 3.0 | 1.5 | 989 | $1,150 | $1.16 | 17d | 1 | 0.73mi |
| 19144 Moross Rd Detroit, MI | 2.0 | 1.0 | 900 | $1,050 | $1.17 | 43d | 1 | 0.76mi |
| 15030 Rossini Dr Unit 2 Detroit, MI | 1.0 | 1.0 | 720 | $800 | $1.11 | 43d | 1 | 0.77mi |
| 12075 Rossiter St Detroit, MI | 3.0 | 1.0 | 1100 | $1,245 | $1.13 | 14d | 1 | 0.79mi |
| 12075 Rossiter St Detroit, MI | 3.0 | 1.0 | 1100 | $1,245 | $1.13 | 43d | 1 | 0.79mi |
| 11776 Rossiter St Detroit, MI | 3.0 | 1.0 | 964 | $1,150 | $1.19 | 11d | 1 | 0.80mi |
| 11611 Morang Ave Detroit, MI | 1.0–2.0 | 1.0 | 709 | $1,040 | $1.47 | 43d | 1 | 0.83mi |
| 11529 Roxbury St Detroit, MI | 2.0 | 1.0 | 720 | $1,200 | $1.67 | 12d | 1 | 0.90mi |
| 11235 Roxbury St Detroit, MI | 3.0 | 1.0 | 1062 | $1,325 | $1.25 | 17d | 1 | 0.96mi |
| 19152 Woodside St Harper Woods, MI | 3.0 | 1.0 | 916 | $1,500 | $1.64 | 17d | 1 | 0.98mi |
| 16291 Eastburn St Detroit, MI | 3.0 | 1.0 | 1000 | $1,364 | $1.36 | 24d | 1 | 1.01mi |
| 19442 Kingsville St Harper Woods, MI | 3.0 | 1.0 | 1000 | $1,500 | $1.50 | 17d | 1 | 1.01mi |
| 19639 Moross Rd Unit 1 Detroit, MI | 2.0 | 1.0 | 900 | $1,100 | $1.22 | 43d | 1 | 1.07mi |
| 16410 Edmore Dr Detroit, MI | 3.0 | 1.0 | 850 | $1,250 | $1.47 | 14d | 1 | 1.11mi |
| 15663 Carlisle St Detroit, MI | 2.0 | 1.0 | 803 | $1,050 | $1.31 | 14d | 1 | 1.13mi |
| 14103 Rochelle Ave Unit 3 Detroit, MI | 1.0 | 1.0 | 700 | $800 | $1.14 | 43d | 1 | 1.17mi |
| 19661 Kenosha St Harper Woods, MI | 3.0 | 2.0 | 1000 | $1,400 | $1.40 | 24d | 1 | 1.17mi |
| 13669 Pfent St Detroit, MI | 3.0 | 2.0 | 1031 | $1,374 | $1.33 | 17d | 1 | 1.21mi |
| 10644 Stratman St Detroit, MI | 2.0 | 1.0 | 1000 | $1,200 | $1.20 | 17d | 1 | 1.24mi |
| 10692 Meuse St Detroit, MI | 3.0 | 1.0 | 955 | $1,250 | $1.31 | 12d | 1 | 1.28mi |
| 10404 Somerset Ave Detroit, MI | 3.0 | 1.0 | 1108 | $1,475 | $1.33 | 3d | 1 | 1.28mi |
| 19982 McCormick St Detroit, MI | 3.0 | 1.0 | 866 | $1,200 | $1.39 | 3d | 1 | 1.29mi |
| 10400 Britain St Detroit, MI | 3.0 | 1.0 | 890 | $1,100 | $1.24 | 43d | 1 | 1.30mi |
| 10985 Peerless St Detroit, MI | 3.0 | 1.0 | 1000 | $1,364 | $1.36 | 4d | 1 | 1.33mi |
| 10370 Britain St Detroit, MI | 3.0 | 1.0 | 1100 | $1,100 | $1.00 | 43d | 1 | 1.33mi |
| 13503 E McNichols Rd Unit 7 Detroit, MI | 1.0 | 1.0 | 750 | $800 | $1.07 | 17d | 1 | 1.33mi |
| 10177 Boleyn St Detroit, MI | 3.0 | 1.0 | 767 | $1,250 | $1.63 | 43d | 1 | 1.35mi |
| 14068 Carlisle St Detroit, MI | 3.0 | 1.0 | 1020 | $1,300 | $1.27 | 24d | 1 | 1.40mi |
| 10037 Grayton St Detroit, MI | 3.0 | 1.0 | 1000 | $1,400 | $1.40 | 3d | 1 | 1.41mi |
| 19220 Alcoy St Detroit, MI | 3.0 | 1.0 | 1023 | $1,350 | $1.32 | 17d | 1 | 1.43mi |
| 10141 Roxbury St Detroit, MI | 3.0 | 1.0 | 1115 | $1,000 | $0.90 | 43d | 1 | 1.44mi |
Listing history 42 events
-
2026-06-18days on market $75,000 Active 57 DOM
-
2026-06-17days on market $75,000 Active 56 DOM
-
2026-06-15days on market $75,000 Active 54 DOM
-
2026-06-13days on market $75,000 Active 52 DOM
-
2026-06-13days on market $75,000 Active 51 DOM
-
2026-06-09days on market $75,000 Active 48 DOM
-
2026-06-08days on market $75,000 Active 47 DOM
-
2026-06-07pricedays on market $75,000 Active 46 DOM
-
2026-06-04days on market $84,000 Active 43 DOM
-
2026-06-03days on market $84,000 Active 42 DOM
-
2026-06-02days on market $84,000 Active 41 DOM
-
2026-06-01days on market $84,000 Active 40 DOM
-
2026-05-31days on market $84,000 Active 39 DOM
-
2026-04-22$84,000 Active 730-char remark
Show marketing remark (746 chars)
Terrific Value on This Affordable Brick Ranch! Don’t miss this 2-bedroom all-brick ranch featuring a full basement, located on a beautifully maintained street in Detroit’s desirable Mapleridge neighborhood. The home offers a spacious living room, two comfortable bedrooms, a full bath, and an eat-in kitchen with plenty of cabinetry, granite countertops, and a cozy breakfast nook. Enjoy low-maintenance living with newer vinyl windows and lower utility costs year-round. Located in Northeast Detroit, this area is popular with homeowners due to its proximity to neighboring suburbs, dining, shopping, and schools—including historic Denby High School. Call or text today for more information or to schedule your private showing!
-
2026-04-22$84,000 Active 746-char remark
Show marketing remark (746 chars)
Terrific Value on This Affordable Brick Ranch! Don’t miss this 2-bedroom all-brick ranch featuring a full basement, located on a beautifully maintained street in Detroit’s desirable Mapleridge neighborhood. The home offers a spacious living room, two comfortable bedrooms, a full bath, and an eat-in kitchen with plenty of cabinetry, granite countertops, and a cozy breakfast nook. Enjoy low-maintenance living with newer vinyl windows and lower utility costs year-round. Located in Northeast Detroit, this area is popular with homeowners due to its proximity to neighboring suburbs, dining, shopping, and schools—including historic Denby High School. Call or text today for more information or to schedule your private showing!
-
2025-12-23historical
-
2025-12-23historical
-
2025-05-19$84,000 Active
-
2025-05-19$84,000 Active
-
2025-05-07historical
-
2025-05-07historical
-
2024-12-06$84,000 Active
-
2024-12-06$84,000 Active
-
2024-12-05historical
-
2024-12-05historical
-
2024-12-05historical
-
2024-12-05historical
-
2024-10-09price $85,000
-
2024-10-08price $85,000
-
2024-10-08price $87,000
-
2024-08-22price $95,000
-
2024-08-21price $95,000
-
2024-06-12$105,000 Active
-
2024-06-12$105,000 Active
-
2021-12-08historical
-
2021-12-07historical
-
2021-10-15status Pending
-
2021-10-12historical
-
2021-06-21soldstatus $66,900
-
2021-05-26historical
-
2021-04-23$60,000
-
2021-04-23$60,000
ⓘ Source: listings_history table (triggers on properties + properties_extension) + one-shot
backfill from property_details.listing_events for pre-trigger history.
Tax reassessment forecast MI · Partial reset (capped growth)
- Current annual tax
- $1,591 · $133/mo
- Projected year-2 tax
- $1,591 · $133/mo
- Expected delta
- $0/yr ($0/mo · 0.0%)
ⓘ Screening estimate from a state-policy table — verify with the county assessor before closing.
Climate risk First Street
- Flood 4/10 Moderate FEMA zone X (unshaded) · 21% chance over 30 yrs
- Wildfire 1/10 Low
- Heat 3/10 Moderate 7 d/yr ≥95°F today · 15 d/yr by 30 yrs out
- Wind 2/10 Low
- Air quality 3/10 Moderate 2 unhealthy d/yr today · 5 by 30 yrs out
Nearby sold comps map
Loading sold comps map…
Walkable amenities ~0.75 mi
Loading nearby amenities…
Taxation est. · year 1
- Rental income
- $14,194
- − Mortgage interest
- −$4,201
- − Property taxes
- −$1,591
- − Insurance
- −$375
- − Repairs & maintenance
- −$1,136
- − Management
- −$1,136
- − Depreciation
- −$2,182
- Taxable income
- $3,574
- Est. tax owed @ 24.0%
- −$858
- After-tax cash flow
- $3,670/yr
For passive investors: Depreciation is non-cash, so a rental often shows a tax loss while cash-flowing — sheltering income. Rental losses are passive: they offset passive income freely, and up to $25,000/yr can offset ordinary (W-2) income if you actively participate and your MAGI is under $100k (phasing out to $0 by $150k); unused losses carry forward. On sale, claimed depreciation is recaptured at up to 25%, and gains may owe capital-gains tax (a 1031 exchange can defer both). Figures are a year-1 estimate at your 24.0% rate — not tax advice; consult a CPA.
Schools (NCES district)
- District
- Detroit Public Schools Community District
- NCES district ID
- 2601103
- Math proficiency
- 10% ▼ -2.00%
- Reading proficiency
- 24% ▲ 6.00%
- Median HH income
- $25,815
- Composite
- 13.06/100
- National rank
- #9564
- State rank
- #499 of 540 in MI
Livability — Detroit
- Score
- 73/100
- State rank
- #218
- US rank
- #5427
Category grades
Schools grade is shown separately in the Schools card above.
Census & demographics
- Census place
- Detroit, MI
- County
- Wayne County · 1,562,939 people
- City population
- 572,865
- Metro
- Detroit-Warren-Dearborn, MI
- Population (ZIP)
- 34,187
- Household income
- $38,966
- Rent vs Own
- Severe rent burden
- 2121.0
Population outlook (Wayne County) Hauer SSP2
- Today (2025)
- 1,675,273 people
- By 2030
- 1,620,300 · -3.3%
- By 2040
- 1,502,341 · -10.3%
- By 2050
- 1,384,039 · -17.4%
- By 2075
- 1,124,592 · -32.9%
- By 2100
- 881,193 · -47.4%
Race, ethnicity, and origin ACS 2023
- Neighborhood character
- Predominantly Black (93%)
- Race & ethnicity
- Black 93% White 3% Two or more races 2%
- Foreign-born
- 1% · Canada
- Languages at home
- 98% English-only · Spanish 1%
Political lean MEDSL · Wayne
- 2024 margin
- Strong D (+29.0) · D 62.7% · R 33.7% · Other 3.6%
- 2008→2024 swing
- -20.5pp toward R · 2008: 49.5pp · 2024: 29.0pp
- All cycles
- 2024: D+29.0 2020: D+38.1 2016: D+37.3 2012: D+46.9 2008: D+49.5
Not yet ingested
- Civics
- —
Market trends
- HPI YoY
- ▼ -91.80%
- Current HPI
- 235.0926
- Rent YoY
- ▲ 1.33%
- Metro
- Detroit-Warren-Dearborn, MI
- State GDP YoY
- ▲ 1.37%
- F500 in state
- 28
Industry mix (Fortune 500 HQ in MI)
| Industry | F500 HQs | Revenue |
|---|---|---|
| Automotive Parts | 3 | $48B |
|
||
| Automotive | 2 | $372B |
|
||
| Chemicals | 1 | $45B |
|
||
| Automotive Retail | 1 | $29B |
|
||
| Healthcare / Medical Devices | 1 | $23B |
|
||
| Automotive Technology | 1 | $20B |
|
||
Price history
+40.0% since first listed29 events — show timeline
- 2026-04-22 Listed $84,000 REALCOMP
- 2026-04-22 Listed $84,000 MiRealSource-MiMLS
- 2025-12-23 Listing Removed — MiRealSource-MiMLS
- 2025-12-23 Listing Removed — REALCOMP
- 2025-05-19 Listed $84,000 REALCOMP
- 2025-05-19 Listed $84,000 MiRealSource-MiMLS
- 2025-05-07 Listing Removed — REALCOMP
- 2025-05-07 Listing Removed — MiRealSource-MiMLS
- 2024-12-06 Listed $84,000 MiRealSource-MiMLS
- 2024-12-06 Listed $84,000 REALCOMP
- 2024-12-05 Coming Soon — MiRealSource-MiMLS
- 2024-12-05 Coming Soon — REALCOMP
- 2024-12-05 Listing Removed — MiRealSource-MiMLS
- 2024-12-05 Listing Removed — REALCOMP
- 2024-10-09 Price Changed $85,000 MiRealSource-MiMLS
- 2024-10-08 Price Changed $85,000 REALCOMP
- 2024-10-08 Price Changed $87,000 REALCOMP
- 2024-08-22 Price Changed $95,000 MiRealSource-MiMLS
- 2024-08-21 Price Changed $95,000 REALCOMP
- 2024-06-12 Listed $105,000 MiRealSource-MiMLS
- 2024-06-12 Listed $105,000 REALCOMP
- 2021-12-08 Listing Removed — MiRealSource-MiMLS
- 2021-12-07 Listing Removed — REALCOMP
- 2021-10-15 Pending — REALCOMP
- 2021-10-12 Listing Removed — REALCOMP
- 2021-06-21 Sold (Public Records) $66,900 Public Records
- 2021-05-26 Listing Removed — REALCOMP
- 2021-04-23 Listed $60,000 MiRealSource-MiMLS
- 2021-04-23 Listed $60,000 REALCOMP
Property tax history
+3.0%/yrLatest (2025): $1,591 · -54.1% YoY. Source: county tax records.
Cash-flow waterfall
monthlySold comps — $/sqft
last 12 mo · ≤1 miLoading sold comps…