65 Private Dr 143-9 · Greenville, MO
Flood risk 1/10 · Minimal
- FEMA flood zone
- X (unshaded)
- Chance of flooding over 30 yrs
- 0.0%
- Est. flood insurance / yr
- $507 – $1,088
Fire risk 5/10 · Moderate
- Est. fire insurance / yr
- $1,054 – $1,958
Heat risk 6/10 · Moderate
- Hot days now (above 107°F)
- 7 days/yr
- Hot days in 30 yrs
- 21 days/yr
Wind risk 2/10 · Minimal
- Chance of severe wind over 30 yrs
- 4.0%
Air-quality risk 1/10 · Minimal
- Unhealthy air days now
- 0 days/yr
- Unhealthy air days in 30 yrs
- 0 days/yr
Risk factors via First Street. Map © Google.
Why this score? — see what drove the B- grade
The composite is a weighted blend of 9 inputs, each scored 0–100. Each bar is that input's sub-score; the figure is the points it added to the 100-point composite (weight × sub-score).
- Cash flow +26.7/30.0
- DSCR +9.1/10.0
- ARV discount +7.5/15.0
- 1% rule +7.2/10.0
- Appreciation +5.0/10.0
- Livability +3.2/5.0
- Schools +2.7/10.0
- Rent growth +2.5/5.0
- Condition / age +2.2/5.0
$85,000
🖨 Deal sheet (PDF) 📄 Offer letter ✓ Due diligence
Listing remarks
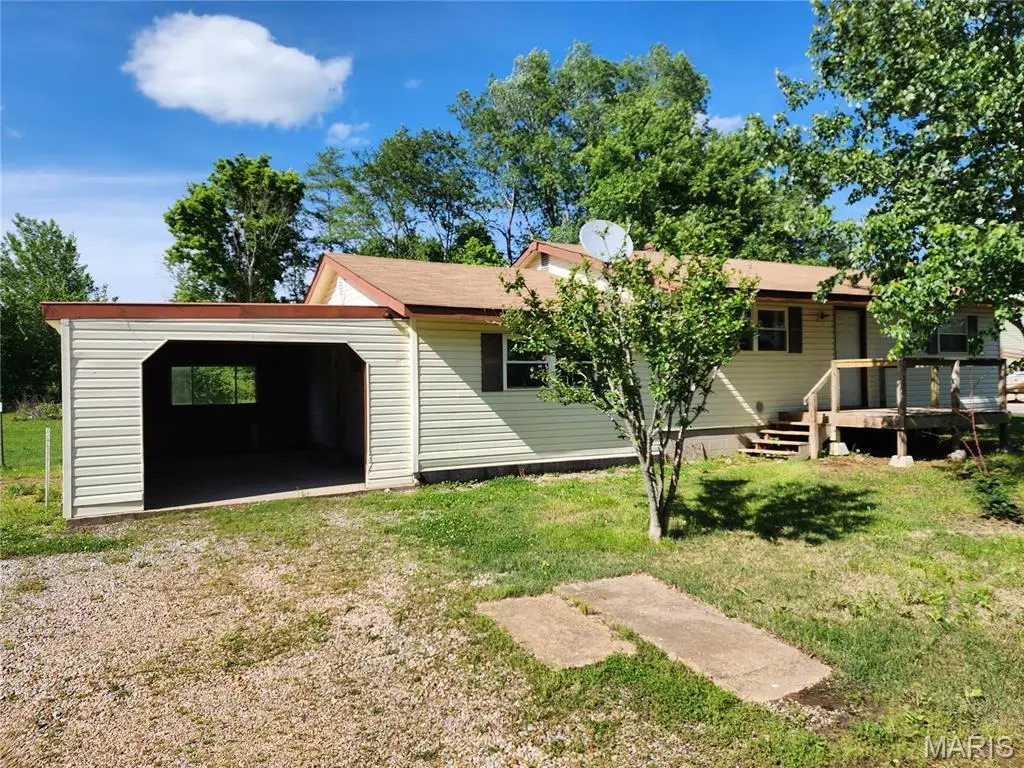
This 1274 square ft. home offers two bedrooms (could be 3), one bath, large kitchen/dining combo, laundry room, living room and large family room. The living room and one bedroom have beautiful, pine, tongue & groove car siding on the walls. The home has updated, insulated windows and a complete new 3 ton HVAC system was installed in 2023. This home is located just off Hwy 143 just down the road from Sam A Baker State Park, the St Francis river and close to Clearwater lake, Wappapello lake and 1000's of acres of the Mark Twain national forest. The large, level fenced in back yard provides ample space for a pet and/or entertaining. Schedule your appointment today to view this property
Key facts
- 0.3 acre lot
- Garage
- Built 1977
Property features AI
Exterior
- Parking: Attached garage with space for 1 car (approx. 14 x 26)
- Utilities: Private well water; Septic tank sewer; 220V electric service; Electricity connected
- Home design: Single-family residence; One story; Residential property
- Construction: Vinyl siding; Shingle roof; Block foundation; Built/verified by assessor
- Exterior features: Front porch; Private backyard; Back yard fencing; Level lot
Interior
- Kitchen: Dishwasher; Electric oven; Electric range
- Bedrooms: Three bedrooms (all on the main level)
- Bathrooms: One full bathroom (on the main level)
- Heating & cooling: Electric forced-air heating; Central air conditioning (electric)
- Interior features: Kitchen and dining room combined
- Laundry & utility: Dedicated laundry room
Neighborhood map
What this means for you Summary
Snapshot
- This is a 3-bed/1.0-bath single-family listed at $85k. Condition is rated fair.
Deal economics
- At list price, monthly cash flow is $229 ($3k/yr) — positive.
- The deal already cash-flows at list — no discount required.
- Meets the 1% rule at list price ($1k rent vs $85k).
- Recommended offer: $82k (3.0% below list) — sets the bar for market timing.
Location & tenants
- Location reads 63/100 on livability (#363 in MO) — a middle-class / working-renter tenant base. Strengths: cost of living A+, housing A+; Watch: health & safety C-, employment D, crime F.
- Clearwater R-I (rural): math 33% / reading 33% proficiency, ranked #255 of 324 in MO (top 79%) — families likely to look elsewhere, expect single-tenant / working-renter base with shorter leases; 62% free/reduced lunch — lower-income household profile, screen leases tightly.
- Zoned schools: Clearwater Elementary (math 42% / reading 32%, grade F, #611 of 1,115 statewide, top 59%, 414 students, 72% FRL); Clearwater High (math 34% / reading 57%, grade D-, #174 of 521 statewide, top 33%, 239 students, 55% FRL) — zoned schools at 64% FRL track the district average.
- Market conditions: 7 active listings in the ZIP.
Forward outlook
- In year one you build about $3k of equity ($588 loan paydown + $3k appreciation (3.0% local appreciation)).
- Wayne County population projected to shrink 9% by 2050 — rents likely to lag national; underwrite the cash flow, not the appreciation.
- At projected returns (3.0% appreciation + 3.0% rent growth), your $24k cash investment doubles in ~4 years — after that, you're playing with house money.
- By year 10, paydown + projected appreciation supports a ~$30k cash-out refi (75% LTV) — recoverable capital for the next deal without selling this one.
Negotiation context
- It's been on market 42 days — a 3% lower offer ($82k) is reasonable based on typical stale-listing flexibility.
- 2 sale attempts since 5y ago with the ask held roughly flat each time — persistent listings suggest the price (not the market) is what's stuck; bring a comps-based counter.
Risks & watch-outs
- Climate carrying-cost: moderate wildfire risk; extreme-heat days projected 7→21/yr by 2055 (HVAC capex compounding) — expect insurance premiums to compound above CPI over the hold.
Questions for the listing agent
- It's been on market 42 days. Have you received any prior offers? Is the seller open to a 3% concession, seller financing, or rate buy-down credit?
- Have any recent inspections been done? Can we get a copy of the seller's disclosures and any deferred-maintenance estimates?
- Built in 1977 — when were the roof, HVAC, electrical panel, plumbing, and water heater last replaced?
- Is there a deadline driving the sale (1031 exchange, divorce, estate, relocation)? That informs how much negotiation room exists.
- Schools are D-rated, which usually means shorter tenancies and higher turnover. Who's the typical renter profile here, and what's been the actual vacancy rate?
- Crime grade is F in this area — have there been break-ins, vandalism, or insurance claims at this property in the last 3 years? What carrier currently insures it and at what premium?
- What's the average days-on-market for RENTAL listings here right now (not sales)? A rising rental-DOM trend means longer vacancies and softer asking-rent achievability than the comps imply.
- What's the recent tenant-quality profile in this submarket — average credit score on applications, eviction rate, late-payment / NSF rate, and stable-employment percentage? A property-management company in the area should have these aggregated.
- How much new for-sale + rental construction is in the pipeline within 1–3 miles? Heavy new supply typically softens prices + rents 12–24 months out; constrained supply supports both.
Investment metrics
- 1% rule
- 1.22% ✓
- Cap rate
- 9.53%
- Cash-on-cash
- 11.55%
- DSCR
- 1.51
- GRM
- 6.9
CMA / ARV
- ARV (median comp)
- $180,950
- List price
- $85,000
- Delta
- -53.03%
- Verdict
- UNDERPRICED
- Comps
- 2 within 1.0 mi
Projected returns pro-forma
3.0% appreciation · 3.0% rent growth · sell at horizon
- IRR
- 18.3%
- Equity multiple
- 2.04×
- Total profit
- $24,839
- Equity at exit
- $38,220
- IRR
- 19.7%
- Equity multiple
- 3.86×
- Total profit
- $68,021
- Equity at exit
- $58,901
Cash invested: $23,800 (down + closing). Projections, not guarantees.
Landlord ↔ Tenant lean methodology
- Overall (STATE)
- 81 Strongly Landlord-Friendly
- State Missouri
- 81 Strongly Landlord-Friendly · R+10
- County
- — inherits STATE
- City
- — inherits STATE
ZIP-level market 63956
- Active inventory
- 7
- Price-to-rent
- 6.9×
Monthly cashflow live
- Estimated rent
- $1,033 medium interval (Pro) →
- Mortgage (P&I)
- −$446
- Tax est. 1.5%
- −$106 /mo · $1,275/yr
- Insurance
- −$35
- HOA
- −$0
- Vacancy / Maint / Mgmt
- −$217
- Net cashflow
- $229
Break-even live
Sensitivity live
| Price | -10% $288 | -5% $258 | +0% $229 | +5% $200 | +10% $170 |
|---|---|---|---|---|---|
| Rent | -10% $147 | -5% $188 | +0% $229 | +5% $270 | +10% $311 |
| Rate | -1.0pp $272 | -0.5pp $251 | base $229 | +0.5pp $207 | +1.0pp $185 |
UW: 25.0% down · 7.5% · 30yr · 1.5% tax · 5.0% vac · 8.0% maint · 8.0% mgmt
Financing live
Cash to close
- Down payment
- $21,250
- Closing costs
- $2,550
- Reserves months
- —
- Total cash needed
- —
Loan-product check · same deal, 3 products live
Conventional
25% down · 7.5% · 30yr
- Down + closing
- —
- Monthly P&I
- —
- Monthly cashflow
- —
- DSCR
- —
- Eligible?
- —
Personal DTI + credit; lowest rate.
DSCR
20% down · 8.5% · 30yr
- Down + closing
- —
- Monthly P&I
- —
- Monthly cashflow
- —
- DSCR
- —
- Eligible?
- —
No personal income docs; deal must DSCR.
Hard money
10% down · 12.0% · 12mo
- Down + closing
- —
- Monthly P&I
- —
- Monthly cashflow
- —
- DSCR
- —
- Eligible?
- —
Short-term bridge; refi at stabilization.
Listing history 15 events
-
2026-06-16status $85,000 Pending 42 DOM
-
2026-06-15days on market $85,000 Active 42 DOM
-
2026-06-13days on market $85,000 Active 40 DOM
-
2026-06-12days on market $85,000 Active 39 DOM
-
2026-06-09days on market $85,000 Active 36 DOM
-
2026-06-08days on market $85,000 Active 35 DOM
-
2026-06-07days on market $85,000 Active 34 DOM
-
2026-06-07days on market $85,000 Active 33 DOM
-
2026-06-04days on market $85,000 Active 30 DOM
-
2026-06-02days on market $85,000 Active 29 DOM
-
2026-06-01days on market $85,000 Active 28 DOM
-
2026-05-31days on market $85,000 Active 27 DOM
-
2026-05-04$85,000 Active 723-char remark
-
2021-05-28soldstatus Closed
-
2021-04-28$69,900 Active
ⓘ Source: listings_history table (triggers on properties + properties_extension) + one-shot
backfill from property_details.listing_events for pre-trigger history.
Climate risk First Street
- Flood 1/10 Low FEMA zone X (unshaded) · 0% chance over 30 yrs
- Wildfire 5/10 Major
- Heat 6/10 Major 7 d/yr ≥107°F today · 21 d/yr by 30 yrs out
- Wind 2/10 Low 4% chance of damaging wind over 30 yrs
- Air quality 1/10 Low 0 unhealthy d/yr today · 0 by 30 yrs out
Nearby sold comps map
Loading sold comps map…
Walkable amenities ~0.75 mi
Loading nearby amenities…
Taxation est. · year 1
- Rental income
- $12,401
- − Mortgage interest
- −$4,761
- − Property taxes
- −$1,275
- − Insurance
- −$425
- − Repairs & maintenance
- −$992
- − Management
- −$992
- − Depreciation
- −$2,473
- Taxable income
- $1,483
- Est. tax owed @ 24.0%
- −$356
- After-tax cash flow
- $2,392/yr
For passive investors: Depreciation is non-cash, so a rental often shows a tax loss while cash-flowing — sheltering income. Rental losses are passive: they offset passive income freely, and up to $25,000/yr can offset ordinary (W-2) income if you actively participate and your MAGI is under $100k (phasing out to $0 by $150k); unused losses carry forward. On sale, claimed depreciation is recaptured at up to 25%, and gains may owe capital-gains tax (a 1031 exchange can defer both). Figures are a year-1 estimate at your 24.0% rate — not tax advice; consult a CPA.
Condition & rehab AI · 12 photos
This 1274 square ft. home requires moderate renovations to improve its condition and increase its value. The kitchen and bathroom need updates, and the exterior may benefit from painting. The HVAC system is new, but the home's overall condition is fair.
Repairs flagged
- Minor kitchen cabinets — existing cabinets need updating
- Minor bathroom fixtures — existing fixtures need updating
- Moderate exterior siding — existing siding may need repainting or replacement
- Moderate interior walls — existing paint may need touch-up or repainting
Value-add opportunities
- Both kitchen renovation — modernizing the kitchen can increase both resale and rental value
- Both bathroom renovation — updating the bathroom can increase both resale and rental value
- Both exterior painting — painting the exterior can improve curb appeal and increase both resale and rental value
Renovation cost estimate screening
| Repair item | Severity | Est. cost |
|---|---|---|
| kitchen cabinets · existing cabinets need updating | Minor | $500–3,000 |
| bathroom fixtures · existing fixtures need updating | Minor | $500–3,000 |
| exterior siding · existing siding may need repainting or replacement | Moderate | $3,000–15,000 |
| interior walls · existing paint may need touch-up or repainting | Moderate | $3,000–15,000 |
| Total estimated repair cost · 4 items | $7,000–36,000 |
Value-add ROI direction
- Both kitchen renovation — modernizing the kitchen can increase both resale and rental value ↑
- Both bathroom renovation — updating the bathroom can increase both resale and rental value ↑
- Both exterior painting — painting the exterior can improve curb appeal and increase both resale and rental value ↑
ⓘ Cost ranges are severity-bucket heuristics (US national rule-of-thumb). Get contractor quotes + a written scope before underwriting a rehab budget.
Schools (NCES district)
- District
- Clearwater R-I
- NCES district ID
- 2909750
- Math proficiency
- 33% ▲ 1.00%
- Reading proficiency
- 33% ▼ -6.00%
- Median HH income
- $31,119
- Composite
- 26.89/100
- National rank
- #7095
- State rank
- #255 of 324 in MO
Livability — Greenville
- Score
- 63/100
- State rank
- #363
- US rank
- #15966
Category grades
Schools grade is shown separately in the Schools card above.
Census & demographics
- Population (ZIP)
- 625
Population outlook (Wayne County) Hauer SSP2
- Today (2025)
- 13,005 people
- By 2030
- 12,767 · -1.8%
- By 2040
- 12,319 · -5.3%
- By 2050
- 11,828 · -9.1%
- By 2075
- 10,806 · -16.9%
- By 2100
- 9,610 · -26.1%
Race, ethnicity, and origin ACS 2023
- Neighborhood character
- Predominantly White (94%)
- Race & ethnicity
- White 94% Hispanic / Latino 3% Black 1%
- Common ancestry
- Lithuanian 7% Italian 4%
Political lean MEDSL · Wayne
- 2024 margin
- Solid R (+72.6) · D 13.4% · R 86.0%
- 2008→2024 swing
- -47.6pp toward R · 2008: -25.0pp · 2024: -72.6pp
- All cycles
- 2024: R+72.6 2020: R+70.5 2016: R+64.4 2012: R+34.6 2008: R+25.0
Not yet ingested
- Civics
- —
Market trends
- HPI YoY
- —
- Current HPI
- —
- Rent YoY
- —
- Metro
- —
- State GDP YoY
- ▲ 1.84%
- F500 in state
- 20
Industry mix (Fortune 500 HQ in MO)
| Industry | F500 HQs | Revenue |
|---|---|---|
| Healthcare | 1 | $163B |
|
||
| Insurance | 1 | $21B |
|
||
| Industrial Technology | 1 | $17B |
|
||
| Retail | 1 | $16B |
|
||
| Industrial Distribution | 1 | $10B |
|
||
| Utilities | 1 | $9B |
|
||
Price history
+21.6% since first listed4 events — show timeline
- 2026-06-15 Pending — MARIS as Distributed by MLS Grid
- 2026-05-04 Listed $85,000 MARIS as Distributed by MLS Grid
- 2021-05-28 Sold (MLS) — MARIS as Distributed by MLS Grid
- 2021-04-28 Listed $69,900 MARIS as Distributed by MLS Grid
Cash-flow waterfall
monthlySold comps — $/sqft
last 12 mo · ≤1 miLoading sold comps…