 🏷️ Likely Rental
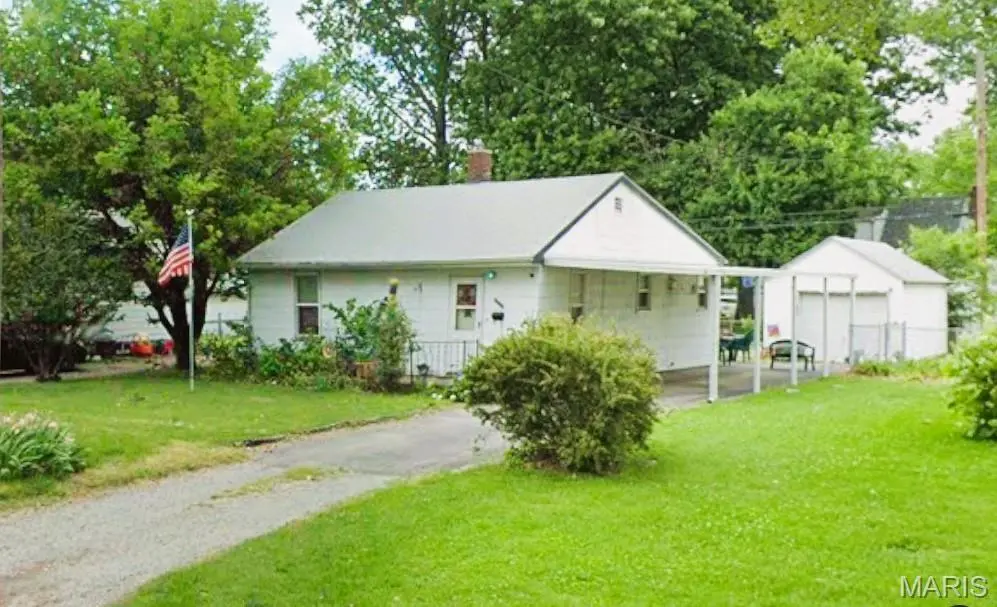
1713 Moro Ave · Granite City, IL
Flood risk 1/10 · Minimal
- FEMA flood zone
- X
- Chance of flooding over 30 yrs
- 0.0%
- Est. flood insurance / yr
- $507 – $1,088
Fire risk 1/10 · Minimal
- Est. fire insurance / yr
- $804 – $1,492
Heat risk 5/10 · Moderate
- Hot days now (above 108°F)
- 7 days/yr
- Hot days in 30 yrs
- 21 days/yr
Wind risk 2/10 · Minimal
- Chance of severe wind over 30 yrs
- 1.0%
Air-quality risk 4/10 · Minor
- Unhealthy air days now
- 4 days/yr
- Unhealthy air days in 30 yrs
- 5 days/yr
Risk factors via First Street. Map © Google.
Why this score? — see what drove the B- grade
The composite is a weighted blend of 9 inputs, each scored 0–100. Each bar is that input's sub-score; the figure is the points it added to the 100-point composite (weight × sub-score).
- Cash flow +30.0/30.0
- 1% rule +10.0/10.0
- DSCR +10.0/10.0
- ARV discount +7.5/15.0
- Livability +3.2/5.0
- Rent growth +2.9/5.0
- Condition / age +2.5/5.0
- Schools +0.9/10.0
- Appreciation +0.0/10.0
$30,000
🖨 Deal sheet 📄 Offer letter ✓ Due diligence
Listing remarks
HOME IS SOLD "AS IS" Home is vacant. Long term tenant. No warranty. CASH ONLY> NO INSPECTIONS>
Key facts
- 5,501 sq ft lot
- Garage
- Built 1930
Property features AI
Finance
- Other: Living area approximately 858 (estimated); Lot size about 0.1263 acres
- Financial info: Lease not considered
- HOA & community: No association (N/A)
Exterior
- Parking: Driveway; 1-car garage
- Utilities: Public water; Public sewer; Electric: Other
- Home design: Single-family residence; One level
- Construction: Construction materials: Unknown; Basement present
- Exterior features: Storm door(s); No other exterior features listed; City lot
Interior
- Kitchen: No appliances listed
- Bedrooms: 3 bedrooms (all on the main level)
- Flooring: Other flooring
- Bathrooms: 1 full bathroom
- Heating & cooling: Other heating; Other cooling
- Interior features: Basement; Other interior features
- Laundry & utility: No laundry appliances listed
Neighborhood map
What this means for you Summary
Snapshot
- This is a 3-bed/1.0-bath single-family listed at $30k.
Deal economics
- At list price, monthly cash flow is $732 ($9k/yr) — positive.
- The deal already cash-flows at list — no discount required.
- Meets the 1% rule at list price ($1k rent vs $30k).
- Cap rate 35.6% vs local median 7.0% in Granite City — top-decile yield for the area; either an underpriced asset or a hidden risk that comps aren't pricing in. Stress-test before assuming the spread holds.
Location & tenants
- Location reads 65/100 on livability (#623 in IL) — a middle-class / working-renter tenant base. Strengths: cost of living A+, housing A+; Watch: crime F, amenities F, commute F.
- Granite City CUSD 9 (suburban): math 9% / reading 11% proficiency, ranked #570 of 620 in IL (top 92%) — low school quality limits family demand, transient renter base, plan for 1-2y turnover.
- Zoned schools: Granite City High School (math 10% / reading 12%, grade F, #522 of 693 statewide, top 76%, 1,805 students, 0% FRL) — zoned schools average 0% FRL vs 59% district-wide (59 pts lower); this property's tenant base skews higher-income than the district average.
- Market conditions: Rents rising (+1.7%/yr); 194 active listings in the ZIP; 3 comparable units currently listed for rent nearby; rentals leasing fast (median 8d on market — plan ~1-2 weeks tenant-placement turnaround); 336 units permitted in Madison County in 2024 (0 in 5+ unit buildings).
Forward outlook
- Local home prices are declining (-3.0%/yr); year-one equity from $207 of loan paydown is wiped out by about $900 of value loss. Plan a longer hold.
- Madison County population projected at -18% by 2050 — secular population decline; favor cash flow + early exit over multi-decade hold.
- At projected returns (-3.0% appreciation + 1.7% rent growth), your $8k cash investment doubles in ~2 years — after that, you're playing with house money.
Negotiation context
- Only 4 days on market — expect competitive offers; lowballing is unlikely to land.
Risks & watch-outs
- Watch-outs: built in 1930 — expect roof / HVAC / electrical / plumbing capex.
- Climate carrying-cost: extreme-heat days projected 7→21/yr by 2055 (HVAC capex compounding) — expect insurance premiums to compound above CPI over the hold.
Questions for the listing agent
- Built in 1930 — when were the roof, HVAC, electrical panel, plumbing, and water heater last replaced?
- Is there a deadline driving the sale (1031 exchange, divorce, estate, relocation)? That informs how much negotiation room exists.
- Schools are F-rated, which usually means shorter tenancies and higher turnover. Who's the typical renter profile here, and what's been the actual vacancy rate?
- Crime grade is F in this area — have there been break-ins, vandalism, or insurance claims at this property in the last 3 years? What carrier currently insures it and at what premium?
- What's the average days-on-market for RENTAL listings here right now (not sales)? A rising rental-DOM trend means longer vacancies and softer asking-rent achievability than the comps imply.
- What's the recent tenant-quality profile in this submarket — average credit score on applications, eviction rate, late-payment / NSF rate, and stable-employment percentage? A property-management company in the area should have these aggregated.
- How much new for-sale + rental construction is in the pipeline within 1–3 miles? Heavy new supply typically softens prices + rents 12–24 months out; constrained supply supports both.
Investment metrics
- 1% rule
- 3.96% ✓
- Cap rate
- 35.57%
- Cash-on-cash
- 104.56%
- DSCR
- 5.65
- GRM
- 2.1
CMA / ARV
- ARV (on-the-fly)
- $100,386
- Comps found
- 12
Show comp detail 12 sales within ~0.75 mi
| Address | Dist | Beds/Ba | Sqft | Sold | Price | $/sf | Match |
|---|---|---|---|---|---|---|---|
| 1713 Moro Ave | 0.00mi | 3/1.0 | 858 (0%) | 0mo | $30,000 | $35 | 100 |
| 1629 Moro Ave | 0.09mi | 2/1.0 (-1) | 792 (-8%) | 5mo | $119,000 | $150 | 74 |
| 1620 Ferguson Ave | 0.27mi | 2/1.0 (-1) | 786 (-8%) | 5mo | $69,900 | $89 | 64 |
| 1635 Lindell Blvd | 0.37mi | 2/1.0 (-1) | 896 (+4%) | 8mo | $110,000 | $123 | 63 |
| 2012 Clark Ave | 0.57mi | 3/1.0 | 903 (+5%) | 4mo | $139,900 | $155 | 61 |
| 2152 Bern Ave | 0.55mi | 3/1.0 | 888 (+4%) | 10mo | $119,900 | $135 | 61 |
| 2145 Miracle Ave | 0.49mi | 3/2.0 | 900 (+5%) | 10mo | $105,000 | $117 | 57 |
| 2117 Lynch Ave | 0.38mi | 2/1.0 (-1) | 748 (-13%) | 2mo | $49,500 | $66 | 54 |
| 1633 Sycamore St | 0.41mi | 3/1.0 | 978 (+14%) | 8mo | $110,000 | $112 | 51 |
| 2132 Orville Ave | 0.45mi | 3/1.0 | 980 (+14%) | 6mo | $125,000 | $128 | 51 |
| 4109 Melrose Ave | 0.44mi | 2/1.0 (-1) | 744 (-13%) | 2mo | $59,900 | $81 | 50 |
| 33 Briarcliff Dr | 0.69mi | 4/3.0 (+1) | 930 (+8%) | 10mo | $70,000 | $75 | 33 |
Match score weights: distance 35% · size 25% · config 20% · recency 20%. Top-matched comps best support the ARV.
Projected returns pro-forma
-3.0% appreciation · 1.67% rent growth · sell at horizon
- IRR
- —
- Equity multiple
- 5.79×
- Total profit
- $40,202
- Equity at exit
- $4,473
- IRR
- —
- Equity multiple
- 11.58×
- Total profit
- $88,833
- Equity at exit
- $2,594
Cash invested: $8,400 (down + closing). Projections, not guarantees.
Landlord ↔ Tenant lean methodology
- Overall (STATE)
- 43 Moderately Tenant-Leaning
- State Illinois
- 43 Moderately Tenant-Leaning · D+7
- County
- — inherits STATE
- City
- — inherits STATE
ZIP-level market 62040
- Home prices YoY
- -21.8%
- Rents YoY
- 1.7%
- Active inventory
- 194
- Price-to-rent
- 2.1×
Monthly cashflow live
- Estimated rent
- $1,189 medium interval (Pro) →
- Mortgage (P&I)
- −$157
- Tax est. 1.5%
- −$38 /mo · $450/yr
- Insurance
- −$12
- HOA
- −$0
- Vacancy / Maint / Mgmt
- −$250
- Net cashflow
- $732
Break-even live
UW: 25.0% down · 7.5% · 30yr · 1.5% tax · 5.0% vac · 8.0% maint · 8.0% mgmt
Financing live
Cash to close
- Down payment
- $7,500
- Closing costs
- $900
- Reserves months
- —
- Total cash needed
- —
Loan-product check · same deal, 3 products live
Conventional
25% down · 7.5% · 30yr
- Down + closing
- —
- Monthly P&I
- —
- Monthly cashflow
- —
- DSCR
- —
- Eligible?
- —
Personal DTI + credit; lowest rate.
DSCR
20% down · 8.5% · 30yr
- Down + closing
- —
- Monthly P&I
- —
- Monthly cashflow
- —
- DSCR
- —
- Eligible?
- —
No personal income docs; deal must DSCR.
Hard money
10% down · 12.0% · 12mo
- Down + closing
- —
- Monthly P&I
- —
- Monthly cashflow
- —
- DSCR
- —
- Eligible?
- —
Short-term bridge; refi at stabilization.
Rent comps 3 comps
| Address | Beds | Baths | Sqft | Rent | $/sqft | DOM | Units | Dist |
|---|---|---|---|---|---|---|---|---|
| 4404 Wabash Ave Granite City, IL | 2.0 | 1.0 | 864 | $1,025 | $1.19 | 3d | 1 | 0.37mi |
| 303 Wilson Park Ln Granite City, IL | 3.0 | 1.0 | 900 | $1,200 | $1.33 | 7d | 1 | 0.99mi |
| 2715 Center St Unit B Granite City, IL | 2.0 | 1.0 | 930 | $1,275 | $1.37 | 43d | 1 | 1.49mi |
Listing history 2 events
-
2026-05-24$30,000 Active
-
2005-03-07soldstatus $35,000
ⓘ Source: listings_history table (triggers on properties + properties_extension) + one-shot
backfill from property_details.listing_events for pre-trigger history.
Climate risk First Street
- Flood 1/10 Low FEMA zone X · 0% chance over 30 yrs
- Wildfire 1/10 Low
- Heat 5/10 Major 7 d/yr ≥108°F today · 21 d/yr by 30 yrs out
- Wind 2/10 Low 100% chance of damaging wind over 30 yrs
- Air quality 4/10 Moderate 4 unhealthy d/yr today · 5 by 30 yrs out
Nearby sold comps map
Loading sold comps map…
Walkable amenities ~0.75 mi
Loading nearby amenities…
Taxation est. · year 1
- Rental income
- $14,267
- − Mortgage interest
- −$1,680
- − Property taxes
- −$450
- − Insurance
- −$150
- − Repairs & maintenance
- −$1,141
- − Management
- −$1,141
- − Depreciation
- −$873
- Taxable income
- $8,831
- Est. tax owed @ 24.0%
- −$2,119
- After-tax cash flow
- $6,664/yr
For passive investors: Depreciation is non-cash, so a rental often shows a tax loss while cash-flowing — sheltering income. Rental losses are passive: they offset passive income freely, and up to $25,000/yr can offset ordinary (W-2) income if you actively participate and your MAGI is under $100k (phasing out to $0 by $150k); unused losses carry forward. On sale, claimed depreciation is recaptured at up to 25%, and gains may owe capital-gains tax (a 1031 exchange can defer both). Figures are a year-1 estimate at your 24.0% rate — not tax advice; consult a CPA.
Schools (NCES district)
- District
- Granite City CUSD 9
- NCES district ID
- 1717280
- Math proficiency
- 9% ▼ -4.00%
- Reading proficiency
- 11% ▼ -7.00%
- Median HH income
- $45,082
- Composite
- 9.15/100
- National rank
- #9864
- State rank
- #570 of 620 in IL
Livability — Granite City
- Score
- 65/100
- State rank
- #623
- US rank
- #12751
Category grades
Schools grade is shown separately in the Schools card above.
Census & demographics
- Census place
- Granite City, IL
- County
- Madison County · 189,064 people
- City population
- 40,404
- Metro
- St. Louis, MO-IL
- Population (ZIP)
- 40,404
- Household income
- $60,031
- Rent vs Own
- Severe rent burden
- 923.0
Population outlook (Madison County) Hauer SSP2
- Today (2025)
- 258,371 people
- By 2030
- 251,523 · -2.7%
- By 2040
- 233,640 · -9.6%
- By 2050
- 213,042 · -17.5%
- By 2075
- 165,255 · -36.0%
- By 2100
- 123,953 · -52.0%
Race, ethnicity, and origin ACS 2023
- Neighborhood character
- Predominantly White (76%)
- Race & ethnicity
- White 76% Hispanic / Latino 9% Black 9% Two or more races 7% Asian 1%
- Hispanic origin (detail)
- Mexican 7%
- Common ancestry
- Romanian 2% Lithuanian 2% Serbian 2%
- Foreign-born
- 3% · Canada, Vietnam
- Languages at home
- 93% English-only · Spanish 5%
Political lean MEDSL · Madison
- 2024 margin
- R (+13.3) · D 42.5% · R 55.8% · Other 1.8%
- 2008→2024 swing
- -22.5pp toward R · 2008: 9.2pp · 2024: -13.3pp
- All cycles
- 2024: R+13.3 2020: R+13.2 2016: R+15.6 2012: R+1.4 2008: D+9.2
Not yet ingested
- Civics
- —
Market trends
- HPI YoY
- ▼ -56.88%
- Current HPI
- 204.4612
- Rent YoY
- ▲ 1.67%
- Metro
- St. Louis, MO-IL
- State GDP YoY
- ▲ 1.59%
- F500 in state
- 60
Industry mix (Fortune 500 HQ in IL)
| Industry | F500 HQs | Revenue |
|---|---|---|
| Insurance | 4 | $201B |
|
||
| Consumer Goods | 4 | $87B |
|
||
| Industrial Machinery | 3 | $64B |
|
||
| Healthcare | 2 | $55B |
|
||
| Retail / Pharmacy | 1 | $148B |
|
||
| Agriculture / Food | 1 | $86B |
|
||
Price history
-14.3% since first listed2 events — show timeline
- 2026-05-24 Listed $30,000 MARIS as Distributed by MLS Grid
- 2005-03-07 Sold (Public Records) $35,000 Public Records
Property tax history
+0.2%/yrLatest (2024): $1,768 · +1.5% YoY. Source: county tax records.
Cash-flow waterfall
monthlySold comps — $/sqft
last 12 mo · ≤1 miLoading sold comps…