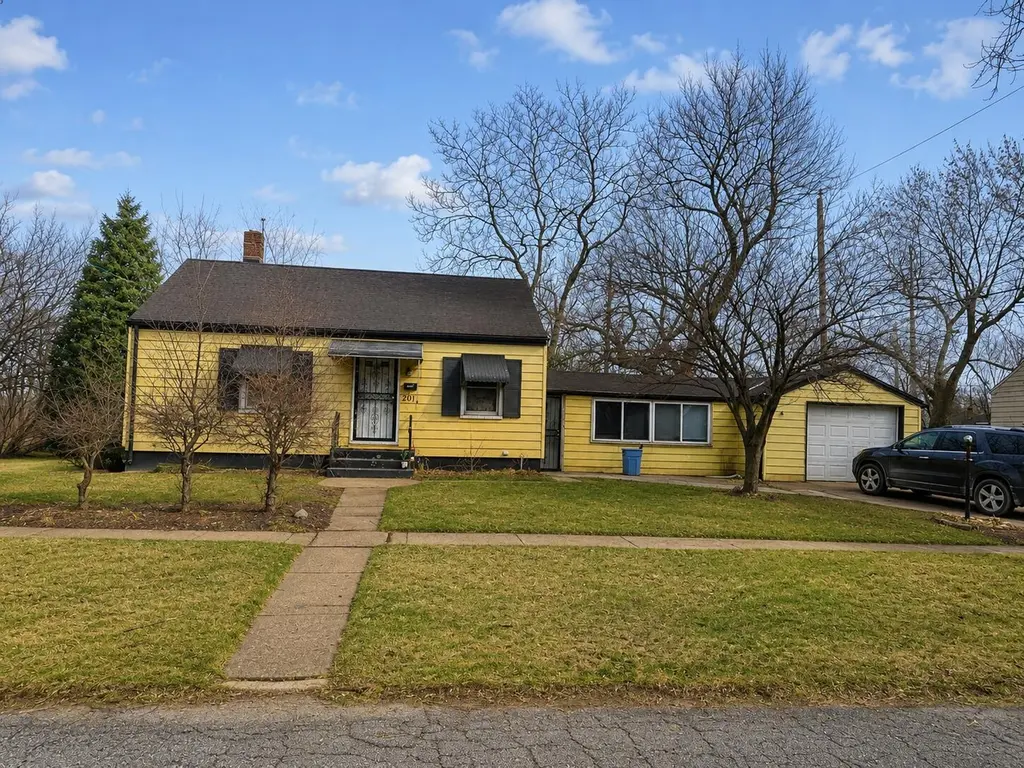
201 Johnson St · Gary, IN
Flood risk 1/10 · Minimal
- FEMA flood zone
- X (unshaded)
- Chance of flooding over 30 yrs
- 0.0%
- Est. flood insurance / yr
- $473 – $860
Fire risk 1/10 · Minimal
- Est. fire insurance / yr
- $717 – $1,331
Heat risk 2/10 · Minimal
- Hot days now (above 102°F)
- 7 days/yr
- Hot days in 30 yrs
- 15 days/yr
Wind risk 2/10 · Minimal
- Chance of severe wind over 30 yrs
- —
Air-quality risk 4/10 · Minor
- Unhealthy air days now
- 5 days/yr
- Unhealthy air days in 30 yrs
- 6 days/yr
Risk factors via First Street. Map © Google.
Why this score? — see what drove the C+ grade
The composite is a weighted blend of 9 inputs, each scored 0–100. Each bar is that input's sub-score; the figure is the points it added to the 100-point composite (weight × sub-score).
- Cash flow +24.9/30.0
- ARV discount +12.9/15.0
- DSCR +8.1/10.0
- 1% rule +6.2/10.0
- Livability +3.7/5.0
- Rent growth +2.5/5.0
- Condition / age +2.5/5.0
- Appreciation +1.4/10.0
- Schools +0.5/10.0
$110,000
🖨 Deal sheet 📄 Offer letter ✓ Due diligence
Listing remarks
Charming 2-bedroom ranch on a corner lot with a finished basement and 2-car garage! This home offers 1,888 sq. ft. of living space in a location that can't be beat. You'll be minutes from Indiana Dunes National Park, Hard Rock Casino, and the U. S. Steel Yard baseball stadium. From the historic Aquatorium at Marquette Park to the local favorite 18th Street Brewery, there is always something to do nearby. A solid home in a vibrant, landmark-filled neighborhood--ready for its new owner!
Key facts
- Finished basement
- Corner lot
- 5,009 sq ft lot
Tags
Property features AI
Finance
- Other: Vacant occupant status
Exterior
- Parking: Attached parking; On-street parking; 1-car garage
- Security: Smoke detector(s); Carbon monoxide detector(s)
- Utilities: Public water; Public sewer; Electric service (other)
- Home design: One-story home; Built in 1942
- Construction: Aluminum siding; Asphalt roof; Has basement (unfinished)
- Exterior features: Neighborhood view; Smoke and carbon monoxide detectors
Interior
- Kitchen: Kitchen
- Bedrooms: Primary bedroom; Second bedroom
- Flooring: Carpet; Tile; Laminate
- Bathrooms: 1 full bathroom
- Heating & cooling: Forced air heating; Central air conditioning
- Interior features: Other interior features; Unfinished basement
- Laundry & utility: No appliances listed; Basement access for utilities
Neighborhood map
What this means for you Summary
Snapshot
- This is a 2-bed/1.0-bath single-family listed at $110k.
Deal economics
- At list price, monthly cash flow is $238 ($3k/yr) — positive.
- The deal already cash-flows at list — no discount required.
- Meets the 1% rule at list price ($1k rent vs $110k).
- Recommended offer: $107k (3.0% below list) — sets the bar for market timing.
Location & tenants
- Location reads 73/100 on livability (#105 in IN) — a middle-class / working-renter tenant base. Strengths: commute A+, cost of living A+, housing A+; Watch: crime F, employment F.
- Gary Community School Corporation (urban): math 3% / reading 11% proficiency, ranked #299 of 301 in IN (top 99%) — low school quality limits family demand, transient renter base, plan for 1-2y turnover; 80% free/reduced lunch — lower-income household profile, screen leases tightly.
- Zoned schools: West Side Leadership Academy (math 2% / reading 42%, grade F, #339 of 369 statewide, top 93%, 1,013 students, 86% FRL).
- Zoned-school proficiency averages 22% at this address vs 7% district-wide (+15 pts) — the actual schools serving this property are materially stronger than the Gary Community School Corporation average implies; a family-tenant draw the district grade alone would hide.
- Market conditions: 46 active listings in the ZIP; 11 comparable units currently listed for rent nearby; rentals leasing fast (median 1d on market — plan ~1-2 weeks tenant-placement turnaround); lower-income renter base — watch delinquency; 1,642 units permitted in Lake County in 2024 (14 in 5+ unit buildings).
- This rent runs 44% of the median local income ($34k/yr) — at the standard rent-burdened threshold; future hikes will face affordability resistance.
Forward outlook
- Local home prices are declining (-3.0%/yr); year-one equity from $761 of loan paydown is wiped out by about $3k of value loss. Plan a longer hold.
- Lake County population projected to shrink 7% by 2050 — rents likely to lag national; underwrite the cash flow, not the appreciation.
Negotiation context
- It's been on market 42 days — a 3% lower offer ($107k) is reasonable based on typical stale-listing flexibility.
- 2 sale attempts; this cycle's ask has dropped $25k (19%) from the opening price — seller is motivated, your offer sets the floor, not the list.
Risks & watch-outs
- Watch-outs: built in 1942 — expect roof / HVAC / electrical / plumbing capex.
Questions for the listing agent
- It's been on market 42 days. Have you received any prior offers? Is the seller open to a 3% concession, seller financing, or rate buy-down credit?
- Built in 1942 — when were the roof, HVAC, electrical panel, plumbing, and water heater last replaced?
- Is there a deadline driving the sale (1031 exchange, divorce, estate, relocation)? That informs how much negotiation room exists.
- Schools are F-rated, which usually means shorter tenancies and higher turnover. Who's the typical renter profile here, and what's been the actual vacancy rate?
- Crime grade is F in this area — have there been break-ins, vandalism, or insurance claims at this property in the last 3 years? What carrier currently insures it and at what premium?
- What's the average days-on-market for RENTAL listings here right now (not sales)? A rising rental-DOM trend means longer vacancies and softer asking-rent achievability than the comps imply.
- What's the recent tenant-quality profile in this submarket — average credit score on applications, eviction rate, late-payment / NSF rate, and stable-employment percentage? A property-management company in the area should have these aggregated.
- How much new for-sale + rental construction is in the pipeline within 1–3 miles? Heavy new supply typically softens prices + rents 12–24 months out; constrained supply supports both.
Investment metrics
- 1% rule
- 1.12% ✓
- Cap rate
- 8.89%
- Cash-on-cash
- 9.26%
- DSCR
- 1.41
- GRM
- 7.5
CMA / ARV
- ARV (median comp)
- $125,049
- List price
- $110,000
- Delta
- 3.16%
- Verdict
- FAIR
- Comps
- 20 within 1.0 mi
Show comp detail 11 sales within ~0.75 mi
| Address | Dist | Beds/Ba | Sqft | Sold | Price | $/sf | Match |
|---|---|---|---|---|---|---|---|
| 434 Pierce St | 0.29mi | 2/1.5 | 945 (+0%) | 0mo | $34,000 | $36 | 84 |
| 302 Lincoln St | 0.08mi | 3/1.0 (+1) | 889 (-6%) | 2mo | $33,900 | $38 | 80 |
| 440 Johnson St | 0.24mi | 2/1.0 | 980 (+4%) | 18mo | $28,000 | $29 | 67 |
| 452 Pierce St | 0.31mi | 2/1.0 | 867 (-8%) | 6mo | $45,000 | $52 | 66 |
| 1009 W 2nd Ave | 0.29mi | 3/1.0 (+1) | 892 (-6%) | 8mo | $179,000 | $201 | 66 |
| 231 Cleveland St | 0.31mi | 3/1.0 (+1) | 1,015 (+8%) | 16mo | $60,000 | $59 | 54 |
| 271 Van Buren St | 0.51mi | 3/2.0 (+1) | 925 (-2%) | 15mo | $108,000 | $117 | 52 |
| 668 Harrison St | 0.68mi | 3/1.5 (+1) | 1,008 (+7%) | 10mo | $40,000 | $40 | 42 |
| 407 Mckinley St | 0.42mi | 3/1.5 (+1) | 1,047 (+11%) | 16mo | $115,140 | $110 | 42 |
| 344 Roosevelt St | 0.49mi | 2/1.0 | 1,057 (+12%) | 21mo | $74,900 | $71 | 40 |
| 353 Madison St | 0.72mi | 3/2.0 (+1) | 850 (-10%) | 8mo | $40,000 | $47 | 34 |
Match score weights: distance 35% · size 25% · config 20% · recency 20%. Top-matched comps best support the ARV.
Projected returns pro-forma
-3.0% appreciation · 3.0% rent growth · sell at horizon
- IRR
- -2.3%
- Equity multiple
- 0.91×
- Total profit
- $-2,684
- Equity at exit
- $16,401
- IRR
- 7.4%
- Equity multiple
- 1.56×
- Total profit
- $17,162
- Equity at exit
- $9,511
Cash invested: $30,800 (down + closing). Projections, not guarantees.
Landlord ↔ Tenant lean methodology
- Overall (STATE)
- 90 Strongly Landlord-Friendly
- State Indiana
- 90 Strongly Landlord-Friendly · R+11
- County
- — inherits STATE
- City
- — inherits STATE
ZIP-level market 46402
- Home prices YoY
- -2.8%
- Active inventory
- 46
- Price-to-rent
- 7.5×
Monthly cashflow live
- Estimated rent
- $1,228 high interval (Pro) →
- Mortgage (P&I)
- −$577
- Tax from tax record
- −$110 /mo · $1,317/yr
- Insurance
- −$46
- HOA
- −$0
- Vacancy / Maint / Mgmt
- −$258
- Net cashflow
- $238
Break-even live
UW: 25.0% down · 7.5% · 30yr · 1.5% tax · 5.0% vac · 8.0% maint · 8.0% mgmt
Financing live
Cash to close
- Down payment
- $27,500
- Closing costs
- $3,300
- Reserves months
- —
- Total cash needed
- —
Loan-product check · same deal, 3 products live
Conventional
25% down · 7.5% · 30yr
- Down + closing
- —
- Monthly P&I
- —
- Monthly cashflow
- —
- DSCR
- —
- Eligible?
- —
Personal DTI + credit; lowest rate.
DSCR
20% down · 8.5% · 30yr
- Down + closing
- —
- Monthly P&I
- —
- Monthly cashflow
- —
- DSCR
- —
- Eligible?
- —
No personal income docs; deal must DSCR.
Hard money
10% down · 12.0% · 12mo
- Down + closing
- —
- Monthly P&I
- —
- Monthly cashflow
- —
- DSCR
- —
- Eligible?
- —
Short-term bridge; refi at stabilization.
Rent comps 11 comps
| Address | Beds | Baths | Sqft | Rent | $/sqft | DOM | Units | Dist |
|---|---|---|---|---|---|---|---|---|
| 317 Garfield St Gary, IN | 3.0 | 1.0 | 936 | $1,495 | $1.60 | 43d | 1 | 0.21mi |
| 358 Arthur St Unit 2 Gary, IN | 1.0 | 1.0 | 800 | $1,080 | $1.35 | 43d | 1 | 0.32mi |
| 358 Arthur St Unit 2 Gary, IN | 2.0 | 1.0 | 800 | $1,250 | $1.56 | 1d | 1 | 0.32mi |
| 411 Pierce St Gary, IN | 3.0 | 1.0 | 874 | $1,395 | $1.60 | 22d | 1 | 0.32mi |
| 2306 W 5th Ave Gary, IN | 2.0–3.0 | 1.0 | 937 | $1,199 | $1.28 | 1d | 2 | 0.60mi |
| 2306 W 5th Ave Apt 3 Gary, IN | 3.0 | 1.0 | 1025 | $1,299 | $1.27 | 1d | 1 | 0.61mi |
| 329 Marshall St Unit 1 Gary, IN | 1.0 | 1.0 | 997 | $900 | $0.90 | 1d | 1 | 0.75mi |
| 762 Harrison St Unit SRO Gary, IN | 1.0 | 1.0 | 1075 | $700 | $0.65 | 1d | 1 | 0.82mi |
| 501 Madison St Gary, IN | 1.0–4.0 | 1.0 | 883 | $1,144 | $1.29 | 1d | 11 | 0.82mi |
| 2939 W 10th Ave Gary, IN | 2.0 | 1.0 | 744 | $1,190 | $1.60 | 1d | 1 | 1.35mi |
| 1521 Pierce St Unit 1 Gary, IN | 2.0 | 1.0 | 800 | $850 | $1.06 | 1d | 1 | 1.38mi |
Listing history 19 events
-
2026-06-18days on market $110,000 Active 42 DOM
-
2026-06-18price $110,000 Active 41 DOM
-
2026-06-17days on market $129,000 Active 41 DOM
-
2026-06-16days on market $129,000 Active 40 DOM
-
2026-06-15days on market $129,000 Active 39 DOM
-
2026-06-13days on market $129,000 Active 37 DOM
-
2026-06-13days on market $129,000 Active 36 DOM
-
2026-06-09days on market $129,000 Active 33 DOM
-
2026-06-08days on market $129,000 Active 32 DOM
-
2026-06-07days on market $129,000 Active 31 DOM
-
2026-06-04days on market $129,000 Active 28 DOM
-
2026-06-03days on market $129,000 Active 27 DOM
-
2026-06-02days on market $129,000 Active 26 DOM
-
2026-06-01days on market $129,000 Active 25 DOM
-
2026-06-01price $129,000 Active 24 DOM
-
2026-05-31days on market $130,000 Active 24 DOM
-
2026-05-07$135,000 Active 489-char remark
-
2026-03-14historical
-
2026-02-24$135,000 Active
ⓘ Source: listings_history table (triggers on properties + properties_extension) + one-shot
backfill from property_details.listing_events for pre-trigger history.
Tax reassessment forecast IN · Partial reset (capped growth)
- Current annual tax
- $1,317 · $110/mo
- Projected year-2 tax
- $1,317 · $110/mo
- Expected delta
- $0/yr ($0/mo · 0.0%)
ⓘ Screening estimate from a state-policy table — verify with the county assessor before closing.
Climate risk First Street
- Flood 1/10 Low FEMA zone X (unshaded) · 0% chance over 30 yrs
- Wildfire 1/10 Low
- Heat 2/10 Low 7 d/yr ≥102°F today · 15 d/yr by 30 yrs out
- Wind 2/10 Low
- Air quality 4/10 Moderate 5 unhealthy d/yr today · 6 by 30 yrs out
Nearby sold comps map
Loading sold comps map…
Walkable amenities ~0.75 mi
Loading nearby amenities…
Taxation est. · year 1
- Rental income
- $14,736
- − Mortgage interest
- −$6,162
- − Property taxes
- −$1,317
- − Insurance
- −$550
- − Repairs & maintenance
- −$1,179
- − Management
- −$1,179
- − Depreciation
- −$3,200
- Taxable income
- $1,150
- Est. tax owed @ 24.0%
- −$276
- After-tax cash flow
- $2,576/yr
For passive investors: Depreciation is non-cash, so a rental often shows a tax loss while cash-flowing — sheltering income. Rental losses are passive: they offset passive income freely, and up to $25,000/yr can offset ordinary (W-2) income if you actively participate and your MAGI is under $100k (phasing out to $0 by $150k); unused losses carry forward. On sale, claimed depreciation is recaptured at up to 25%, and gains may owe capital-gains tax (a 1031 exchange can defer both). Figures are a year-1 estimate at your 24.0% rate — not tax advice; consult a CPA.
Schools (NCES district)
- District
- Gary Community School Corporation
- NCES district ID
- 1803870
- Math proficiency
- 3% ▼ -10.00%
- Reading proficiency
- 11% ▼ -6.00%
- Median HH income
- $27,739
- Composite
- 4.98/100
- National rank
- #10039
- State rank
- #299 of 301 in IN
Livability — Gary
- Score
- 73/100
- State rank
- #105
- US rank
- #5592
Category grades
Schools grade is shown separately in the Schools card above.
Census & demographics
- Census place
- Gary, IN
- County
- Lake County · 422,878 people
- City population
- 63,701
- Metro
- Chicago-Naperville-Elgin, IL-IN-WI
- Population (ZIP)
- 5,836
- Household income
- $33,529
- Rent vs Own
- Severe rent burden
- 336.0
Population outlook (Lake County) Hauer SSP2
- Today (2025)
- 484,026 people
- By 2030
- 478,091 · -1.2%
- By 2040
- 462,974 · -4.3%
- By 2050
- 449,894 · -7.1%
- By 2075
- 436,169 · -9.9%
- By 2100
- 426,607 · -11.9%
Race, ethnicity, and origin ACS 2023
- Neighborhood character
- Predominantly Black (87%)
- Race & ethnicity
- Black 87% Two or more races 5% White 5% Hispanic / Latino 4%
- Common ancestry
- Romanian 1% Ukrainian 1%
- Foreign-born
- 1% · Canada
- Languages at home
- 98% English-only · Spanish 1% Arabic 1%
Political lean MEDSL · Lake
- 2024 margin
- Lean D (+5.6) · D 52.1% · R 46.5% · Other 1.5%
- 2008→2024 swing
- -28.6pp toward R · 2008: 34.3pp · 2024: 5.6pp
- All cycles
- 2024: D+5.6 2020: D+15.1 2016: D+20.6 2012: D+31.0 2008: D+34.3
Not yet ingested
- Civics
- —
Market trends
- HPI YoY
- ▼ -7.21%
- Current HPI
- 250.2464
- Rent YoY
- —
- Metro
- Chicago-Naperville-Elgin, IL-IN-WI
- State GDP YoY
- ▲ 2.90%
- F500 in state
- 18
Industry mix (Fortune 500 HQ in IN)
| Industry | F500 HQs | Revenue |
|---|---|---|
| Industrial Machinery | 2 | $37B |
|
||
| Healthcare | 1 | $177B |
|
||
| Pharmaceuticals | 1 | $45B |
|
||
| Metals / Steel | 1 | $18B |
|
||
| Agriculture | 1 | $17B |
|
||
| Packaging | 1 | $12B |
|
||
Price history
-18.5% since first listed6 events — show timeline
- 2026-06-17 Price Changed $110,000 NIRA MLS as Distributed by MLS Grid
- 2026-05-31 Price Changed $129,000 NIRA MLS as Distributed by MLS Grid
- 2026-05-20 Price Changed $130,000 NIRA MLS as Distributed by MLS Grid
- 2026-05-07 Listed $135,000 NIRA MLS as Distributed by MLS Grid
- 2026-03-14 Listing Removed — NIRA MLS as Distributed by MLS Grid
- 2026-02-24 Listed $135,000 NIRA MLS as Distributed by MLS Grid
Property tax history
+7.6%/yrLatest (2024): $1,317 · +218.9% YoY. Source: county tax records.
Cash-flow waterfall
monthlySold comps — $/sqft
last 12 mo · ≤1 miLoading sold comps…