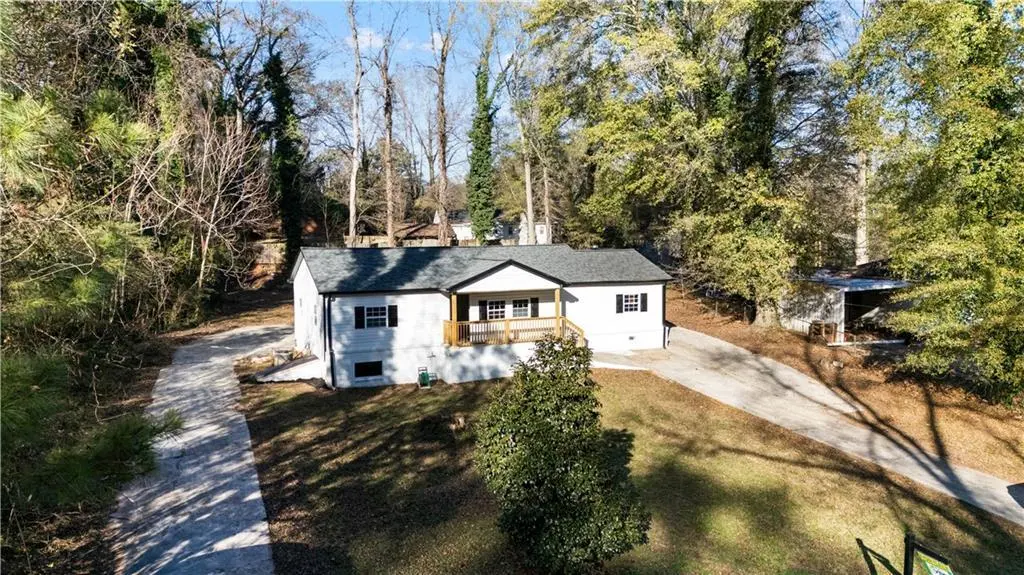
1794 Blossom Ln · Mableton, GA
Flood risk 1/10 · Minimal
- FEMA flood zone
- X (unshaded)
- Chance of flooding over 30 yrs
- 0.0%
- Est. flood insurance / yr
- $507 – $1,088
Fire risk 1/10 · Minimal
- Est. fire insurance / yr
- $963 – $1,789
Heat risk 5/10 · Moderate
- Hot days now (above 103°F)
- 7 days/yr
- Hot days in 30 yrs
- 17 days/yr
Wind risk 4/10 · Minor
- Chance of severe wind over 30 yrs
- 24.0%
Air-quality risk 4/10 · Minor
- Unhealthy air days now
- 4 days/yr
- Unhealthy air days in 30 yrs
- 5 days/yr
Risk factors via First Street. Map © Google.
Why this score? — see what drove the D grade
The composite is a weighted blend of 9 inputs, each scored 0–100. Each bar is that input's sub-score; the figure is the points it added to the 100-point composite (weight × sub-score).
- Cash flow +11.7/30.0
- ARV discount +11.0/15.0
- Schools +3.8/10.0
- Livability +3.5/5.0
- DSCR +3.4/10.0
- 1% rule +2.7/10.0
- Rent growth +2.7/5.0
- Condition / age +2.5/5.0
- Appreciation +0.0/10.0
$338,000
🖨 Deal sheet 📄 Offer letter ✓ Due diligence
Listing remarks MLS
Fully renovated ranch-style home offering 5 bedrooms and 3 full bathrooms, located on a quiet residential street in Austell. This move-in-ready property features a spacious and functional open layout designed for modern living, with generous bedrooms and two en-suite bathrooms that provide extra comfort and privacy. Recent upgrades include a brand-new kitchen with contemporary finishes, fully updated bathrooms, new flooring throughout, and a new HVAC system and new roof for improved efficiency and peace of mind. Situated on a nearly half-acre lot, the home also offers a double driveway and a crawl space that provides excellent additional space for storage. With no HOA restrictions, this property offers flexibility and freedom. Conveniently located near schools, shopping, and major highways, it combines comfort, accessibility, and value in one package. The seller is motivated and open to assisting with closing costs. Our preferred lender, Ameris Bank, is offering up to $7,500 toward down payment assistance for qualified first-time homebuyers. Schedule your showing today through ShowingTime.
Key facts
- Fully renovated
- Brand new kitchen
- New flooring
Tags
Property features AI
Exterior
- Utilities: Public water; Septic tank sewer
- Home design: Single-level (one story); Resale property
- Construction: Built with other/unspecified construction materials; Other/unspecified roof type
- Exterior features: Tax/legal description identifies the site as Lot 1
Interior
- Kitchen: No kitchen features listed; Appliances listed as 'Other'
- Bedrooms: Five main-level bedrooms; No special bedroom features listed
- Bathrooms: Three full bathrooms (all on the main level); No master bathroom features listed
- Interior features: No shared/common walls; Crawl space basement; Other interior features
- Laundry & utility: No laundry or utility appliances specified
Neighborhood map
What this means for you Summary
Snapshot
- This is a 5-bed/3.0-bath single-family listed at $338k.
Deal economics
- At list price, monthly cash flow is $-101 ($-1k/yr) — negative.
- To cash-flow at today's rent, offer at most $320k (5.3% below list).
- To meet the 1% rule (rent ≥ 1% of price), the offer needs to be $262k (22.6% below list).
- Recommended offer: $262k (22.6% below list) — sets the bar for 1% rule.
- Cap rate 5.9% vs local median 4.0% in Mableton — top-decile yield for the area; either an underpriced asset or a hidden risk that comps aren't pricing in. Stress-test before assuming the spread holds.
Location & tenants
- Location reads 70/100 on livability (#94 in GA) — a middle-class / working-renter tenant base. Strengths: housing A+, cost of living A-, crime B+; Watch: amenities F, commute D-.
- Cobb County (suburban): math 39% / reading 45% proficiency, ranked #25 of 174 in GA (top 14%) — families likely to look elsewhere, expect single-tenant / working-renter base with shorter leases.
- Zoned schools: Mableton Elementary School (math 18% / reading 21%, grade F, #878 of 1,228 statewide, top 75%, 898 students, 81% FRL); Garrett Middle School (math 15% / reading 21%, grade F, #375 of 470 statewide, top 80%, 906 students, 85% FRL); Pebblebrook High School (math 23% / reading 30%, grade F, #171 of 424 statewide, top 41%, 2,511 students, 70% FRL) — zoned schools average 79% FRL vs 39% district-wide (40 pts higher); higher-poverty schools than district average — tighter screening recommended.
- Zoned-school proficiency averages 21% at this address vs 42% district-wide (-21 pts) — the specific schools serving this property underperform the Cobb County average; the district grade overstates school quality for this exact location.
- Market conditions: Rents flat; 126 active listings in the ZIP; 1 comparable units currently listed for rent nearby; 1,625 units permitted in Cobb County in 2024 (389 in 5+ unit buildings).
Forward outlook
- Local home prices are declining (-3.0%/yr); year-one equity from $2k of loan paydown is wiped out by about $10k of value loss. Plan a longer hold.
- Cobb County population projected at +33% by 2050 — long-run rental-demand tailwind backs the buy-and-hold thesis.
Negotiation context
- It's been on market 41 days — a 3% lower offer ($328k) is reasonable based on typical stale-listing flexibility.
- 15 sale attempts since 19y ago with the ask held roughly flat each time — persistent listings suggest the price (not the market) is what's stuck; bring a comps-based counter.
- Current owner paid $180k; list at $338k implies a 88% gain — meaningful room to come down on a strong offer.
Risks & watch-outs
- Watch-outs: built in 1955 — expect roof / HVAC / electrical / plumbing capex.
- Climate carrying-cost: extreme-heat days projected 7→17/yr by 2055 (HVAC capex compounding) — expect insurance premiums to compound above CPI over the hold.
Questions for the listing agent
- What do current leases actually rent for vs. the listed asking? Can we see a recent rent roll and the last 12 months of T-12 income?
- It's been on market 41 days. Have you received any prior offers? Is the seller open to a 23% concession, seller financing, or rate buy-down credit?
- Built in 1955 — when were the roof, HVAC, electrical panel, plumbing, and water heater last replaced?
- Is there a deadline driving the sale (1031 exchange, divorce, estate, relocation)? That informs how much negotiation room exists.
- Schools are F-rated, which usually means shorter tenancies and higher turnover. Who's the typical renter profile here, and what's been the actual vacancy rate?
- The area grade is low — what's the realistic commute time and amenity access for the typical tenant pool here? Any planned neighborhood developments (good or bad) we should know about?
- What's the average days-on-market for RENTAL listings here right now (not sales)? A rising rental-DOM trend means longer vacancies and softer asking-rent achievability than the comps imply.
- What's the recent tenant-quality profile in this submarket — average credit score on applications, eviction rate, late-payment / NSF rate, and stable-employment percentage? A property-management company in the area should have these aggregated.
- How much new for-sale + rental construction is in the pipeline within 1–3 miles? Heavy new supply typically softens prices + rents 12–24 months out; constrained supply supports both.
Investment metrics
- 1% rule
- 0.77% ✗
- Cap rate
- 5.94%
- Cash-on-cash
- -1.28%
- DSCR
- 0.94
- GRM
- 10.8
CMA / ARV
- ARV (median comp)
- $366,410
- List price
- $338,000
- Delta
- -7.75%
- Verdict
- FAIR
- Comps
- 20 within 1.0 mi
Show comp detail 12 sales within ~0.75 mi
| Address | Dist | Beds/Ba | Sqft | Sold | Price | $/sf | Match |
|---|---|---|---|---|---|---|---|
| 1920 Silver Creek Dr | 0.58mi | 4/3.0 (-1) | 2,190 (+8%) | 2mo | $278,000 | $127 | 52 |
| 5823 James Rd | 0.56mi | 5/2.0 | 1,976 (-2%) | 18mo | $337,000 | $171 | 51 |
| 2149 Apple Orchard Way | 0.66mi | 4/2.5 (-1) | 2,090 (+3%) | 10mo | $375,000 | $179 | 48 |
| 1886 S Carisbrook Pl | 0.35mi | 4/2.5 (-1) | 2,273 (+12%) | 13mo | $365,000 | $161 | 46 |
| 1522 Priscilla Ln | 0.52mi | 4/3.0 (-1) | 2,149 (+6%) | 21mo | $436,850 | $203 | 43 |
| 6255 James Rd | 0.66mi | 5/3.0 | 1,807 (-11%) | 13mo | $400,000 | $221 | 41 |
| 1785 Belcher Cir | 0.43mi | 4/2.0 (-1) | 1,857 (-8%) | 22mo | $290,000 | $156 | 38 |
| 6322 Caroline Ct | 0.67mi | 4/3.0 (-1) | 2,200 (+9%) | 16mo | $421,000 | $191 | 36 |
| 2123 Apple Orchard Way | 0.63mi | 4/2.5 (-1) | 2,180 (+8%) | 18mo | $380,000 | $174 | 36 |
| 2173 Apple Orchard Way | 0.70mi | 4/2.5 (-1) | 2,305 (+14%) | 3mo | $374,000 | $162 | 34 |
| 6264 James Rd | 0.65mi | 4/2.0 (-1) | 2,212 (+9%) | 14mo | $442,900 | $200 | 34 |
| 2132 Shadygrove Walk | 0.74mi | 4/2.5 (-1) | 2,246 (+11%) | 17mo | $355,000 | $158 | 26 |
Match score weights: distance 35% · size 25% · config 20% · recency 20%. Top-matched comps best support the ARV.
Projected returns pro-forma
-3.0% appreciation · 0.77% rent growth · sell at horizon
- IRR
- -20.8%
- Equity multiple
- 0.29×
- Total profit
- $-67,000
- Equity at exit
- $50,397
- IRR
- -19.6%
- Equity multiple
- 0.06×
- Total profit
- $-89,413
- Equity at exit
- $29,224
Cash invested: $94,640 (down + closing). Projections, not guarantees.
Landlord ↔ Tenant lean methodology
- Overall (STATE)
- 90 Strongly Landlord-Friendly
- State Georgia
- 90 Strongly Landlord-Friendly · R+3
- County
- — inherits STATE
- City
- — inherits STATE
ZIP-level market 30168
- Home prices YoY
- -25.5%
- Rents YoY
- 0.8%
- Active inventory
- 126
- Price-to-rent
- 10.8×
Monthly cashflow live
- Estimated rent
- $2,618 medium interval (Pro) →
- Mortgage (P&I)
- −$1,773
- Tax from tax record
- −$255 /mo · $3,065/yr
- Insurance
- −$141
- HOA
- −$0
- Vacancy / Maint / Mgmt
- −$550
- Net cashflow
- $-101
Break-even live
UW: 25.0% down · 7.5% · 30yr · 1.5% tax · 5.0% vac · 8.0% maint · 8.0% mgmt
Financing live
Cash to close
- Down payment
- $84,500
- Closing costs
- $10,140
- Reserves months
- —
- Total cash needed
- —
Loan-product check · same deal, 3 products live
Conventional
25% down · 7.5% · 30yr
- Down + closing
- —
- Monthly P&I
- —
- Monthly cashflow
- —
- DSCR
- —
- Eligible?
- —
Personal DTI + credit; lowest rate.
DSCR
20% down · 8.5% · 30yr
- Down + closing
- —
- Monthly P&I
- —
- Monthly cashflow
- —
- DSCR
- —
- Eligible?
- —
No personal income docs; deal must DSCR.
Hard money
10% down · 12.0% · 12mo
- Down + closing
- —
- Monthly P&I
- —
- Monthly cashflow
- —
- DSCR
- —
- Eligible?
- —
Short-term bridge; refi at stabilization.
Rent comps 1 comps
| Address | Beds | Baths | Sqft | Rent | $/sqft | DOM | Units | Dist |
|---|---|---|---|---|---|---|---|---|
| 5065 Landover Way Austell, GA | 4.0 | 3.0 | 2465 | $2,665 | $1.08 | 20d | 1 | 0.92mi |
Listing history 50 events
-
2026-06-18days on market $338,000 Active 41 DOM
-
2026-06-17days on market $338,000 Active 40 DOM
-
2026-06-16days on market $338,000 Active 39 DOM
-
2026-06-15days on market $338,000 Active 38 DOM
-
2026-06-13days on market $338,000 Active 36 DOM
-
2026-06-13days on market $338,000 Active 35 DOM
-
2026-06-09days on market $338,000 Active 32 DOM
-
2026-06-08days on market $338,000 Active 31 DOM
-
2026-06-07days on market $338,000 Active 30 DOM
-
2026-06-04days on market $338,000 Active 27 DOM
-
2026-06-03days on market $338,000 Active 26 DOM
-
2026-06-02days on market $338,000 Active 25 DOM
-
2026-06-01days on market $338,000 Active 24 DOM
-
2026-05-31days on market $338,000 Active 23 DOM
-
2026-05-18price $338,000 568-char remark
-
2026-05-08$343,800 Active 568-char remark
Show marketing remark (1109 chars)
Fully renovated ranch-style home offering 5 bedrooms and 3 full bathrooms, located on a quiet residential street in Austell. This move-in-ready property features a spacious and functional open layout designed for modern living, with generous bedrooms and two en-suite bathrooms that provide extra comfort and privacy. Recent upgrades include a brand-new kitchen with contemporary finishes, fully updated bathrooms, new flooring throughout, and a new HVAC system and new roof for improved efficiency and peace of mind. Situated on a nearly half-acre lot, the home also offers a double driveway and a crawl space that provides excellent additional space for storage. With no HOA restrictions, this property offers flexibility and freedom. Conveniently located near schools, shopping, and major highways, it combines comfort, accessibility, and value in one package. The seller is motivated and open to assisting with closing costs. Our preferred lender, Ameris Bank, is offering up to $7,500 toward down payment assistance for qualified first-time homebuyers. Schedule your showing today through ShowingTime.
-
2026-05-08$343,800 New 1109-char remark
Show marketing remark (1109 chars)
Fully renovated ranch-style home offering 5 bedrooms and 3 full bathrooms, located on a quiet residential street in Austell. This move-in-ready property features a spacious and functional open layout designed for modern living, with generous bedrooms and two en-suite bathrooms that provide extra comfort and privacy. Recent upgrades include a brand-new kitchen with contemporary finishes, fully updated bathrooms, new flooring throughout, and a new HVAC system and new roof for improved efficiency and peace of mind. Situated on a nearly half-acre lot, the home also offers a double driveway and a crawl space that provides excellent additional space for storage. With no HOA restrictions, this property offers flexibility and freedom. Conveniently located near schools, shopping, and major highways, it combines comfort, accessibility, and value in one package. The seller is motivated and open to assisting with closing costs. Our preferred lender, Ameris Bank, is offering up to $7,500 toward down payment assistance for qualified first-time homebuyers. Schedule your showing today through ShowingTime.
-
2026-04-30historical
-
2026-04-30historical
-
2026-04-22price $345,000
-
2026-04-22price $345,000
-
2026-03-07price $348,800
-
2025-12-08$350,000 Active
-
2025-12-08$350,000 New
-
2025-05-27soldstatus $180,000
-
2025-05-20soldstatus $180,000 Sold
-
2025-05-20soldstatus $180,000 Closed
-
2025-05-09historical Active Under Contract
-
2025-05-09status Under Contract
-
2025-05-07status Active
-
2025-05-06status Back On Market
-
2025-05-02status Under Contract
-
2025-05-02status Pending
-
2025-04-29status Active
-
2025-04-23status Pending
-
2025-04-10$259,900 New
-
2025-04-10$259,900 Active
-
2023-12-31historical
-
2023-03-31price $245,000
-
2023-02-01$255,000 New
-
2022-12-31historical
-
2022-11-06price $245,000
-
2022-09-21status Back On Market
-
2022-09-20status Under Contract
-
2022-09-05status Back On Market
-
2022-08-05status Under Contract
-
2022-07-09$255,000 New
-
2010-09-08historical
-
2010-09-03soldstatus $65,000 Sold
-
2010-07-20status Pending
ⓘ Source: listings_history table (triggers on properties + properties_extension) + one-shot
backfill from property_details.listing_events for pre-trigger history.
Tax reassessment forecast GA · Resets to sale price
- Current annual tax
- $3,065 · $255/mo
- Projected year-2 tax
- $3,110 · $259/mo
- Expected delta
- +$44/yr (+$4/mo · 1.4%)
ⓘ Screening estimate from a state-policy table — verify with the county assessor before closing.
Climate risk First Street
- Flood 1/10 Low FEMA zone X (unshaded) · 0% chance over 30 yrs
- Wildfire 1/10 Low
- Heat 5/10 Major 7 d/yr ≥103°F today · 17 d/yr by 30 yrs out
- Wind 4/10 Moderate 24% chance of damaging wind over 30 yrs
- Air quality 4/10 Moderate 4 unhealthy d/yr today · 5 by 30 yrs out
Nearby sold comps map
Loading sold comps map…
Walkable amenities ~0.75 mi
Loading nearby amenities…
Taxation est. · year 1
- Rental income
- $31,412
- − Mortgage interest
- −$18,933
- − Property taxes
- −$3,065
- − Insurance
- −$1,690
- − Repairs & maintenance
- −$2,513
- − Management
- −$2,513
- − Depreciation
- −$9,833
- Taxable loss
- −$7,135
- Est. tax savings @ 24.0%
- +$1,712
- After-tax cash flow
- $503/yr
For passive investors: Depreciation is non-cash, so a rental often shows a tax loss while cash-flowing — sheltering income. Rental losses are passive: they offset passive income freely, and up to $25,000/yr can offset ordinary (W-2) income if you actively participate and your MAGI is under $100k (phasing out to $0 by $150k); unused losses carry forward. On sale, claimed depreciation is recaptured at up to 25%, and gains may owe capital-gains tax (a 1031 exchange can defer both). Figures are a year-1 estimate at your 24.0% rate — not tax advice; consult a CPA.
Schools (NCES district)
- District
- Cobb County
- NCES district ID
- 1301290
- Math proficiency
- 39% ▼ -15.00%
- Reading proficiency
- 45% ▼ -10.00%
- Median HH income
- $68,845
- Composite
- 37.93/100
- National rank
- #4308
- State rank
- #25 of 174 in GA
Livability — Mableton
- Score
- 70/100
- State rank
- #94
- US rank
- #7534
Category grades
Schools grade is shown separately in the Schools card above.
Census & demographics
- Census place
- Mableton, GA
- County
- Cobb County · 777,758 people
- City population
- 41,829
- Metro
- Atlanta-Sandy Springs-Alpharetta, GA
- Population (ZIP)
- 26,612
- Household income
- $64,059
- Rent vs Own
- Severe rent burden
- 993.0
Population outlook (Cobb County) Hauer SSP2
- Today (2025)
- 868,385 people
- By 2030
- 929,614 · +7.1%
- By 2040
- 1,047,533 · +20.6%
- By 2050
- 1,155,537 · +33.1%
- By 2075
- 1,405,030 · +61.8%
- By 2100
- 1,555,058 · +79.1%
Race, ethnicity, and origin ACS 2023
- Neighborhood character
- Diverse neighborhood (Simpson 0.55)
- Race & ethnicity
- Black 63% Hispanic / Latino 21% White 10% Two or more races 9% Asian 1%
- Hispanic origin (detail)
- Mexican 13%
- Common ancestry
- Italian 4% Hispanic 1%
- Foreign-born
- 19% · Canada
- Languages at home
- 74% English-only · Spanish 20% French/Haitian/Cajun 1% Other Indo-European 1%
Political lean MEDSL · Cobb
- 2024 margin
- D (+14.9) · D 56.9% · R 42.0% · Other 1.1%
- 2008→2024 swing
- +24.3pp toward D · 2008: -9.4pp · 2024: 14.9pp
- All cycles
- 2024: D+14.9 2020: D+14.3 2016: D+2.1 2012: R+12.6 2008: R+9.4
Not yet ingested
- Civics
- —
Market trends
- HPI YoY
- ▼ -84.55%
- Current HPI
- 246.7995
- Rent YoY
- ▲ 0.77%
- Metro
- Atlanta-Sandy Springs-Alpharetta, GA
- State GDP YoY
- ▲ 2.66%
- F500 in state
- 28
Industry mix (Fortune 500 HQ in GA)
| Industry | F500 HQs | Revenue |
|---|---|---|
| Paper / Packaging | 2 | $29B |
|
||
| Retail | 1 | $160B |
|
||
| Transportation / Logistics | 1 | $91B |
|
||
| Airlines | 1 | $62B |
|
||
| Consumer Goods | 1 | $47B |
|
||
| Utilities | 1 | $25B |
|
||
Price history
+651.1% since first listed48 events — show timeline
- 2026-05-19 Price Changed $338,000 GAMLS
- 2026-05-18 Price Changed $338,000 FMLS
- 2026-05-08 Listed $343,800 FMLS
- 2026-05-08 Listed $343,800 GAMLS
- 2026-04-30 Listing Removed — GAMLS
- 2026-04-30 Listing Removed — FMLS
- 2026-04-22 Price Changed $345,000 GAMLS
- 2026-04-22 Price Changed $345,000 FMLS
- 2026-03-07 Price Changed $348,800 FMLS
- 2025-12-08 Listed $350,000 GAMLS
- 2025-12-08 Listed $350,000 FMLS
- 2025-05-27 Sold (Public Records) $180,000 Public Records
- 2025-05-20 Sold (MLS) $180,000 FMLS
- 2025-05-20 Sold (MLS) $180,000 GAMLS
- 2025-05-09 Contingent — FMLS
- 2025-05-09 Pending — GAMLS
- 2025-05-07 Relisted — FMLS
- 2025-05-06 Relisted — GAMLS
- 2025-05-02 Pending — GAMLS
- 2025-05-02 Pending — FMLS
- 2025-04-29 Relisted — FMLS
- 2025-04-23 Pending — FMLS
- 2025-04-10 Listed $259,900 FMLS
- 2025-04-10 Listed $259,900 GAMLS
- 2023-12-31 Listing Removed — GAMLS
- 2023-03-31 Price Changed $245,000 GAMLS
- 2023-02-01 Listed $255,000 GAMLS
- 2022-12-31 Listing Removed — GAMLS
- 2022-11-06 Price Changed $245,000 GAMLS
- 2022-09-21 Relisted — GAMLS
- 2022-09-20 Pending — GAMLS
- 2022-09-05 Relisted — GAMLS
- 2022-08-05 Pending — GAMLS
- 2022-07-09 Listed $255,000 GAMLS
- 2010-09-08 Listing Removed — FMLS
- 2010-09-03 Sold (MLS) $65,000 FMLS
- 2010-07-20 Pending — FMLS
- 2010-06-22 Price Changed $65,000 GAMLS
- 2010-06-21 Price Changed $65,000 FMLS
- 2010-05-18 Listed $75,000 FMLS
- 2007-08-08 Sold (Public Records) $99,000 Public Records
- 2007-07-30 Sold (MLS) $99,000 FMLS
- 2007-02-23 Listed $99,900 FMLS
- 2005-07-20 Sold (Public Records) $165,000 Public Records
- 2004-02-11 Sold (Public Records) $163,000 Public Records
- 2002-11-01 Sold (Public Records) $42,000 Public Records
- 1988-01-05 Sold (Public Records) $58,500 Public Records
- 1985-11-11 Sold (Public Records) $45,000 Public Records
Property tax history
+7.4%/yrLatest (2025): $3,065 · -12.4% YoY. Source: county tax records.
Cash-flow waterfall
monthlySold comps — $/sqft
last 12 mo · ≤1 miLoading sold comps…