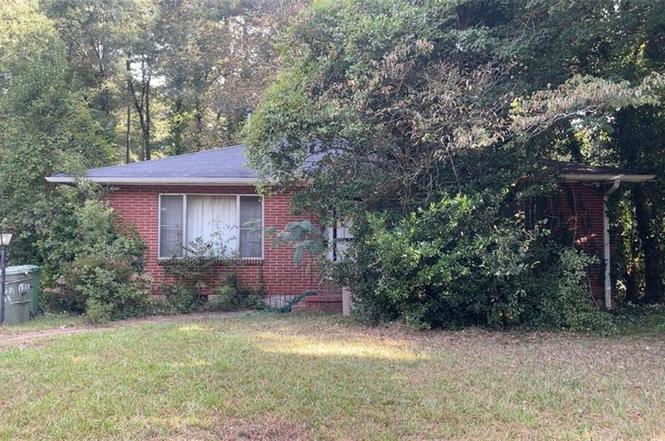
1855 Bayberry Dr SW · Atlanta, GA
Flood risk 1/10 · Minimal
- FEMA flood zone
- X (unshaded)
- Chance of flooding over 30 yrs
- 0.0%
- Est. flood insurance / yr
- $473 – $860
Fire risk 1/10 · Minimal
- Est. fire insurance / yr
- $963 – $1,789
Heat risk 5/10 · Moderate
- Hot days now (above 104°F)
- 6 days/yr
- Hot days in 30 yrs
- 16 days/yr
Wind risk 5/10 · Moderate
- Chance of severe wind over 30 yrs
- 25.0%
Air-quality risk 4/10 · Minor
- Unhealthy air days now
- 4 days/yr
- Unhealthy air days in 30 yrs
- 6 days/yr
Risk factors via First Street. Map © Google.
Why this score? — see what drove the B+ grade
The composite is a weighted blend of 9 inputs, each scored 0–100. Each bar is that input's sub-score; the figure is the points it added to the 100-point composite (weight × sub-score).
- Cash flow +30.0/30.0
- ARV discount +15.0/15.0
- 1% rule +10.0/10.0
- DSCR +10.0/10.0
- Livability +4.2/5.0
- Schools +2.7/10.0
- Rent growth +2.5/5.0
- Condition / age +2.5/5.0
- Appreciation +0.0/10.0
$105,000
🖨 Deal sheet 📄 Offer letter ✓ Due diligence
Listing remarks
Great investment opportunity in the sought-after Adams Park/Cascade area! Property needs rehab and is priced accordingly. Solid structure with tons of upside for renovation or rental. Minutes to Adams Park, Cascade Springs Nature Preserve, and John A. White Golf Course. Convenient to the BeltLine, I-285, Downtown, and the Airport. Sold As-Is. No Seller Repairs. Listing Agent Wafeeq Tillery EXP Realty, LLC.
Key facts
- Convenient to i-285
- Solid structure
- 0.3 acre lot
Tags
Neighborhood map
What this means for you Summary
Snapshot
- This is a 3-bed/1.0-bath single-family listed at $105k.
Deal economics
- At list price, monthly cash flow is $909 ($11k/yr) — positive.
- The deal already cash-flows at list — no discount required.
- Meets the 1% rule at list price ($2k rent vs $105k).
- Cap rate 16.7% vs local median 3.1% in Atlanta — top-decile yield for the area; either an underpriced asset or a hidden risk that comps aren't pricing in. Stress-test before assuming the spread holds.
Location & tenants
- Location reads 83/100 on livability (#6 in GA, #919 nationally) — a professional / high-income tenant draw. Strengths: amenities A+, commute A+, housing A+; Watch: cost of living C-.
- Atlanta Public Schools (urban): math 28% / reading 35% proficiency, ranked #80 of 174 in GA (top 46%) — families likely to look elsewhere, expect single-tenant / working-renter base with shorter leases; 71% free/reduced lunch — lower-income household profile, screen leases tightly.
- Zoned schools: Tuskegee Airman Global Academy (math 2% / reading 2%, grade F, #1,204 of 1,228 statewide, top 100%, 520 students, 100% FRL); Herman J. Russell West End Academy (math 12% / reading 12%, grade F, #417 of 470 statewide, top 90%, 399 students, 100% FRL); Booker T. Washington High School (math 24% / reading 24%, grade F, #184 of 424 statewide, top 48%, 831 students, 100% FRL) — zoned schools average 100% FRL vs 71% district-wide (29 pts higher); higher-poverty schools than district average — tighter screening recommended.
- Zoned-school proficiency averages 13% at this address vs 32% district-wide (-18 pts) — the specific schools serving this property underperform the Atlanta Public Schools average; the district grade overstates school quality for this exact location.
- Market conditions: Rents soft (-0.2%/yr); 245 active listings in the ZIP; 40 comparable units currently listed for rent nearby; rentals at typical pace (median 25d on market — plan ~3-4 weeks tenant-placement turnaround); 11,565 units permitted in Fulton County in 2024 (8,159 in 5+ unit buildings).
- At $1,992/mo this rent would consume 47% of the median local household income ($51k/yr) (locally 2825% of renters already pay >50% of income on rent) — very limited rent-growth headroom before tenants either downsize or default.
Forward outlook
- Local home prices are declining (-3.0%/yr); year-one equity from $726 of loan paydown is wiped out by about $3k of value loss. Plan a longer hold.
- Fulton County population projected at +38% by 2050 — long-run rental-demand tailwind backs the buy-and-hold thesis.
- At projected returns (-3.0% appreciation + 0.0% rent growth), your $29k cash investment doubles in ~4 years — after that, you're playing with house money.
Negotiation context
- Only 11 days on market — expect competitive offers; lowballing is unlikely to land.
- Current owner paid $65k; list at $105k implies a 62% gain — meaningful room to come down on a strong offer.
Risks & watch-outs
- Watch-outs: built in 1950 — expect roof / HVAC / electrical / plumbing capex.
- Climate carrying-cost: moderate wind risk, 25% chance of damaging wind over 30y; extreme-heat days projected 6→16/yr by 2055 (HVAC capex compounding) — expect insurance premiums to compound above CPI over the hold.
Questions for the listing agent
- Built in 1950 — when were the roof, HVAC, electrical panel, plumbing, and water heater last replaced?
- Is there a deadline driving the sale (1031 exchange, divorce, estate, relocation)? That informs how much negotiation room exists.
- What's the average days-on-market for RENTAL listings here right now (not sales)? A rising rental-DOM trend means longer vacancies and softer asking-rent achievability than the comps imply.
- What's the recent tenant-quality profile in this submarket — average credit score on applications, eviction rate, late-payment / NSF rate, and stable-employment percentage? A property-management company in the area should have these aggregated.
- How much new for-sale + rental construction is in the pipeline within 1–3 miles? Heavy new supply typically softens prices + rents 12–24 months out; constrained supply supports both.
Investment metrics
- 1% rule
- 1.90% ✓
- Cap rate
- 16.69%
- Cash-on-cash
- 37.12%
- DSCR
- 2.65
- GRM
- 4.4
CMA / ARV
- ARV (on-the-fly)
- $183,568
- Comps found
- 12
Show comp detail 12 sales within ~0.75 mi
| Address | Dist | Beds/Ba | Sqft | Sold | Price | $/sf | Match |
|---|---|---|---|---|---|---|---|
| 1761 Venetian Dr SW | 0.18mi | 3/2.0 | 1,302 (+6%) | 6mo | $194,000 | $149 | 73 |
| 1440 Boulevard Lorraine SW | 0.53mi | 3/1.0 | 1,209 (-2%) | 0mo | $217,000 | $179 | 72 |
| 1368 Wichita Dr SW | 0.40mi | 3/2.0 | 1,225 (-1%) | 6mo | $275,000 | $224 | 71 |
| 1925 Campbellton Rd SW | 0.55mi | 3/1.0 | 1,232 (0%) | 5mo | $170,000 | $138 | 70 |
| 1753 Beechwood Blvd SW | 0.27mi | 3/1.5 | 1,116 (-9%) | 3mo | $147,000 | $132 | 68 |
| 1454 Westridge Rd SW | 0.12mi | 4/2.0 (+1) | 1,343 (+9%) | 4mo | $189,900 | $141 | 68 |
| 1169 Eastridge Rd SW | 0.52mi | 3/2.0 | 1,316 (+7%) | 2mo | $168,000 | $128 | 59 |
| 1439 Aniwaka Ave SW | 0.41mi | 3/2.0 | 1,360 (+10%) | 4mo | $275,000 | $202 | 56 |
| 1283 Wichita Dr SW | 0.51mi | 3/2.5 | 1,344 (+9%) | 1mo | $330,000 | $246 | 54 |
| 1762 Hadlock St SW | 0.63mi | 3/1.5 | 1,140 (-8%) | 4mo | $140,000 | $123 | 53 |
| 1223 Lockwood Dr SW | 0.66mi | 2/1.0 (-1) | 1,274 (+3%) | 7mo | $130,000 | $102 | 53 |
| 1675 Avon Ave SW | 0.56mi | 4/3.0 (+1) | 1,156 (-6%) | 3mo | $353,000 | $305 | 48 |
Match score weights: distance 35% · size 25% · config 20% · recency 20%. Top-matched comps best support the ARV.
Projected returns pro-forma
-3.0% appreciation · 0.0% rent growth · sell at horizon
- IRR
- 29.7%
- Equity multiple
- 2.19×
- Total profit
- $35,058
- Equity at exit
- $15,656
- IRR
- 35.3%
- Equity multiple
- 3.81×
- Total profit
- $82,513
- Equity at exit
- $9,078
Cash invested: $29,400 (down + closing). Projections, not guarantees.
Landlord ↔ Tenant lean methodology
- Overall (STATE)
- 90 Strongly Landlord-Friendly
- State Georgia
- 90 Strongly Landlord-Friendly · R+3
- County
- — inherits STATE
- City
- — inherits STATE
ZIP-level market 30311
- Home prices YoY
- -33.3%
- Rents YoY
- -0.2%
- Active inventory
- 245
- Price-to-rent
- 4.4×
Monthly cashflow live
- Estimated rent
- $1,992 high interval (Pro) →
- Mortgage (P&I)
- −$551
- Tax from tax record
- −$70 /mo · $840/yr
- Insurance
- −$44
- HOA
- −$0
- Vacancy / Maint / Mgmt
- −$418
- Net cashflow
- $909
Break-even live
UW: 25.0% down · 7.5% · 30yr · 1.5% tax · 5.0% vac · 8.0% maint · 8.0% mgmt
Financing live
Cash to close
- Down payment
- $26,250
- Closing costs
- $3,150
- Reserves months
- —
- Total cash needed
- —
Loan-product check · same deal, 3 products live
Conventional
25% down · 7.5% · 30yr
- Down + closing
- —
- Monthly P&I
- —
- Monthly cashflow
- —
- DSCR
- —
- Eligible?
- —
Personal DTI + credit; lowest rate.
DSCR
20% down · 8.5% · 30yr
- Down + closing
- —
- Monthly P&I
- —
- Monthly cashflow
- —
- DSCR
- —
- Eligible?
- —
No personal income docs; deal must DSCR.
Hard money
10% down · 12.0% · 12mo
- Down + closing
- —
- Monthly P&I
- —
- Monthly cashflow
- —
- DSCR
- —
- Eligible?
- —
Short-term bridge; refi at stabilization.
Rent comps 40 comps
| Address | Beds | Baths | Sqft | Rent | $/sqft | DOM | Units | Dist |
|---|---|---|---|---|---|---|---|---|
| 1848 Cummings Dr SW Atlanta, GA | 4.0 | 1.0 | 1216 | $1,795 | $1.48 | 24d | 1 | 0.07mi |
| 1876 Sandtown Rd SW Atlanta, GA | 3.0 | 2.0 | 1230 | $2,500 | $2.03 | 24d | 1 | 0.18mi |
| 1346 Wichita Dr SW Atlanta, GA | 3.0 | 2.0 | 1183 | $2,125 | $1.80 | 8d | 1 | 0.41mi |
| 1873 Campbellton Rd SW Unit A11 Atlanta, GA | 4.0 | 2.0 | 1464 | $1,855 | $1.27 | 24d | 1 | 0.45mi |
| 1681 Hadlock St SW Atlanta, GA | 3.0 | 2.0 | 1170 | $1,875 | $1.60 | 5d | 1 | 0.45mi |
| 1300 Wichita Dr SW Atlanta, GA | 3.0 | 2.0 | 1077 | $2,200 | $2.04 | 24d | 1 | 0.46mi |
| 1404 Lockwood Dr SW Atlanta, GA | 2.0 | 2.0 | 980 | $1,700 | $1.73 | 8d | 1 | 0.55mi |
| 1408 Lockwood Dr SW Atlanta, GA | 3.0 | 2.0 | 1300 | $1,950 | $1.50 | 24d | 1 | 0.55mi |
| 2079 Honeysuckle Ln SW Atlanta, GA | 3.0 | 2.0 | 1500 | $1,900 | $1.27 | 24d | 1 | 0.57mi |
| 1295 Westmont Rd SW Atlanta, GA | 2.0 | 1.0 | 910 | $1,500 | $1.65 | 24d | 1 | 0.64mi |
| 1255 Westmont Rd SW Atlanta, GA | 3.0 | 2.0 | 1500 | $1,695 | $1.13 | 24d | 1 | 0.67mi |
| 1717 Centra Villa Dr SW Atlanta, GA | 1.0–3.0 | 1.0–2.0 | 1033 | $1,550 | $1.50 | 24d | 1 | 0.68mi |
| 1443 Venetian Dr SW Atlanta, GA | 3.0 | 1.0 | 1139 | $1,395 | $1.22 | 24d | 1 | 0.71mi |
| 1246 Westmont Rd SW Atlanta, GA | 3.0 | 1.0 | 1200 | $1,500 | $1.25 | 3d | 1 | 0.71mi |
| 1804 Idlewood Dr Unit 1 Atlanta, GA | 2.0 | 1.0 | 923 | $1,025 | $1.11 | 17d | 1 | 0.72mi |
| 1402 Bayrose Cir East Point, GA | 2.0 | 2.5 | 1404 | $1,595 | $1.14 | 24d | 1 | 0.73mi |
| 1006 Bayrose Cir Atlanta, GA | 2.0 | 2.5 | 1326 | $2,650 | $2.00 | 17d | 1 | 0.76mi |
| 1537 Orlando St SW Atlanta, GA | 2.0 | 1.0 | 1068 | $1,700 | $1.59 | 24d | 1 | 0.76mi |
| 2148 Bayrose Cir East Point, GA | 3.0 | 2.5 | 1370 | $1,800 | $1.31 | 5d | 1 | 0.77mi |
| 2042 Bayrose Cir Unit 42B Atlanta, GA | 3.0 | 2.5 | 1370 | $1,875 | $1.37 | 4d | 1 | 0.77mi |
| 1280 Elizabeth Ave SW Atlanta, GA | 3.0 | 1.0 | 1105 | $1,950 | $1.76 | 24d | 1 | 0.78mi |
| 1988 Plaza Ln SW Atlanta, GA | 1.0–3.0 | 1.0–2.0 | 990 | $1,299 | $1.31 | 10d | 13 | 0.79mi |
| 1988 Plaza Ln SW Atlanta, GA | 1.0–3.0 | 1.0–2.0 | 990 | $1,299 | $1.31 | 2d | 13 | 0.79mi |
| 1310 Kenilworth Dr SW Atlanta, GA | 3.0 | 2.0 | 1192 | $2,000 | $1.68 | 24d | 1 | 0.84mi |
| 1427 Lorenzo Dr SW Atlanta, GA | 3.0 | 2.0 | 1128 | $1,995 | $1.77 | 24d | 1 | 0.86mi |
| 1280 Kenilworth Dr SW Atlanta, GA | 3.0 | 2.0 | 1000 | $1,800 | $1.80 | 24d | 1 | 0.87mi |
| 1262 Kenilworth Dr SW Atlanta, GA | 4.0 | 2.0 | 1400 | $2,400 | $1.71 | 24d | 1 | 0.87mi |
| 1900 Stanton Rd East Point, GA | 2.0–3.0 | 1.0 | 890 | $1,500 | $1.69 | 15d | 11 | 0.88mi |
| 1867 Myrtle Dr SW Atlanta, GA | 3.0 | 2.5 | 1400 | $1,400 | $1.00 | 24d | 1 | 0.89mi |
| 1449 Lynford Dr SW Atlanta, GA | 3.0 | 1.0 | 1242 | $1,895 | $1.53 | 24d | 1 | 0.89mi |
| 1449 Lynford Dr SW Atlanta, GA | 3.0 | 1.0 | 1242 | $1,895 | $1.53 | 18d | 1 | 0.89mi |
| 1307 Lorenzo Dr SW Unit A Atlanta, GA | 3.0 | 2.0 | 1300 | $1,795 | $1.38 | 24d | 1 | 0.90mi |
| 1870 Myrtle Dr SW Atlanta, GA | 1.0–3.0 | 1.0–2.0 | 900 | $1,375 | $1.53 | 22d | 26 | 0.90mi |
| 1867 Myrtle Dr SW #24 Atlanta, GA | 3.0 | 2.5 | 1400 | $1,400 | $1.00 | 19d | 1 | 0.91mi |
| 1291 Lorenzo Dr SW Unit 1 Atlanta, GA | 3.0 | 1.0 | 1100 | $1,825 | $1.66 | 15d | 1 | 0.91mi |
| 1080 Westmont Rd SW Atlanta, GA | 3.0 | 2.0 | 1022 | $2,500 | $2.45 | 15d | 1 | 0.91mi |
| 1346 Lorenzo Dr SW Atlanta, GA | 3.0 | 2.0 | 1486 | $5,000 | $3.36 | 24d | 1 | 0.92mi |
| 2287 Boulevard Granada SW Atlanta, GA | 3.0 | 2.0 | 1496 | $2,050 | $1.37 | 22d | 1 | 0.93mi |
| 1932 Stanton Rd East Point, GA | 1.0–3.0 | 1.0–2.0 | 1045 | $1,599 | $1.53 | 44d | 1 | 0.93mi |
| 1550 Mayflower Ave SW Atlanta, GA | 4.0 | 2.5 | 1396 | $6,500 | $4.66 | 20d | 1 | 0.95mi |
Listing history 7 events
-
2025-12-20status Pending
-
2025-12-13historical Active Under Contract
-
2025-12-08price $105,000
-
2025-12-08$105 Active
-
1998-06-15soldstatus $65,000
-
1982-11-24soldstatus $41,000
-
1981-10-23soldstatus $32,500
ⓘ Source: listings_history table (triggers on properties + properties_extension) + one-shot
backfill from property_details.listing_events for pre-trigger history.
Tax reassessment forecast GA · Resets to sale price
- Current annual tax
- $840 · $70/mo
- Projected year-2 tax
- $966 · $80/mo
- Expected delta
- +$126/yr (+$10/mo · 15.0%)
ⓘ Screening estimate from a state-policy table — verify with the county assessor before closing.
Climate risk First Street
- Flood 1/10 Low FEMA zone X (unshaded) · 0% chance over 30 yrs
- Wildfire 1/10 Low
- Heat 5/10 Major 6 d/yr ≥104°F today · 16 d/yr by 30 yrs out
- Wind 5/10 Major 25% chance of damaging wind over 30 yrs
- Air quality 4/10 Moderate 4 unhealthy d/yr today · 6 by 30 yrs out
Nearby sold comps map
Loading sold comps map…
Walkable amenities ~0.75 mi
Loading nearby amenities…
Taxation est. · year 1
- Rental income
- $23,905
- − Mortgage interest
- −$5,882
- − Property taxes
- −$840
- − Insurance
- −$525
- − Repairs & maintenance
- −$1,912
- − Management
- −$1,912
- − Depreciation
- −$3,055
- Taxable income
- $9,779
- Est. tax owed @ 24.0%
- −$2,347
- After-tax cash flow
- $8,565/yr
For passive investors: Depreciation is non-cash, so a rental often shows a tax loss while cash-flowing — sheltering income. Rental losses are passive: they offset passive income freely, and up to $25,000/yr can offset ordinary (W-2) income if you actively participate and your MAGI is under $100k (phasing out to $0 by $150k); unused losses carry forward. On sale, claimed depreciation is recaptured at up to 25%, and gains may owe capital-gains tax (a 1031 exchange can defer both). Figures are a year-1 estimate at your 24.0% rate — not tax advice; consult a CPA.
Schools (NCES district)
- District
- Atlanta Public Schools
- NCES district ID
- 1300120
- Math proficiency
- 28% ▼ -6.00%
- Reading proficiency
- 35% ▼ -2.00%
- Median HH income
- $48,306
- Composite
- 27.27/100
- National rank
- #7006
- State rank
- #80 of 174 in GA
Livability — Atlanta
- Score
- 83/100
- State rank
- #6
- US rank
- #919
Category grades
Schools grade is shown separately in the Schools card above.
Census & demographics
- Census place
- Atlanta, GA
- County
- Fulton County · 1,094,430 people
- City population
- 629,525
- Metro
- Atlanta-Sandy Springs-Alpharetta, GA
- Population (ZIP)
- 34,953
- Household income
- $50,649
- Rent vs Own
- Severe rent burden
- 2825.0
Population outlook (Fulton County) Hauer SSP2
- Today (2025)
- 1,203,707 people
- By 2030
- 1,299,706 · +8.0%
- By 2040
- 1,488,256 · +23.6%
- By 2050
- 1,664,580 · +38.3%
- By 2075
- 2,036,072 · +69.2%
- By 2100
- 2,222,402 · +84.6%
Race, ethnicity, and origin ACS 2023
- Neighborhood character
- Predominantly Black (89%)
- Race & ethnicity
- Black 89% Hispanic / Latino 4% Two or more races 4% White 3%
- Common ancestry
- Hispanic 1%
- Foreign-born
- 5% · Canada
- Languages at home
- 93% English-only · Spanish 3% French/Haitian/Cajun 1% Korean 1%
Political lean MEDSL · Fulton
- 2024 margin
- Solid D (+44.9) · D 71.9% · R 27.0% · Other 1.1%
- 2008→2024 swing
- +9.8pp toward D · 2008: 35.0pp · 2024: 44.9pp
- All cycles
- 2024: D+44.9 2020: D+46.4 2016: D+42.1 2012: D+29.6 2008: D+35.0
Not yet ingested
- Civics
- —
Market trends
- HPI YoY
- ▼ -129.99%
- Current HPI
- 259.954
- Rent YoY
- ▼ -0.19%
- Metro
- Atlanta-Sandy Springs-Alpharetta, GA
- State GDP YoY
- ▲ 2.66%
- F500 in state
- 28
Industry mix (Fortune 500 HQ in GA)
| Industry | F500 HQs | Revenue |
|---|---|---|
| Paper / Packaging | 2 | $29B |
|
||
| Retail | 1 | $160B |
|
||
| Transportation / Logistics | 1 | $91B |
|
||
| Airlines | 1 | $62B |
|
||
| Consumer Goods | 1 | $47B |
|
||
| Utilities | 1 | $25B |
|
||
Price history
+223.1% since first listed7 events — show timeline
- 2025-12-20 Pending — FMLS
- 2025-12-13 Contingent — FMLS
- 2025-12-08 Price Changed $105,000 FMLS
- 2025-12-08 Listed $105 FMLS
- 1998-06-15 Sold (Public Records) $65,000 Public Records
- 1982-11-24 Sold (Public Records) $41,000 Public Records
- 1981-10-23 Sold (Public Records) $32,500 Public Records
Property tax history
+0.7%/yrLatest (2025): $840 · -46.5% YoY. Source: county tax records.
Cash-flow waterfall
monthlySold comps — $/sqft
last 12 mo · ≤1 miLoading sold comps…