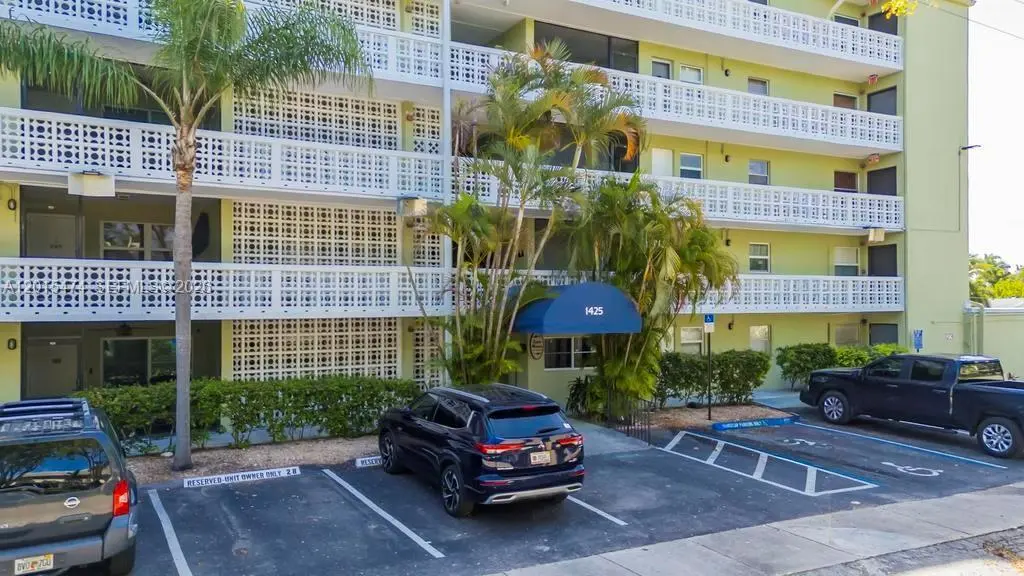
1425 Arthur St Unit 103A · Hollywood, FL
Flood risk 8/10 · Major
- FEMA flood zone
- AE
- Chance of flooding over 30 yrs
- 0.97%
- Est. flood insurance / yr
- $1,737 – $8,500
Fire risk 2/10 · Minimal
- Est. fire insurance / yr
- $947 – $1,759
Heat risk 10/10 · Severe
- Hot days now (above 104°F)
- 7 days/yr
- Hot days in 30 yrs
- 26 days/yr
Wind risk 10/10 · Severe
- Chance of severe wind over 30 yrs
- 99.0%
Air-quality risk 2/10 · Minimal
- Unhealthy air days now
- 1 days/yr
- Unhealthy air days in 30 yrs
- 2 days/yr
Risk factors via First Street. Map © Google.
Why this score? — see what drove the D- grade
The composite is a weighted blend of 9 inputs, each scored 0–100. Each bar is that input's sub-score; the figure is the points it added to the 100-point composite (weight × sub-score).
- 1% rule +9.4/10.0
- ARV discount +7.5/15.0
- Schools +4.1/10.0
- Condition / age +4.0/5.0
- Cash flow +3.9/30.0
- Livability +3.8/5.0
- Rent growth +2.6/5.0
- DSCR +0.0/10.0
- Appreciation +0.0/10.0
$109,900
🖨 Deal sheet (PDF) 📄 Offer letter ✓ Due diligence
Listing remarks
Charming and well-maintained 1-bedroom, 1-bath condo located in the heart of Hollywood! This bright and functional unit features a spacious layout, tile flooring throughout, and an open living and dining area perfect for comfortable South Florida living. The kitchen comes equipped with a microwave, electric range, and refrigerator. Washer and dryer on site for added convenience. Located in the desirable Santa Monica Condominium community, just minutes from Downtown Hollywood, Beaches, shopping, dining, and major highways. Ideal for primary residence, seasonal living, or investment opportunity. Low-maintenance lifestyle in a centrally located community with easy access to everything Broward
Key facts
- Electric range
- Washer and dryer
- Microwave
Tags
Property features AI
Finance
- Financial info: Pets allowed with size limit (more than 20 lbs allowed)
- HOA & community: Monthly association fee; Association amenities include clubhouse, laundry, pool, sauna, and elevator(s); Association covers amenities, common areas, cable TV, electricity, laundry, grounds and structure maintenance, pool(s), and reserve fund
Exterior
- Parking: Assigned parking; Guest parking available
- Security: Security/high-impact doors; Complex fenced
- Utilities: Cable available
- Home design: Attached property; 5-story building; Entry on level 1
- Construction: Block construction; Resale property
- Exterior features: Balcony; Open balcony/patio; Fence; Security/high-impact doors; Complex is fenced; Heated pool
Interior
- Kitchen: Electric range; Microwave; Refrigerator; Dishwasher
- Flooring: Tile
- Bathrooms: 1 full bathroom; 1 half bathroom
- Heating & cooling: Central heating (electric); Central air conditioning
- Interior features: First floor entry; Tub with shower; Impact glass windows; Blinds
- Laundry & utility: Washer and dryer included; Laundry in common area
Neighborhood map
What this means for you Summary
Snapshot
- This is a 1-bed/1.5-bath condo listed at $110k. Condition is rated good.
Deal economics
- At list price, monthly cash flow is $-741 ($-9k/yr) — negative.
- The deal already cash-flows at list — no discount required.
- Meets the 1% rule at list price ($2k rent vs $110k).
- Recommended offer: $107k (3.0% below list) — sets the bar for market timing.
Location & tenants
- Location reads 76/100 on livability (#232 in FL, #3,548 nationally) — a middle-class / working-renter tenant base. Strengths: commute A+, housing A+, crime B+; Watch: amenities D.
- Broward (suburban): math 42% / reading 53% proficiency, ranked #46 of 73 in FL (top 63%) — families likely to look elsewhere, expect single-tenant / working-renter base with shorter leases.
- Zoned schools: Nova Blanche Forman Elementary (math 35% / reading 55%, grade D-, #1,271 of 2,144 statewide, top 60%, 769 students, 72% FRL); Nova Middle School (math 44% / reading 53%, grade C-, #274 of 571 statewide, top 50%, 1,284 students, 68% FRL); South Broward High School (math 24% / reading 49%, grade F, #351 of 667 statewide, top 54%, 2,397 students, 59% FRL).
- Market conditions: Rents flat; 591 active listings in the ZIP; 40 comparable units currently listed for rent nearby; rentals at typical pace (median 15d on market — plan ~3-4 weeks tenant-placement turnaround); 2,111 units permitted in Broward County in 2024 (1,265 in 5+ unit buildings).
- This rent runs 34% of the median local income ($56k/yr) — at the standard rent-burdened threshold; future hikes will face affordability resistance.
Forward outlook
- Local home prices are declining (-3.0%/yr); year-one equity from $760 of loan paydown is wiped out by about $3k of value loss. Plan a longer hold.
- Broward County population projected at +34% by 2050 — long-run rental-demand tailwind backs the buy-and-hold thesis.
Negotiation context
- It's been on market 40 days — a 3% lower offer ($107k) is reasonable based on typical stale-listing flexibility.
Risks & watch-outs
- Watch-outs: flood insurance adds $427/mo; HOA is 51% of rent.
- Climate carrying-cost: in FEMA flood zone AE (mandatory federal flood insurance); severe wind risk, 99% chance of damaging wind over 30y; extreme-heat days projected 7→26/yr by 2055 (HVAC capex compounding) — expect insurance premiums to compound above CPI over the hold.
Questions for the listing agent
- What do current leases actually rent for vs. the listed asking? Can we see a recent rent roll and the last 12 months of T-12 income?
- It's been on market 40 days. Have you received any prior offers? Is the seller open to a 3% concession, seller financing, or rate buy-down credit?
- Built in 1967 — when were the roof, HVAC, electrical panel, plumbing, and water heater last replaced?
- What's the actual annual flood-insurance premium (NFIP or private), and is the property in a SFHA with mandatory coverage?
- What does the HOA fee cover, when was the last increase, and are there any pending special assessments or reserve-fund shortfalls?
- Any open or pending special assessments — roof, HVAC, plumbing, elevator, façade? What's the per-unit balance and payoff schedule, and is the seller paying it off at close or rolling it to the buyer?
- Is there a deadline driving the sale (1031 exchange, divorce, estate, relocation)? That informs how much negotiation room exists.
- The area grade is low — what's the realistic commute time and amenity access for the typical tenant pool here? Any planned neighborhood developments (good or bad) we should know about?
- What's the average days-on-market for RENTAL listings here right now (not sales)? A rising rental-DOM trend means longer vacancies and softer asking-rent achievability than the comps imply.
- What's the recent tenant-quality profile in this submarket — average credit score on applications, eviction rate, late-payment / NSF rate, and stable-employment percentage? A property-management company in the area should have these aggregated.
- How much new apartment / multifamily construction is in the pipeline within 1–3 miles? Heavy new supply (>2% of stock underway) typically softens rents 12–24 months out; light construction supports rent growth.
Investment metrics
- 1% rule
- 1.44% ✓
- Cap rate
- 2.86%
- Cash-on-cash
- -12.25%
- DSCR
- 0.45
- GRM
- 5.8
CMA / ARV
No comps found within radius.
Projected returns pro-forma
-3.0% appreciation · 0.43% rent growth · sell at horizon
- IRR
- -96.8%
- Equity multiple
- -1.22×
- Total profit
- $-68,192
- Equity at exit
- $16,386
- IRR
- —
- Equity multiple
- -3.31×
- Total profit
- $-132,505
- Equity at exit
- $9,502
Cash invested: $30,772 (down + closing). Projections, not guarantees.
Landlord ↔ Tenant lean methodology
- Overall (STATE)
- 87 Strongly Landlord-Friendly
- State Florida
- 87 Strongly Landlord-Friendly · R+3
- County
- — inherits STATE
- City
- — inherits STATE
ZIP-level market 33020
- Rents YoY
- 0.4%
- Active inventory
- 591
- Price-to-rent
- 5.8×
Monthly cashflow live
- Estimated rent
- $1,583 high interval (Pro) →
- Mortgage (P&I)
- −$576
- Tax est. 1.5%
- −$137 /mo · $1,648/yr
- Insurance
- −$46
- Flood insurance flood zone
- −$427 /mo · $5,118/yr
- HOA est. from 6 same-building comps
- −$805
- Vacancy / Maint / Mgmt
- −$332
- Net cashflow
- $-741
Break-even live
Sensitivity live
| Price | -10% $-665 | -5% $-703 | +0% $-741 | +5% $-779 | +10% $-817 |
|---|---|---|---|---|---|
| Rent | -10% $-866 | -5% $-803 | +0% $-741 | +5% $-678 | +10% $-616 |
| Rate | -1.0pp $-685 | -0.5pp $-713 | base $-741 | +0.5pp $-769 | +1.0pp $-798 |
UW: 25.0% down · 7.5% · 30yr · 1.5% tax · 5.0% vac · 8.0% maint · 8.0% mgmt
Financing live
Cash to close
- Down payment
- $27,475
- Closing costs
- $3,297
- Reserves months
- —
- Total cash needed
- —
Loan-product check · same deal, 3 products live
Conventional
25% down · 7.5% · 30yr
- Down + closing
- —
- Monthly P&I
- —
- Monthly cashflow
- —
- DSCR
- —
- Eligible?
- —
Personal DTI + credit; lowest rate.
DSCR
20% down · 8.5% · 30yr
- Down + closing
- —
- Monthly P&I
- —
- Monthly cashflow
- —
- DSCR
- —
- Eligible?
- —
No personal income docs; deal must DSCR.
Hard money
10% down · 12.0% · 12mo
- Down + closing
- —
- Monthly P&I
- —
- Monthly cashflow
- —
- DSCR
- —
- Eligible?
- —
Short-term bridge; refi at stabilization.
Rent comps 40 comps
| Address | Beds | Baths | Sqft | Rent | $/sqft | DOM | Units | Dist |
|---|---|---|---|---|---|---|---|---|
| 1425 Arthur St Unit 414B Hollywood, FL | 1.0 | 1.5 | 597 | $1,690 | $2.83 | 0d | 1 | 0.04mi |
| 1520 McKinley St Unit 107E Hollywood, FL | 1.0 | 1.5 | 665 | $1,700 | $2.56 | 19d | 1 | 0.14mi |
| 1533 Cleveland St Hollywood, FL | 1.0 | 1.0 | 512 | $1,200 | $2.34 | 26d | 1 | 0.19mi |
| 1560 McKinley St Unit 115w Hollywood, FL | 1.0 | 1.5 | 665 | $1,500 | $2.26 | 5d | 1 | 0.19mi |
| 1301 N 12th Ct Hollywood, FL | 1.0 | 1.0 | 465 | $1,588 | $3.41 | 15d | 2 | 0.28mi |
| 1301 N 12th Ct Unit 12A Hollywood, FL | 1.0 | 1.0 | 450 | $1,475 | $3.28 | 26d | 1 | 0.29mi |
| 1455 N 12th Ct Unit 6B Hollywood, FL | 1.0 | 1.0 | 580 | $1,395 | $2.41 | 13d | 1 | 0.32mi |
| 1551 N 12th Ct Unit 10B Hollywood, FL | 1.0 | 1.0 | 620 | $1,500 | $2.42 | 17d | 1 | 0.37mi |
| 1710 McKinley St #5 Hollywood, FL | 1.0 | 1.0 | 573 | $1,450 | $2.53 | 21d | 1 | 0.37mi |
| 1710 McKinley St #5 Hollywood, FL | 1.0 | 1.0 | 573 | $1,400 | $2.44 | 26d | 1 | 0.37mi |
| 1815 McKinley St Unit 9 Hollywood, FL | 2.0 | 1.0 | 650 | $1,750 | $2.69 | 19d | 1 | 0.50mi |
| 1816 Taft St Unit 8 Hollywood, FL | 1.0 | 1.0 | 500 | $1,399 | $2.80 | 5d | 1 | 0.53mi |
| 1610 Liberty St #1 Hollywood, FL | 1.0 | 1.0 | 750 | $1,550 | $2.07 | 17d | 1 | 0.61mi |
| 1610 Liberty St #1 Hollywood, FL | 1.0 | 1.0 | 750 | $1,550 | $2.07 | 4d | 1 | 0.61mi |
| 1610 Liberty St Unit 7 Hollywood, FL | 1.0 | 1.0 | 750 | $1,525 | $2.03 | 26d | 1 | 0.61mi |
| 1927 Cleveland St Unit 1542853P Hollywood, FL | — | 1.0 | 570 | $2,796 | $4.91 | 1d | 1 | 0.64mi |
| 1723 Liberty St #6 Hollywood, FL | — | 1.0 | 500 | $1,200 | $2.40 | 7d | 1 | 0.69mi |
| 1723 Liberty St #6 Hollywood, FL | — | 1.0 | 500 | $1,200 | $2.40 | 13d | 1 | 0.69mi |
| 1723 Liberty St Unit 7 Hollywood, FL | 1.0 | 1.0 | 600 | $1,500 | $2.50 | 26d | 1 | 0.69mi |
| 1723 Liberty St Unit 7 Hollywood, FL | 1.0 | 1.0 | 600 | $1,400 | $2.33 | 4d | 1 | 0.69mi |
| 1723 Liberty St Unit 5 Hollywood, FL | 1.0 | 1.0 | 650 | $1,500 | $2.31 | 7d | 1 | 0.69mi |
| 1723 Liberty St Unit 5 Hollywood, FL | 1.0 | 1.0 | 650 | $1,500 | $2.31 | 13d | 1 | 0.69mi |
| 1944 Taft St Unit 2 Hollywood, FL | 2.0 | 2.0 | 750 | $1,800 | $2.40 | 10d | 1 | 0.70mi |
| 1727 Liberty St Hollywood, FL | 1.0–2.0 | 1.0 | 570 | $1,599 | $2.81 | 24d | 2 | 0.71mi |
| 1727 Liberty St Hollywood, FL | 1.0 | 1.0 | 570 | $1,587 | $2.78 | 0d | 2 | 0.71mi |
| 1727 Liberty St Hollywood, FL | 1.0 | 1.0 | 285 | $1,587 | $5.56 | 0d | 2 | 0.71mi |
| 1947 Taft St Unit 0 Hollywood, FL | 2.0 | 2.0 | 650 | $1,900 | $2.92 | 26d | 1 | 0.72mi |
| 1916 Coolidge St Unit 1 Hollywood, FL | — | 1.0 | 550 | $1,250 | $2.27 | 26d | 1 | 0.75mi |
| 1776 Polk St Hollywood, FL | 1.0–2.0 | 1.0–2.0 | 954 | $2,843 | $2.98 | 17d | 25 | 0.78mi |
| 2118 N 19th Ave Unit 1-4 Hollywood, FL | 2.0 | 1.0 | 650 | $1,690 | $2.60 | 5d | 1 | 0.78mi |
| 311 E Sheridan St Dania, FL | 1.0–2.0 | 1.0–2.0 | 861 | $2,097 | $2.44 | 5d | 6 | 0.80mi |
| 2342 N Federal Hwy Hollywood, FL | — | 1.0 | 440 | $1,250 | $2.84 | 7d | 1 | 0.80mi |
| 2342 N Federal Hwy Unit 9 Hollywood, FL | — | 1.0 | 440 | $1,250 | $2.84 | 6d | 1 | 0.80mi |
| 1450 SE 3rd Ave #202 Dania, FL | 1.0 | 1.0 | 700 | $2,000 | $2.86 | 5d | 1 | 0.82mi |
| 1826 Sherman St #16 Hollywood, FL | 1.0 | 1.0 | 524 | $1,550 | $2.96 | 26d | 1 | 0.83mi |
| 1826 Sherman St Unit 9 Hollywood, FL | 1.0 | 1.0 | 524 | $1,350 | $2.58 | 23d | 1 | 0.83mi |
| 1826 Sherman St Unit 11 Hollywood, FL | 1.0 | 1.0 | 524 | $1,400 | $2.67 | 26d | 1 | 0.83mi |
| 1826 Sherman St Unit 15 Hollywood, FL | 1.0 | 1.0 | 524 | $1,350 | $2.58 | 26d | 1 | 0.83mi |
| 1341 SE 3rd Ave Dania, FL | 1.0 | 1.0 | 700 | $1,975 | $2.82 | 5d | 2 | 0.84mi |
| 1930 Thomas St Unit 1930 Hollywood, FL | 1.0 | 1.0 | 600 | $1,450 | $2.42 | 26d | 1 | 0.86mi |
HOA detail condo
- Monthly dues
- $0 · $0/yr
- Likely covers
- electric
- Assessments
- None detected in remarks — confirm with the listing agent.
Listing history 15 events
-
2026-06-21days on market $109,900 Active 40 DOM
-
2026-06-18days on market $109,900 Active 37 DOM
-
2026-06-17days on market $109,900 Active 36 DOM
-
2026-06-16days on market $109,900 Active 35 DOM
-
2026-06-15days on market $109,900 Active 34 DOM
-
2026-06-13days on market $109,900 Active 32 DOM
-
2026-06-09days on market $109,900 Active 28 DOM
-
2026-06-08days on market $109,900 Active 27 DOM
-
2026-06-07days on market $109,900 Active 26 DOM
-
2026-06-04pricedays on market $109,900 Active 23 DOM
-
2026-06-03days on market $120,000 Active 22 DOM
-
2026-06-02days on market $120,000 Active 21 DOM
-
2026-06-01days on market $120,000 Active 20 DOM
-
2026-05-31days on market $120,000 Active 19 DOM
-
2026-05-12$120,000 Active
ⓘ Source: listings_history table (triggers on properties + properties_extension) + one-shot
backfill from property_details.listing_events for pre-trigger history.
Climate risk First Street
- Flood 8/10 Severe FEMA zone AE · 97% chance over 30 yrs
- Wildfire 2/10 Low
- Heat 10/10 Extreme 7 d/yr ≥104°F today · 26 d/yr by 30 yrs out
- Wind 10/10 Extreme 99% chance of damaging wind over 30 yrs
- Air quality 2/10 Low 1 unhealthy d/yr today · 2 by 30 yrs out
Nearby sold comps map
Loading sold comps map…
Walkable amenities ~0.75 mi
Loading nearby amenities…
Taxation est. · year 1
- Rental income
- $18,993
- − Mortgage interest
- −$6,156
- − Property taxes
- −$1,648
- − Insurance
- −$5,668
- − Repairs & maintenance
- −$1,519
- − Management
- −$1,519
- − HOA
- −$9,660
- − Depreciation
- −$3,197
- Taxable loss
- −$10,376
- Est. tax savings @ 24.0%
- +$2,490
- After-tax cash flow
- $-6,398/yr
For passive investors: Depreciation is non-cash, so a rental often shows a tax loss while cash-flowing — sheltering income. Rental losses are passive: they offset passive income freely, and up to $25,000/yr can offset ordinary (W-2) income if you actively participate and your MAGI is under $100k (phasing out to $0 by $150k); unused losses carry forward. On sale, claimed depreciation is recaptured at up to 25%, and gains may owe capital-gains tax (a 1031 exchange can defer both). Figures are a year-1 estimate at your 24.0% rate — not tax advice; consult a CPA.
Condition & rehab AI · 27 photos
This charming and well-maintained 1-bedroom condo in Hollywood is ready for immediate occupancy with minimal cosmetic updates needed.
Value-add opportunities
- Both Paint exterior walls — Enhances curb appeal and resale value.
- Both Clean gutters — Improves drainage and prevents water damage
Renovation cost estimate screening
Value-add ROI direction
- Both Paint exterior walls — Enhances curb appeal and resale value. ↑
- Both Clean gutters — Improves drainage and prevents water damage ↑
ⓘ Cost ranges are severity-bucket heuristics (US national rule-of-thumb). Get contractor quotes + a written scope before underwriting a rehab budget.
Schools (NCES district)
- District
- Broward
- NCES district ID
- 1200180
- Math proficiency
- 42% ▼ -18.00%
- Reading proficiency
- 53% ▼ -5.00%
- Median HH income
- $52,139
- Composite
- 40.88/100
- National rank
- #3621
- State rank
- #46 of 73 in FL
Livability — Hollywood
- Score
- 76/100
- State rank
- #232
- US rank
- #3548
Category grades
Schools grade is shown separately in the Schools card above.
Census & demographics
- Census place
- Hollywood, FL
- County
- Broward County · 1,963,430 people
- City population
- 109,079
- Metro
- Miami-Fort Lauderdale-Pompano Beach, FL
- Population (ZIP)
- 46,322
- Household income
- $56,473
- Rent vs Own
- Severe rent burden
- 3948.0
Population outlook (Broward County) Hauer SSP2
- Today (2025)
- 2,207,033 people
- By 2030
- 2,360,704 · +7.0%
- By 2040
- 2,661,208 · +20.6%
- By 2050
- 2,946,698 · +33.5%
- By 2075
- 3,602,273 · +63.2%
- By 2100
- 3,970,984 · +79.9%
Race, ethnicity, and origin ACS 2023
- Neighborhood character
- Diverse neighborhood (Simpson 0.68)
- Race & ethnicity
- Hispanic / Latino 43% Two or more races 31% White 28% Black 24% Asian 1%
- Hispanic origin (detail)
- Mexican 1% Puerto Rican 4% Cuban 9% Dominican 3% Salvadoran 3%
- Common ancestry
- Hispanic 5% Lithuanian 2% Scotch-Irish 1%
- Foreign-born
- 41% · Canada, Jamaica, Dominican Republic
- Languages at home
- 48% English-only · Spanish 38% French/Haitian/Cajun 6% Russian/Polish/Slavic 2%
Political lean MEDSL · Broward
- 2024 margin
- D (+17.0) · D 58.0% · R 41.0%
- 2008→2024 swing
- -17.8pp toward R · 2008: 34.7pp · 2024: 17.0pp
- All cycles
- 2024: D+17.0 2020: D+29.8 2016: D+35.0 2012: D+34.9 2008: D+34.7
Not yet ingested
- Civics
- —
Market trends
- HPI YoY
- ▼ -406.34%
- Current HPI
- 524.7664
- Rent YoY
- ▲ 0.43%
- Metro
- Miami-Fort Lauderdale-Pompano Beach, FL
- State GDP YoY
- ▲ 3.28%
- F500 in state
- 36
Industry mix (Fortune 500 HQ in FL)
| Industry | F500 HQs | Revenue |
|---|---|---|
| Industrial Technology | 2 | $29B |
|
||
| Insurance | 2 | $17B |
|
||
| Retail | 1 | $60B |
|
||
| Technology Distribution | 1 | $58B |
|
||
| Homebuilding | 1 | $35B |
|
||
| Technology Manufacturing | 1 | $35B |
|
||
Price history
1 event — show timeline
- 2026-05-12 Listed $120,000 MARMLS
Cash-flow waterfall
monthlySold comps — $/sqft
last 12 mo · ≤1 miLoading sold comps…