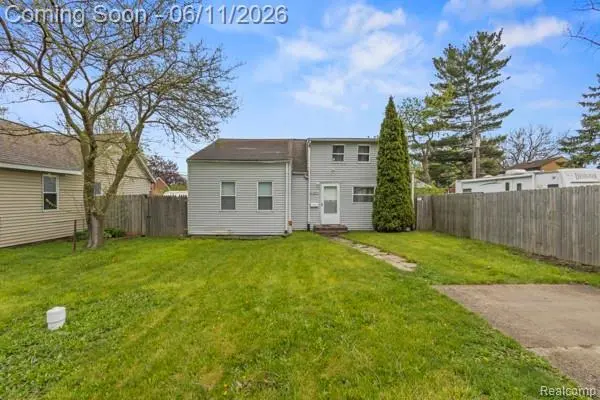
25884 Leach St · Roseville, MI
Flood risk 1/10 · Minimal
- FEMA flood zone
- X (unshaded)
- Chance of flooding over 30 yrs
- 0.0%
- Est. flood insurance / yr
- $473 – $860
Fire risk 1/10 · Minimal
- Est. fire insurance / yr
- $784 – $1,456
Heat risk 3/10 · Minor
- Hot days now (above 96°F)
- 7 days/yr
- Hot days in 30 yrs
- 15 days/yr
Wind risk 1/10 · Minimal
- Chance of severe wind over 30 yrs
- —
Air-quality risk 3/10 · Minor
- Unhealthy air days now
- 3 days/yr
- Unhealthy air days in 30 yrs
- 4 days/yr
Risk factors via First Street. Map © Google.
Why this score? — see what drove the B- grade
The composite is a weighted blend of 9 inputs, each scored 0–100. Each bar is that input's sub-score; the figure is the points it added to the 100-point composite (weight × sub-score).
- Cash flow +24.7/30.0
- ARV discount +15.0/15.0
- DSCR +8.0/10.0
- 1% rule +7.5/10.0
- Livability +3.6/5.0
- Rent growth +2.6/5.0
- Condition / age +2.5/5.0
- Schools +1.5/10.0
- Appreciation +0.0/10.0
$124,900
🖨 Deal sheet 📄 Offer letter ✓ Due diligence
Listing remarks
Welcome to this updated 3-bedroom, 1-bath home in the heart of Roseville! This home offers comfort and convenience at an affordable price. The bright living area, functional kitchen, and versatile main-floor bedroom provide a practical layout for a variety of lifestyles. Located in a quiet, established neighborhood close to schools, shopping, dining, and major roadways. Whether you're a first-time buyer, investor, or looking to downsize, this home presents a great opportunity. Property is being sold as-is. Schedule your showing today!
Key facts
- 4,792 sq ft lot
- Built 1930
- Listed 7 days
Property features AI
Exterior
- Utilities: Public water at street; Natural gas; Public utilities for heating
- Home design: Residential 1 1/2-story home; Built in 1930; Entry-level main living areas
- Construction: Slab foundation
- Exterior features: Aluminum exterior construction; Paved street frontage; Frontage of about 40 feet
Interior
- Kitchen: Kitchen on entry level (19 x 9)
- Bedrooms: Bedroom 1 on entry level (11 x 13); Bedroom 2 on second level (11 x 13); Bedroom 3 on second level (approx. 10 wide)
- Bathrooms: One full bathroom on entry level
- Heating & cooling: Forced air heating; Natural gas fuel
- Interior features: Six total rooms; Living room (11 x 19) on entry level
Neighborhood map
What this means for you Summary
Snapshot
- This is a 3-bed/1.0-bath single-family listed at $125k.
Deal economics
- At list price, monthly cash flow is $262 ($3k/yr) — positive.
- The deal already cash-flows at list — no discount required.
- Meets the 1% rule at list price ($2k rent vs $125k).
- Cap rate 8.8% vs local median 6.0% in Roseville — top-decile yield for the area; either an underpriced asset or a hidden risk that comps aren't pricing in. Stress-test before assuming the spread holds.
Location & tenants
- Location reads 72/100 on livability (#258 in MI) — a middle-class / working-renter tenant base. Strengths: commute A+, cost of living A+, housing A+; Watch: health & safety D+, employment D, schools F.
- Roseville Community Schools (suburban): math 11% / reading 24% proficiency, ranked #483 of 540 in MI (top 89%) — low school quality limits family demand, transient renter base, plan for 1-2y turnover; 60% free/reduced lunch — lower-income household profile, screen leases tightly.
- Market conditions: Rents flat; 265 active listings in the ZIP; 25 comparable units currently listed for rent nearby; rentals at typical pace (median 22d on market — plan ~3-4 weeks tenant-placement turnaround); 1,321 units permitted in Macomb County in 2024 (86 in 5+ unit buildings).
- This rent runs 30% of the median local income ($62k/yr) — at the standard rent-burdened threshold; future hikes will face affordability resistance.
Forward outlook
- Local home prices are declining (-3.0%/yr); year-one equity from $864 of loan paydown is wiped out by about $4k of value loss. Plan a longer hold.
- Macomb County population projected at +9% by 2050 — modest demand growth; plan on rents tracking national, not racing it.
Negotiation context
- Only 8 days on market — expect competitive offers; lowballing is unlikely to land.
- 11 sale attempts since 23y ago; this cycle's ask has dropped $14k (10%) from the opening price — seller is motivated, your offer sets the floor, not the list.
Risks & watch-outs
- Watch-outs: property tax is 2.6% of price; built in 1930 — expect roof / HVAC / electrical / plumbing capex.
Questions for the listing agent
- Built in 1930 — when were the roof, HVAC, electrical panel, plumbing, and water heater last replaced?
- Property tax is high relative to price — has the assessment been appealed recently, and will the sale trigger a re-assessment?
- Is there a deadline driving the sale (1031 exchange, divorce, estate, relocation)? That informs how much negotiation room exists.
- Schools are F-rated, which usually means shorter tenancies and higher turnover. Who's the typical renter profile here, and what's been the actual vacancy rate?
- Crime grade is F in this area — have there been break-ins, vandalism, or insurance claims at this property in the last 3 years? What carrier currently insures it and at what premium?
- What's the average days-on-market for RENTAL listings here right now (not sales)? A rising rental-DOM trend means longer vacancies and softer asking-rent achievability than the comps imply.
- What's the recent tenant-quality profile in this submarket — average credit score on applications, eviction rate, late-payment / NSF rate, and stable-employment percentage? A property-management company in the area should have these aggregated.
- How much new for-sale + rental construction is in the pipeline within 1–3 miles? Heavy new supply typically softens prices + rents 12–24 months out; constrained supply supports both.
Investment metrics
- 1% rule
- 1.25% ✓
- Cap rate
- 8.81%
- Cash-on-cash
- 8.98%
- DSCR
- 1.40
- GRM
- 6.6
CMA / ARV
- ARV (on-the-fly)
- $157,680
- Comps found
- 12
Show comp detail 12 sales within ~0.75 mi
| Address | Dist | Beds/Ba | Sqft | Sold | Price | $/sf | Match |
|---|---|---|---|---|---|---|---|
| 25287 Leach St | 0.24mi | 2/1.0 (-1) | 1,072 (-1%) | 0mo | $108,500 | $101 | 82 |
| 15738 Frazho Rd | 0.24mi | 3/1.0 | 1,131 (+5%) | 1mo | $165,000 | $146 | 80 |
| 26234 Woodmont St | 0.40mi | 3/1.0 | 960 (-11%) | 1mo | $124,000 | $129 | 62 |
| 15010 Petrie St | 0.31mi | 3/1.0 | 936 (-13%) | 3mo | $180,000 | $192 | 60 |
| 26153 Nagel St | 0.30mi | 3/1.0 | 924 (-14%) | 2mo | $101,000 | $109 | 60 |
| 25263 Leach St | 0.26mi | 2/1.0 (-1) | 1,240 (+15%) | 1mo | $135,500 | $109 | 57 |
| 25245 Dodge St | 0.62mi | 3/1.0 | 1,176 (+9%) | 3mo | $185,000 | $157 | 54 |
| 26621 Kathy St | 0.49mi | 3/1.0 | 924 (-14%) | 0mo | $155,900 | $169 | 53 |
| 26710 Lehner St | 0.45mi | 3/1.0 | 924 (-14%) | 3mo | $180,000 | $195 | 52 |
| 25110 Ford St | 0.63mi | 3/2.0 | 1,190 (+10%) | 3mo | $99,500 | $84 | 48 |
| 27277 Leroy St | 0.71mi | 3/1.0 | 1,218 (+13%) | 3mo | $187,500 | $154 | 43 |
| 25151 Ford St | 0.57mi | 4/1.5 (+1) | 1,232 (+14%) | 3mo | $135,000 | $110 | 40 |
Match score weights: distance 35% · size 25% · config 20% · recency 20%. Top-matched comps best support the ARV.
Projected returns pro-forma
-3.0% appreciation · 0.39% rent growth · sell at horizon
- IRR
- -5.9%
- Equity multiple
- 0.79×
- Total profit
- $-7,477
- Equity at exit
- $18,623
- IRR
- -0.1%
- Equity multiple
- 0.99×
- Total profit
- $-268
- Equity at exit
- $10,799
Cash invested: $34,972 (down + closing). Projections, not guarantees.
Landlord ↔ Tenant lean methodology
- Overall (STATE)
- 62 Landlord-Friendly
- State Michigan
- 62 Landlord-Friendly · EVEN
- County
- — inherits STATE
- City
- — inherits STATE
ZIP-level market 48066
- Rents YoY
- 0.4%
- Active inventory
- 265
- Price-to-rent
- 6.6×
Monthly cashflow live
- Estimated rent
- $1,566 high interval (Pro) →
- Mortgage (P&I)
- −$655
- Tax from tax record
- −$268 /mo · $3,217/yr
- Insurance
- −$52
- HOA
- −$0
- Vacancy / Maint / Mgmt
- −$329
- Net cashflow
- $262
Break-even live
UW: 25.0% down · 7.5% · 30yr · 1.5% tax · 5.0% vac · 8.0% maint · 8.0% mgmt
Financing live
Cash to close
- Down payment
- $31,225
- Closing costs
- $3,747
- Reserves months
- —
- Total cash needed
- —
Loan-product check · same deal, 3 products live
Conventional
25% down · 7.5% · 30yr
- Down + closing
- —
- Monthly P&I
- —
- Monthly cashflow
- —
- DSCR
- —
- Eligible?
- —
Personal DTI + credit; lowest rate.
DSCR
20% down · 8.5% · 30yr
- Down + closing
- —
- Monthly P&I
- —
- Monthly cashflow
- —
- DSCR
- —
- Eligible?
- —
No personal income docs; deal must DSCR.
Hard money
10% down · 12.0% · 12mo
- Down + closing
- —
- Monthly P&I
- —
- Monthly cashflow
- —
- DSCR
- —
- Eligible?
- —
Short-term bridge; refi at stabilization.
Rent comps 25 comps
| Address | Beds | Baths | Sqft | Rent | $/sqft | DOM | Units | Dist |
|---|---|---|---|---|---|---|---|---|
| 26160 Regency Club Dr Warren, MI | 1.0–3.0 | 1.0–2.0 | 1011 | $1,998 | $1.98 | 2d | 15 | 0.31mi |
| 26153 Nagel St Roseville, MI | 3.0 | 1.0 | 924 | $1,500 | $1.62 | 15d | 1 | 0.32mi |
| 25184 Wiseman St Roseville, MI | 3.0 | 1.0 | 895 | $1,750 | $1.96 | 22d | 1 | 0.39mi |
| 25184 Wiseman St Roseville, MI | 3.0 | 1.0 | 1000 | $1,750 | $1.75 | 3d | 1 | 0.39mi |
| 25672 Lira Ln Warren, MI | 2.0 | 1.0 | 831 | $1,250 | $1.50 | 18d | 1 | 0.44mi |
| 26681 Clancy St Roseville, MI | 3.0 | 1.0 | 1300 | $1,800 | $1.38 | 22d | 1 | 0.45mi |
| 25202 Firwood Ave Warren, MI | 3.0 | 1.0 | 1100 | $1,350 | $1.23 | 24d | 1 | 0.45mi |
| 26711 Lehner St Roseville, MI | 3.0 | 1.0 | 960 | $1,575 | $1.64 | 24d | 1 | 0.46mi |
| 26536 Kathy St Roseville, MI | 3.0 | 1.0 | 1000 | $1,499 | $1.50 | 24d | 1 | 0.48mi |
| 25107 Rosenbusch Blvd Warren, MI | 3.0 | 1.0 | 903 | $1,523 | $1.69 | 15d | 1 | 0.48mi |
| 14926 E 10 Mile Rd Unit 1032312P Warren, MI | 2.0 | 1.0 | 1291 | $6,089 | $4.72 | 2d | 1 | 0.51mi |
| 26511 Grandmont St Roseville, MI | 3.0 | 1.0 | 960 | $1,495 | $1.56 | 4d | 1 | 0.52mi |
| 27241 Woodmont St Roseville, MI | 3.0 | 1.0 | 924 | $1,550 | $1.68 | 2d | 1 | 0.80mi |
| 16840 E Eleven Mile Rd Unit 104 Roseville, MI | 2.0 | 1.0 | 900 | $1,200 | $1.33 | 44d | 1 | 1.04mi |
| 16840 E Eleven Mile Rd Roseville, MI | 2.0 | 1.0 | 900 | $1,300 | $1.44 | 22d | 3 | 1.04mi |
| 16840 E Eleven Mile Rd Roseville, MI | 2.0 | 1.0 | 900 | $1,300 | $1.44 | 24d | 3 | 1.04mi |
| 16840 E 11 Mile Rd Unit 109 Roseville, MI | 2.0 | 1.0 | 900 | $1,400 | $1.56 | 44d | 1 | 1.04mi |
| 16840 E Eleven Mile Rd Unit 103 Roseville, MI | 2.0 | 1.0 | 900 | $1,250 | $1.39 | 44d | 1 | 1.04mi |
| 16944 E 11 Mile Rd Unit C2 Roseville, MI | 2.0 | 1.0 | 900 | $1,295 | $1.44 | 24d | 1 | 1.09mi |
| 13741 McKinley Ave Unit 1032320P Warren, MI | 2.0 | 1.0 | 839 | $5,023 | $5.99 | 2d | 1 | 1.12mi |
| 17639 Oakdale St Roseville, MI | 2.0 | 1.0 | 812 | $1,200 | $1.48 | 44d | 1 | 1.24mi |
| 26221 Pinehurst St Roseville, MI | 2.0 | 1.0 | 1000 | $1,200 | $1.20 | 2d | 1 | 1.36mi |
| 26251 Pinehurst St Unit 251d Roseville, MI | 2.0 | 1.0 | 1000 | $1,200 | $1.20 | 44d | 1 | 1.36mi |
| 28232 Floral St Unit 1032343P Roseville, MI | 3.0 | 1.0 | 1496 | $6,605 | $4.42 | 12d | 1 | 1.46mi |
| 17392 Tennyson St Roseville, MI | 3.0 | 1.0 | 900 | $1,649 | $1.83 | 2d | 1 | 1.50mi |
Listing history 7 events
-
2026-06-18days on market $124,900 Active 8 DOM
-
2026-06-17days on market $124,900 Active 7 DOM
-
2026-06-16days on market $124,900 Active 6 DOM
-
2026-06-15days on market $124,900 Active 5 DOM
-
2026-06-13statusdays on market $124,900 Active 3 DOM
-
2026-06-09remarks 540-char remark
-
2026-06-09$124,900 Coming Soon 1 DOM
ⓘ Source: listings_history table (triggers on properties + properties_extension) + one-shot
backfill from property_details.listing_events for pre-trigger history.
Tax reassessment forecast MI · Partial reset (capped growth)
- Current annual tax
- $3,217 · $268/mo
- Projected year-2 tax
- $3,217 · $268/mo
- Expected delta
- $0/yr ($0/mo · 0.0%)
ⓘ Screening estimate from a state-policy table — verify with the county assessor before closing.
Climate risk First Street
- Flood 1/10 Low FEMA zone X (unshaded) · 0% chance over 30 yrs
- Wildfire 1/10 Low
- Heat 3/10 Moderate 7 d/yr ≥96°F today · 15 d/yr by 30 yrs out
- Wind 1/10 Low
- Air quality 3/10 Moderate 3 unhealthy d/yr today · 4 by 30 yrs out
Nearby sold comps map
Loading sold comps map…
Walkable amenities ~0.75 mi
Loading nearby amenities…
Taxation est. · year 1
- Rental income
- $18,790
- − Mortgage interest
- −$6,996
- − Property taxes
- −$3,217
- − Insurance
- −$624
- − Repairs & maintenance
- −$1,503
- − Management
- −$1,503
- − Depreciation
- −$3,633
- Taxable income
- $1,312
- Est. tax owed @ 24.0%
- −$315
- After-tax cash flow
- $2,827/yr
For passive investors: Depreciation is non-cash, so a rental often shows a tax loss while cash-flowing — sheltering income. Rental losses are passive: they offset passive income freely, and up to $25,000/yr can offset ordinary (W-2) income if you actively participate and your MAGI is under $100k (phasing out to $0 by $150k); unused losses carry forward. On sale, claimed depreciation is recaptured at up to 25%, and gains may owe capital-gains tax (a 1031 exchange can defer both). Figures are a year-1 estimate at your 24.0% rate — not tax advice; consult a CPA.
Schools (NCES district)
- District
- Roseville Community Schools
- NCES district ID
- 2630210
- Math proficiency
- 11% ▼ -8.00%
- Reading proficiency
- 24% ▼ -7.00%
- Median HH income
- $41,590
- Composite
- 14.98/100
- National rank
- #9363
- State rank
- #483 of 540 in MI
Livability — Roseville
- Score
- 72/100
- State rank
- #258
- US rank
- #6400
Category grades
Schools grade is shown separately in the Schools card above.
Census & demographics
- Census place
- Roseville, MI
- County
- Macomb County · 638,552 people
- City population
- 47,123
- Metro
- Detroit-Warren-Dearborn, MI
- Population (ZIP)
- 47,123
- Household income
- $62,182
- Rent vs Own
- Severe rent burden
- 1712.0
Population outlook (Macomb County) Hauer SSP2
- Today (2025)
- 925,296 people
- By 2030
- 948,226 · +2.5%
- By 2040
- 983,961 · +6.3%
- By 2050
- 1,010,200 · +9.2%
- By 2075
- 1,076,222 · +16.3%
- By 2100
- 1,077,065 · +16.4%
Race, ethnicity, and origin ACS 2023
- Neighborhood character
- Predominantly White (65%)
- Race & ethnicity
- White 65% Black 23% Two or more races 7% Hispanic / Latino 4% Asian 2%
- Common ancestry
- Romanian 12% Lithuanian 4% Slovak 2%
- Foreign-born
- 5% · Canada
- Languages at home
- 93% English-only · Spanish 2% Russian/Polish/Slavic 1% Other Indo-European 1%
Political lean MEDSL · Macomb
- 2024 margin
- R (+13.7) · D 42.2% · R 55.9% · Other 1.9%
- 2008→2024 swing
- -22.3pp toward R · 2008: 8.6pp · 2024: -13.7pp
- All cycles
- 2024: R+13.7 2020: R+8.1 2016: R+11.6 2012: D+4.0 2008: D+8.6
Not yet ingested
- Civics
- —
Market trends
- HPI YoY
- ▼ -232.95%
- Current HPI
- 217.4171
- Rent YoY
- ▲ 0.39%
- Metro
- Detroit-Warren-Dearborn, MI
- State GDP YoY
- ▲ 1.37%
- F500 in state
- 28
Industry mix (Fortune 500 HQ in MI)
| Industry | F500 HQs | Revenue |
|---|---|---|
| Automotive Parts | 3 | $48B |
|
||
| Automotive | 2 | $372B |
|
||
| Chemicals | 1 | $45B |
|
||
| Automotive Retail | 1 | $29B |
|
||
| Healthcare / Medical Devices | 1 | $23B |
|
||
| Automotive Technology | 1 | $20B |
|
||
Price history
+197.4% since first listed44 events — show timeline
- 2026-06-08 Coming Soon $124,900 MiRealSource-MiMLS
- 2025-09-08 Listing Removed — MiRealSource-MiMLS
- 2025-09-08 Listing Removed — REALCOMP
- 2025-08-08 Listed $139,000 REALCOMP
- 2025-08-08 Listing Removed — MiRealSource-MiMLS
- 2025-08-08 Listing Removed — REALCOMP
- 2025-08-08 Listed $139,000 MiRealSource-MiMLS
- 2025-07-09 Relisted — MiRealSource-MiMLS
- 2025-07-09 Relisted — REALCOMP
- 2025-06-30 Contingent — MiRealSource-MiMLS
- 2025-06-30 Contingent — REALCOMP
- 2025-06-04 Price Changed $140,000 MiRealSource-MiMLS
- 2025-06-04 Price Changed $140,000 REALCOMP
- 2025-05-17 Price Changed $145,000 MiRealSource-MiMLS
- 2025-05-16 Price Changed $145,000 REALCOMP
- 2025-05-06 Listed $150,000 MiRealSource-MiMLS
- 2025-05-06 Listed $150,000 REALCOMP
- 2025-05-02 Coming Soon — MiRealSource-MiMLS
- 2023-03-22 Sold (MLS) $113,000 MiRealSource-MiMLS
- 2023-03-22 Sold (MLS) $113,000 REALCOMP
- 2023-03-08 Sold (Public Records) $113,000 Public Records
- 2023-01-15 Pending — MiRealSource-MiMLS
- 2023-01-15 Pending — REALCOMP
- 2022-12-13 Listed $113,900 MiRealSource-MiMLS
- 2022-12-13 Listed $113,900 REALCOMP
- 2018-10-29 Sold (MLS) $40,000 MiRealSource-MiMLS
- 2018-10-29 Sold (MLS) $40,000 REALCOMP
- 2018-10-19 Pending — REALCOMP
- 2018-09-02 Listing Removed — MiRealSource-MiMLS
- 2018-09-02 Listing Removed — REALCOMP
- 2018-06-27 Pending — MiRealSource-MiMLS
- 2018-06-27 Pending — REALCOMP
- 2018-04-25 Price Changed $55,000 MiRealSource-MiMLS
- 2018-04-25 Price Changed $55,000 REALCOMP
- 2018-03-08 Price Changed $65,000 MiRealSource-MiMLS
- 2018-03-07 Price Changed $65,000 REALCOMP
- 2017-11-28 Listed $75,000 MiRealSource-MiMLS
- 2017-11-28 Listed $75,000 REALCOMP
- 2003-05-21 Sold (Public Records) $96,000 Public Records
- 2003-04-10 Sold (MLS) $96,000 MiRealSource-MiMLS
- 2003-02-26 Listing Removed — MiRealSource-MiMLS
- 2003-01-16 Listed $89,800 MiRealSource-MiMLS
- 2000-07-19 Sold (Public Records) $82,000 Public Records
- 1998-10-27 Sold (Public Records) $42,000 Public Records
Property tax history
+9.2%/yrLatest (2025): $3,217 · +8.6% YoY. Source: county tax records.
Cash-flow waterfall
monthlySold comps — $/sqft
last 12 mo · ≤1 miLoading sold comps…