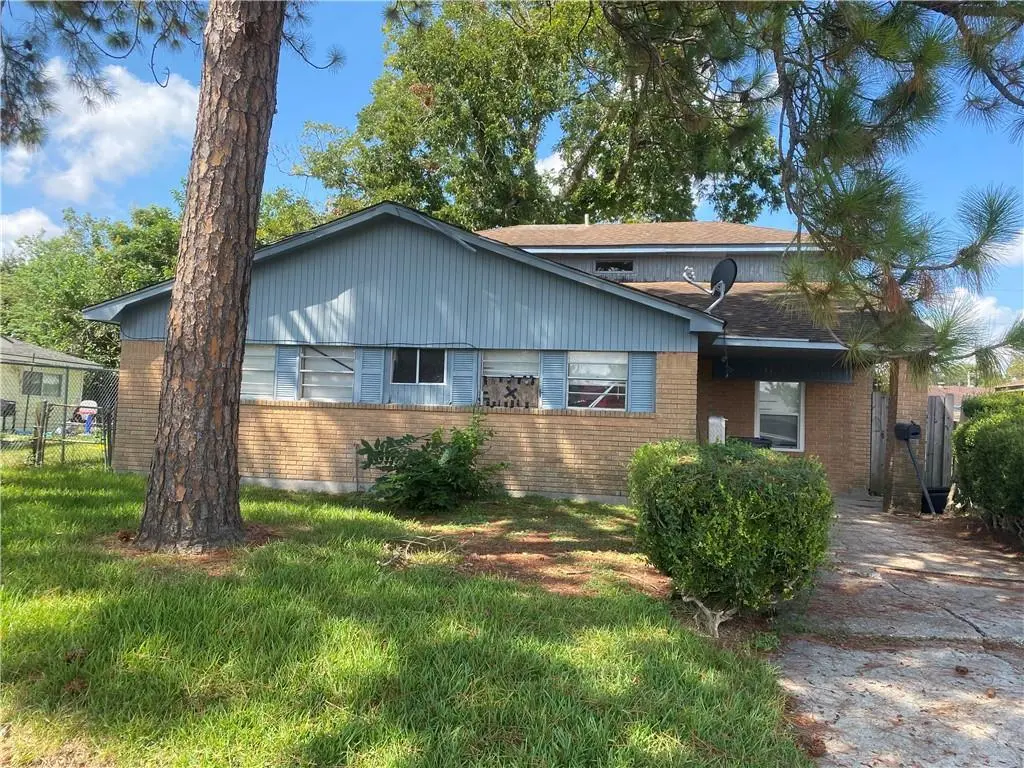
3511 Kent Dr · New Orleans, LA
Flood risk 8/10 · Major
- FEMA flood zone
- X
- Chance of flooding over 30 yrs
- 0.6%
- Est. flood insurance / yr
- $507 – $1,088
Fire risk 1/10 · Minimal
- Est. fire insurance / yr
- $1,269 – $2,357
Heat risk 10/10 · Severe
- Hot days now (above 108°F)
- 7 days/yr
- Hot days in 30 yrs
- 22 days/yr
Wind risk 10/10 · Severe
- Chance of severe wind over 30 yrs
- 99.0%
Air-quality risk 2/10 · Minimal
- Unhealthy air days now
- 2 days/yr
- Unhealthy air days in 30 yrs
- 2 days/yr
Risk factors via First Street. Map © Google.
Why this score? — see what drove the B- grade
The composite is a weighted blend of 9 inputs, each scored 0–100. Each bar is that input's sub-score; the figure is the points it added to the 100-point composite (weight × sub-score).
- Cash flow +30.0/30.0
- 1% rule +10.0/10.0
- DSCR +10.0/10.0
- ARV discount +7.5/15.0
- Livability +4.0/5.0
- Condition / age +2.5/5.0
- Schools +1.6/10.0
- Rent growth +0.2/5.0
- Appreciation +0.0/10.0
$99,000
🖨 Deal sheet 📄 Offer letter ✓ Due diligence
Listing remarks MLS
Attention All Investors: This Spacious property features 6 bedrooms , 2 full bathrooms and 1 half bath. Conveniently located, just minutes from Down Town, it offers excellent potential as a Short-Term Rental or Fix and Flip Don't miss this outstanding investment opportunity!
Key facts
- 6,298 sq ft lot
- Parking
- Built 1972
Neighborhood map
What this means for you Summary
Snapshot
- This is a 5-bed/1.5-bath single-family listed at $99k.
Deal economics
- At list price, monthly cash flow is $1k ($13k/yr) — positive.
- The deal already cash-flows at list — no discount required.
- Meets the 1% rule at list price ($2k rent vs $99k).
- Recommended offer: $87k (12.0% below list) — sets the bar for market timing.
- Cap rate 19.9% vs local median 4.4% in New Orleans — top-decile yield for the area; either an underpriced asset or a hidden risk that comps aren't pricing in. Stress-test before assuming the spread holds.
Location & tenants
- Location reads 81/100 on livability (#3 in LA, #1,383 nationally) — a professional / high-income tenant draw. Strengths: amenities A+, commute A+, health & safety A+; Watch: crime C-, employment D.
- Orleans Parish (urban): math 11% / reading 27% proficiency, ranked #69 of 98 in LA (top 70%) — low school quality limits family demand, transient renter base, plan for 1-2y turnover; 68% free/reduced lunch — lower-income household profile, screen leases tightly.
- Market conditions: Rents falling (-9.2%/yr); 274 active listings in the ZIP; 7 comparable units currently listed for rent nearby; rentals at typical pace (median 24d on market — plan ~3-4 weeks tenant-placement turnaround); 710 units permitted in Orleans Parish in 2024 (244 in 5+ unit buildings).
- At $2,368/mo this rent would consume 46% of the median local household income ($62k/yr) (locally 707% of renters already pay >50% of income on rent) — very limited rent-growth headroom before tenants either downsize or default.
Forward outlook
- Local home prices are declining (-3.0%/yr); year-one equity from $684 of loan paydown is wiped out by about $3k of value loss. Plan a longer hold.
- Orleans County population projected at +61% by 2050 — long-run rental-demand tailwind backs the buy-and-hold thesis.
- At projected returns (-3.0% appreciation + 0.0% rent growth), your $28k cash investment doubles in ~3 years — after that, you're playing with house money.
Negotiation context
- It's been on market 268 days — a 12% lower offer ($87k) is reasonable based on typical stale-listing flexibility.
- 5 sale attempts since 14y ago with the ask held roughly flat each time — persistent listings suggest the price (not the market) is what's stuck; bring a comps-based counter.
- Current owner paid $20k; list at $99k implies a 408% gain — meaningful room to come down on a strong offer.
Risks & watch-outs
- Watch-outs: flood insurance adds $66/mo.
- Climate carrying-cost: severe flood risk; severe wind risk, 99% chance of damaging wind over 30y; extreme-heat days projected 7→22/yr by 2055 (HVAC capex compounding) — expect insurance premiums to compound above CPI over the hold.
Questions for the listing agent
- It's been on market 268 days. Have you received any prior offers? Is the seller open to a 12% concession, seller financing, or rate buy-down credit?
- Built in 1972 — when were the roof, HVAC, electrical panel, plumbing, and water heater last replaced?
- What's the actual annual flood-insurance premium (NFIP or private), and is the property in a SFHA with mandatory coverage?
- Why hasn't it sold? Are there any deal-killer items the seller is aware of (foundation, flood, title, zoning, code violations)?
- Is there a deadline driving the sale (1031 exchange, divorce, estate, relocation)? That informs how much negotiation room exists.
- What's the average days-on-market for RENTAL listings here right now (not sales)? A rising rental-DOM trend means longer vacancies and softer asking-rent achievability than the comps imply.
- What's the recent tenant-quality profile in this submarket — average credit score on applications, eviction rate, late-payment / NSF rate, and stable-employment percentage? A property-management company in the area should have these aggregated.
- How much new for-sale + rental construction is in the pipeline within 1–3 miles? Heavy new supply typically softens prices + rents 12–24 months out; constrained supply supports both.
Investment metrics
- 1% rule
- 2.39% ✓
- Cap rate
- 19.89%
- Cash-on-cash
- 48.57%
- DSCR
- 3.16
- GRM
- 3.5
CMA / ARV
- ARV (median comp)
- $218,023
- List price
- $99,000
- Delta
- -54.59%
- Verdict
- UNDERPRICED
- Comps
- 7 within 1.0 mi
Show comp detail 10 sales within ~0.75 mi
| Address | Dist | Beds/Ba | Sqft | Sold | Price | $/sf | Match |
|---|---|---|---|---|---|---|---|
| 5858 Rhodes Ave | 0.74mi | 4/3.0 (-1) | 2,388 (-2%) | 6mo | $241,000 | $101 | 47 |
| 5901 Oxford Pl | 0.67mi | 4/2.5 (-1) | 2,476 (+2%) | 13mo | $309,750 | $125 | 45 |
| 6433 Brunswick Ct | 0.24mi | 5/2.5 | 2,086 (-14%) | 20mo | $85,000 | $41 | 44 |
| 5850 Brunswick Ct | 0.64mi | 4/2.0 (-1) | 2,389 (-2%) | 23mo | $381,000 | $159 | 41 |
| 3631 Rue Andree Dr | 0.73mi | 4/3.0 (-1) | 2,562 (+6%) | 7mo | $160,000 | $62 | 40 |
| 107 Neil Ave | 0.55mi | 4/2.0 (-1) | 2,722 (+12%) | 10mo | $60,000 | $22 | 39 |
| 5869 Brighton Pl | 0.74mi | 4/2.5 (-1) | 2,538 (+4%) | 16mo | $283,740 | $112 | 36 |
| 5936 Brighton Pl | 0.69mi | 4/3.0 (-1) | 2,141 (-12%) | 7mo | $269,000 | $126 | 31 |
| 3620 Rue Renee Ct | 0.66mi | 4/2.5 (-1) | 2,217 (-9%) | 18mo | $210,000 | $95 | 31 |
| 5892 Macarthur Blvd | 0.67mi | 4/2.5 (-1) | 2,100 (-14%) | 14mo | $115,000 | $55 | 25 |
Match score weights: distance 35% · size 25% · config 20% · recency 20%. Top-matched comps best support the ARV.
Projected returns pro-forma
-3.0% appreciation · 0.0% rent growth · sell at horizon
- IRR
- 39.2%
- Equity multiple
- 2.60×
- Total profit
- $44,359
- Equity at exit
- $14,761
- IRR
- 44.0%
- Equity multiple
- 4.57×
- Total profit
- $98,842
- Equity at exit
- $8,560
Cash invested: $27,720 (down + closing). Projections, not guarantees.
Landlord ↔ Tenant lean methodology
- Overall (STATE)
- 90 Strongly Landlord-Friendly
- State Louisiana
- 90 Strongly Landlord-Friendly · R+12
- County
- — inherits STATE
- City
- — inherits STATE
ZIP-level market 70131
- Home prices YoY
- -12.0%
- Rents YoY
- -9.2%
- Active inventory
- 274
- Price-to-rent
- 3.5×
Monthly cashflow live
- Estimated rent
- $2,368 high interval (Pro) →
- Mortgage (P&I)
- −$519
- Tax from tax record
- −$188 /mo · $2,261/yr
- Insurance
- −$41
- Flood insurance flood zone
- −$66 /mo · $798/yr
- HOA
- −$0
- Vacancy / Maint / Mgmt
- −$497
- Net cashflow
- $1,055
Break-even live
UW: 25.0% down · 7.5% · 30yr · 1.5% tax · 5.0% vac · 8.0% maint · 8.0% mgmt
Financing live
Cash to close
- Down payment
- $24,750
- Closing costs
- $2,970
- Reserves months
- —
- Total cash needed
- —
Loan-product check · same deal, 3 products live
Conventional
25% down · 7.5% · 30yr
- Down + closing
- —
- Monthly P&I
- —
- Monthly cashflow
- —
- DSCR
- —
- Eligible?
- —
Personal DTI + credit; lowest rate.
DSCR
20% down · 8.5% · 30yr
- Down + closing
- —
- Monthly P&I
- —
- Monthly cashflow
- —
- DSCR
- —
- Eligible?
- —
No personal income docs; deal must DSCR.
Hard money
10% down · 12.0% · 12mo
- Down + closing
- —
- Monthly P&I
- —
- Monthly cashflow
- —
- DSCR
- —
- Eligible?
- —
Short-term bridge; refi at stabilization.
Rent comps 7 comps
| Address | Beds | Baths | Sqft | Rent | $/sqft | DOM | Units | Dist |
|---|---|---|---|---|---|---|---|---|
| 3619 Pittari Pl New Orleans, LA | 4.0 | 2.0 | 2000 | $2,200 | $1.10 | 23d | 1 | 0.19mi |
| 3200 Lancaster St New Orleans, LA | 4.0 | 2.0 | 1678 | $2,200 | $1.31 | 23d | 1 | 0.34mi |
| 6021 Brighton Pl New Orleans, LA | 4.0 | 3.0 | 1840 | $3,100 | $1.68 | 16d | 1 | 0.61mi |
| 5801 Albany Ct New Orleans, LA | 4.0 | 2.5 | 2160 | $2,000 | $0.93 | 23d | 1 | 0.96mi |
| 2741 Chelsea Dr New Orleans, LA | 4.0 | 2.5 | 2382 | $2,500 | $1.05 | 16d | 1 | 1.03mi |
| 3738 Somerset Dr New Orleans, LA | 4.0 | 2.0 | 2247 | $3,000 | $1.34 | 14d | 1 | 1.17mi |
| 3751 Herald St New Orleans, LA | 4.0 | 2.0 | 1624 | $2,150 | $1.32 | 23d | 1 | 1.24mi |
Listing history 21 events
-
2026-06-18days on market $99,000 Active 268 DOM
-
2026-06-17days on market $99,000 Active 267 DOM
-
2026-06-16days on market $99,000 Active 266 DOM
-
2026-06-15days on market $99,000 Active 265 DOM
-
2026-06-13days on market $99,000 Active 263 DOM
-
2026-06-10days on market $99,000 Active 260 DOM
-
2026-06-09days on market $99,000 Active 259 DOM
-
2026-06-08days on market $99,000 Active 258 DOM
-
2026-06-07days on market $99,000 Active 257 DOM
-
2026-06-05days on market $99,000 Active 254 DOM
-
2026-06-03days on market $99,000 Active 253 DOM
-
2026-06-02days on market $99,000 Active 252 DOM
-
2026-06-01days on market $99,000 Active 251 DOM
-
2026-05-31days on market $99,000 Active 250 DOM
-
2025-09-23$99,000 Active 275-char remark
Show marketing remark (277 chars)
Attention All Investors: This Spacious property features 6 bedrooms , 2 full bathrooms and 1 half bath. Conveniently located, just minutes from Down Town, it offers excellent potential as a Short-Term Rental or Fix and Flip Don't miss this outstanding investment opportunity!
-
2025-09-23$99,000 Active 277-char remark
Show marketing remark (277 chars)
Attention All Investors: This Spacious property features 6 bedrooms , 2 full bathrooms and 1 half bath. Conveniently located, just minutes from Down Town, it offers excellent potential as a Short-Term Rental or Fix and Flip Don't miss this outstanding investment opportunity!
-
2025-09-23$99,000 Active
Show marketing remark (277 chars)
Attention All Investors: This Spacious property features 6 bedrooms , 2 full bathrooms and 1 half bath. Conveniently located, just minutes from Down Town, it offers excellent potential as a Short-Term Rental or Fix and Flip Don't miss this outstanding investment opportunity!
-
2013-07-24soldstatus $19,500
-
2012-12-20$29,900
-
2012-12-20$29,900
-
1987-02-13soldstatus $44,698
ⓘ Source: listings_history table (triggers on properties + properties_extension) + one-shot
backfill from property_details.listing_events for pre-trigger history.
Tax reassessment forecast LA · Resets to sale price
- Current annual tax
- $2,261 · $188/mo
- Projected year-2 tax
- $2,261 · $188/mo
- Expected delta
- $0/yr ($0/mo · 0.0%)
ⓘ Screening estimate from a state-policy table — verify with the county assessor before closing.
Climate risk First Street
- Flood 8/10 Severe FEMA zone X · 60% chance over 30 yrs
- Wildfire 1/10 Low
- Heat 10/10 Extreme 7 d/yr ≥108°F today · 22 d/yr by 30 yrs out
- Wind 10/10 Extreme 99% chance of damaging wind over 30 yrs
- Air quality 2/10 Low 2 unhealthy d/yr today · 2 by 30 yrs out
Nearby sold comps map
Loading sold comps map…
Walkable amenities ~0.75 mi
Loading nearby amenities…
Taxation est. · year 1
- Rental income
- $28,417
- − Mortgage interest
- −$5,546
- − Property taxes
- −$2,261
- − Insurance
- −$1,292
- − Repairs & maintenance
- −$2,273
- − Management
- −$2,273
- − Depreciation
- −$2,880
- Taxable income
- $11,891
- Est. tax owed @ 24.0%
- −$2,854
- After-tax cash flow
- $9,812/yr
For passive investors: Depreciation is non-cash, so a rental often shows a tax loss while cash-flowing — sheltering income. Rental losses are passive: they offset passive income freely, and up to $25,000/yr can offset ordinary (W-2) income if you actively participate and your MAGI is under $100k (phasing out to $0 by $150k); unused losses carry forward. On sale, claimed depreciation is recaptured at up to 25%, and gains may owe capital-gains tax (a 1031 exchange can defer both). Figures are a year-1 estimate at your 24.0% rate — not tax advice; consult a CPA.
Schools (NCES district)
- District
- Orleans Parish
- NCES district ID
- 2201170
- Math proficiency
- 11% ▼ -52.00%
- Reading proficiency
- 27% ▼ -46.00%
- Median HH income
- $37,011
- Composite
- 15.78/100
- National rank
- #9271
- State rank
- #69 of 98 in LA
Livability — New Orleans
- Score
- 81/100
- State rank
- #3
- US rank
- #1383
Category grades
Schools grade is shown separately in the Schools card above.
Census & demographics
- Census place
- New Orleans, LA
- County
- Orleans Parish · 338,817 people
- City population
- 338,817
- Metro
- New Orleans-Metairie, LA
- Population (ZIP)
- 25,151
- Household income
- $62,389
- Rent vs Own
- Severe rent burden
- 707.0
Population outlook (Orleans County) Hauer SSP2
- Today (2025)
- 513,025 people
- By 2030
- 575,781 · +12.2%
- By 2040
- 700,174 · +36.5%
- By 2050
- 826,541 · +61.1%
- By 2075
- 1,123,374 · +119.0%
- By 2100
- 1,355,609 · +164.2%
Race, ethnicity, and origin ACS 2023
- Neighborhood character
- Diverse neighborhood (Simpson 0.57)
- Race & ethnicity
- Black 62% White 20% Hispanic / Latino 11% Two or more races 6% Asian 4%
- Hispanic origin (detail)
- Mexican 2% Dominican 2%
- Common ancestry
- Lithuanian 4% Hispanic 1%
- Foreign-born
- 8% · Canada, Vietnam, China
- Languages at home
- 86% English-only · Spanish 9% Vietnamese 2% French/Haitian/Cajun 1%
Political lean MEDSL · Orleans
- 2024 margin
- Solid D (+67.0) · D 82.2% · R 15.2% · Other 2.7%
- 2008→2024 swing
- +6.7pp toward D · 2008: 60.3pp · 2024: 67.0pp
- All cycles
- 2024: D+67.0 2020: D+68.2 2016: D+66.2 2012: D+62.5 2008: D+60.3
Not yet ingested
- Civics
- —
Market trends
- HPI YoY
- ▼ -28.08%
- Current HPI
- 206.7552
- Rent YoY
- ▼ -9.23%
- Metro
- New Orleans-Metairie, LA
- State GDP YoY
- ▲ 3.29%
- F500 in state
- 10
Industry mix (Fortune 500 HQ in LA)
| Industry | F500 HQs | Revenue |
|---|---|---|
| Telecommunications | 2 | $23B |
|
||
| Utilities | 1 | $12B |
|
||
| Wholesale / Distribution | 1 | $5B |
|
||
| Advertising | 1 | $2B |
|
||
Price history
+121.5% since first listed7 events — show timeline
- 2025-09-23 Listed $99,000 AcadianaMLS
- 2025-09-23 Listed $99,000 GSREIN
- 2025-09-23 Listed $99,000 AcadianaMLS
- 2013-07-24 Sold (MLS) $19,500 GSREIN
- 2012-12-20 Listed $29,900 AcadianaMLS
- 2012-12-20 Listed $29,900 GSREIN
- 1987-02-13 Sold (Public Records) $44,698 Public Records
Property tax history
+2.1%/yrLatest (2026): $2,261 · +0.0% YoY. Source: county tax records.
Cash-flow waterfall
monthlySold comps — $/sqft
last 12 mo · ≤1 miLoading sold comps…