 Duplex
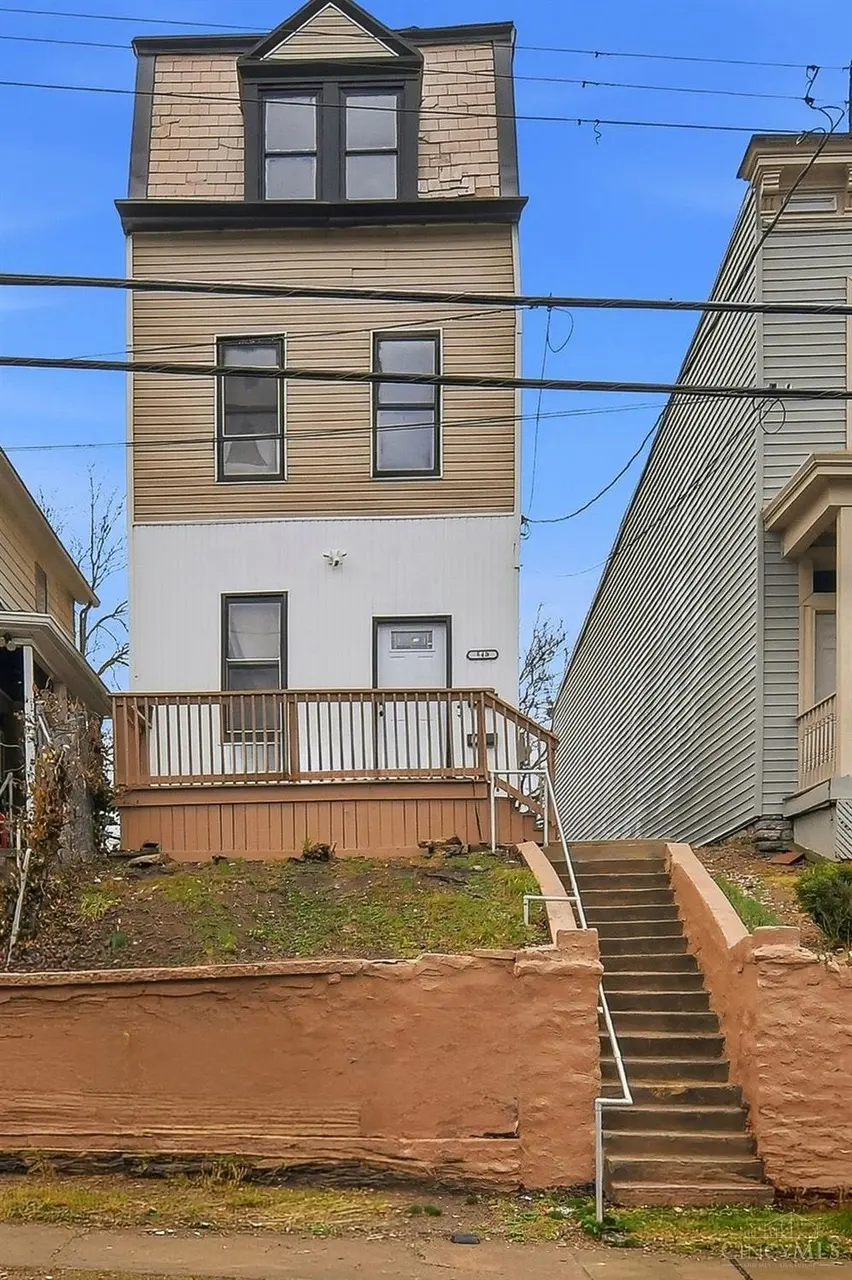
540 Grand Ave · Cincinnati, OH
Flood risk 1/10 · Minimal
- FEMA flood zone
- X (unshaded)
- Chance of flooding over 30 yrs
- 0.0%
- Est. flood insurance / yr
- $473 – $860
Fire risk 1/10 · Minimal
- Est. fire insurance / yr
- $713 – $1,323
Heat risk 4/10 · Minor
- Hot days now (above 102°F)
- 7 days/yr
- Hot days in 30 yrs
- 19 days/yr
Wind risk 2/10 · Minimal
- Chance of severe wind over 30 yrs
- 1.0%
Air-quality risk 3/10 · Minor
- Unhealthy air days now
- 3 days/yr
- Unhealthy air days in 30 yrs
- 5 days/yr
Risk factors via First Street. Map © Google.
Why this score? — see what drove the B- grade
The composite is a weighted blend of 9 inputs, each scored 0–100. Each bar is that input's sub-score; the figure is the points it added to the 100-point composite (weight × sub-score).
- Cash flow +30.0/30.0
- 1% rule +10.0/10.0
- DSCR +10.0/10.0
- ARV discount +7.5/15.0
- Livability +4.0/5.0
- Rent growth +3.3/5.0
- Schools +2.5/10.0
- Condition / age +2.5/5.0
- Appreciation +0.0/10.0
$199,900
🖨 Deal sheet 📄 Offer letter ✓ Due diligence
Multi-family units
County records classify this as Multi-Family (2-4 Unit). Listing-text estimate: 2 units. confirmed
Listing remarks MLS
Fully remodeled and fully rented turnkey duplex offering strong cash flow. The property features a 2 bed / 1 bath unit rented for $1,350 and a spacious 5 bed / 2 bath unit rented for $2,300, generating $3,650 in combined monthly income. Leases are in place through October 2026, providing stable rental income. Don't miss this investment opportunity.
Key facts
- 3,485 sq ft lot
- Built 1895
- Listed 50 days
Property features AI
Finance
- Other: Heat paid by tenant; Water paid by owner
- Financial info: Two total units; Unit 1 rent reported at $1,350; Unit 2 rent reported at $2,300
Exterior
- Parking: On-street parking
- Utilities: Public water; Public sewer; Natural gas
- Home design: Duplex; Three+ story; Second floor area noted
- Construction: Block foundation
- Exterior features: Vinyl windows; Shingle/composition roof; Vinyl siding; Lot approximately 0.08 acres
Interior
- Bedrooms: Unit 1: 2 bedrooms; Unit 2: 5 bedrooms
- Bathrooms: Unit 1: 1 full bathroom; Unit 2: 2 full bathrooms
- Heating & cooling: Gas heating; Central air; Separate furnace for units; Separate A/C for units; Separate gas/electric meters
- Interior features: Partial basement; Electric fireplace; Three+ levels
Neighborhood map
What this means for you Summary
Snapshot
- This is a 1×2bd/1ba + 1×5bd/2ba units multifamily listed at $200k.
Deal economics
- At list price, monthly cash flow is $1k ($15k/yr) — positive. Per door: $605/mo.
- The deal already cash-flows at list — no discount required.
- Meets the 1% rule at list price ($3k rent vs $200k).
- Recommended offer: $194k (3.0% below list) — sets the bar for market timing.
- Cap rate 13.6% vs local median 3.9% in Cincinnati — top-decile yield for the area; either an underpriced asset or a hidden risk that comps aren't pricing in. Stress-test before assuming the spread holds.
Location & tenants
- Location reads 80/100 on livability (#130 in OH, #1,856 nationally) — a professional / high-income tenant draw. Strengths: amenities A+, commute A+, cost of living A+; Watch: employment D, crime F.
- Cincinnati Public Schools (urban): math 25% / reading 36% proficiency, ranked #581 of 656 in OH (top 89%) — families likely to look elsewhere, expect single-tenant / working-renter base with shorter leases; 70% free/reduced lunch — lower-income household profile, screen leases tightly.
- Market conditions: Rents rising (+3.3%/yr); 69 active listings in the ZIP; 1 comparable units currently listed for rent nearby; lower-income renter base — watch delinquency; 801 units permitted in Hamilton County in 2024 (190 in 5+ unit buildings).
- At $3,267/mo this rent would consume 90% of the median local household income ($44k/yr) (locally 980% of renters already pay >50% of income on rent) — very limited rent-growth headroom before tenants either downsize or default.
Forward outlook
- Local home prices are declining (-3.0%/yr); year-one equity from $1k of loan paydown is wiped out by about $6k of value loss. Plan a longer hold.
- At projected returns (-3.0% appreciation + 3.3% rent growth), your $56k cash investment doubles in ~5 years — after that, you're playing with house money.
Negotiation context
- It's been on market 50 days — a 3% lower offer ($194k) is reasonable based on typical stale-listing flexibility.
- 23 sale attempts since 28y ago; this cycle's ask has dropped $99k (33%) from the opening price — seller is motivated, your offer sets the floor, not the list.
- Current owner paid $85k; list at $200k implies a 135% gain — meaningful room to come down on a strong offer.
Risks & watch-outs
- Watch-outs: built in 1895 — expect roof / HVAC / electrical / plumbing capex.
Questions for the listing agent
- It's been on market 50 days. Have you received any prior offers? Is the seller open to a 3% concession, seller financing, or rate buy-down credit?
- Can we see the unit-by-unit rent roll, current vacancy, and any below-market leases? What's the average tenancy length?
- What capital expenditures (roof, boiler, parking lot, exteriors) have been made in the last 5 years, and what's planned in the next 2?
- Built in 1895 — when were the roof, HVAC, electrical panel, plumbing, and water heater last replaced?
- Is there a deadline driving the sale (1031 exchange, divorce, estate, relocation)? That informs how much negotiation room exists.
- Schools are B-rated — typically a magnet for longer-tenancy family renters. What's the average tenant stay here, and is there a school-zone premium baked into asking?
- Crime grade is F in this area — have there been break-ins, vandalism, or insurance claims at this property in the last 3 years? What carrier currently insures it and at what premium?
- What's the average days-on-market for RENTAL listings here right now (not sales)? A rising rental-DOM trend means longer vacancies and softer asking-rent achievability than the comps imply.
- What's the recent tenant-quality profile in this submarket — average credit score on applications, eviction rate, late-payment / NSF rate, and stable-employment percentage? A property-management company in the area should have these aggregated.
- How much new apartment / multifamily construction is in the pipeline within 1–3 miles? Heavy new supply (>2% of stock underway) typically softens rents 12–24 months out; light construction supports rent growth.
Investment metrics
- 1% rule
- 1.63% ✓
- Cap rate
- 13.55%
- Cash-on-cash
- 25.93%
- DSCR
- 2.15
- GRM
- 5.1
CMA / ARV
No comps found within radius.
Projected returns pro-forma
-3.0% appreciation · 3.3% rent growth · sell at horizon
- IRR
- 20.0%
- Equity multiple
- 1.82×
- Total profit
- $45,672
- Equity at exit
- $29,806
- IRR
- 28.4%
- Equity multiple
- 3.56×
- Total profit
- $143,219
- Equity at exit
- $17,284
Cash invested: $55,972 (down + closing). Projections, not guarantees.
Landlord ↔ Tenant lean methodology
- Overall (STATE)
- 73 Landlord-Friendly
- State Ohio
- 73 Landlord-Friendly · R+6
- County
- — inherits STATE
- City
- — inherits STATE
ZIP-level market 45205
- Rents YoY
- 3.3%
- Active inventory
- 69
- Price-to-rent
- 11.6×
Monthly cashflow live
- Estimated rent
- $3,267 high interval (Pro) →
- Mortgage (P&I)
- −$1,048
- Tax from tax record
- −$240 /mo · $2,878/yr
- Insurance
- −$83
- HOA
- −$0
- Vacancy / Maint / Mgmt
- −$686
- Net cashflow
- $1,209
Break-even live
2-unit breakdown (identical units grouped — click to expand)
| Units | Beds | Baths | Est. rent |
|---|---|---|---|
| 1× unit | 2 | 1 | $1,433 |
| 1× unit | 5 | 2 | $1,834 |
| Total (2 units) | $3,267 | ||
UW: 25.0% down · 7.5% · 30yr · 1.5% tax · 5.0% vac · 8.0% maint · 8.0% mgmt
Financing live
Cash to close
- Down payment
- $49,975
- Closing costs
- $5,997
- Reserves months
- —
- Total cash needed
- —
Loan-product check · same deal, 3 products live
Conventional
25% down · 7.5% · 30yr
- Down + closing
- —
- Monthly P&I
- —
- Monthly cashflow
- —
- DSCR
- —
- Eligible?
- —
Personal DTI + credit; lowest rate.
DSCR
20% down · 8.5% · 30yr
- Down + closing
- —
- Monthly P&I
- —
- Monthly cashflow
- —
- DSCR
- —
- Eligible?
- —
No personal income docs; deal must DSCR.
Hard money
10% down · 12.0% · 12mo
- Down + closing
- —
- Monthly P&I
- —
- Monthly cashflow
- —
- DSCR
- —
- Eligible?
- —
Short-term bridge; refi at stabilization.
Rent comps 1 comps
| Address | Beds | Baths | Sqft | Rent | $/sqft | DOM | Units | Dist |
|---|---|---|---|---|---|---|---|---|
| 775 Summit Ave Cincinnati, OH | 3.0 | 2.0 | 2700 | $2,100 | $0.78 | 14d | 1 | 0.24mi |
Listing history 50 events
-
2026-06-18days on market $199,900 Active 50 DOM
-
2026-06-17days on market $199,900 Active 49 DOM
-
2026-06-16days on market $199,900 Active 48 DOM
-
2026-06-15days on market $199,900 Active 47 DOM
-
2026-06-13days on market $199,900 Active 45 DOM
-
2026-06-13days on market $199,900 Active 44 DOM
-
2026-06-09days on market $199,900 Active 41 DOM
-
2026-06-08days on market $199,900 Active 40 DOM
-
2026-06-07days on market $199,900 Active 39 DOM
-
2026-06-03days on market $199,900 Active 35 DOM
-
2026-06-02days on market $199,900 Active 34 DOM
-
2026-06-01days on market $199,900 Active 33 DOM
-
2026-05-31days on market $199,900 Active 32 DOM
-
2026-05-13price $199,900
-
2026-04-28$299,000 Active
Show marketing remark (350 chars)
Fully remodeled and fully rented turnkey duplex offering strong cash flow. The property features a 2 bed / 1 bath unit rented for $1,350 and a spacious 5 bed / 2 bath unit rented for $2,300, generating $3,650 in combined monthly income. Leases are in place through October 2026, providing stable rental income. Don't miss this investment opportunity.
-
2026-04-28historical 350-char remark
Show marketing remark (350 chars)
Fully remodeled and fully rented turnkey duplex offering strong cash flow. The property features a 2 bed / 1 bath unit rented for $1,350 and a spacious 5 bed / 2 bath unit rented for $2,300, generating $3,650 in combined monthly income. Leases are in place through October 2026, providing stable rental income. Don't miss this investment opportunity.
-
2026-04-23price $299,000 350-char remark
Show marketing remark (350 chars)
Fully remodeled and fully rented turnkey duplex offering strong cash flow. The property features a 2 bed / 1 bath unit rented for $1,350 and a spacious 5 bed / 2 bath unit rented for $2,300, generating $3,650 in combined monthly income. Leases are in place through October 2026, providing stable rental income. Don't miss this investment opportunity.
-
2026-03-07$299,900 Active 350-char remark
Show marketing remark (264 chars)
Fully renovated and fully rented duplex featuring a 2 bed / 1 bath unit rented at $1,350 and a spacious 5 bed / 2 bath unit rented at $2,300 ($3,650 combined monthly income). Leases are in place through October 2026. Don't miss this turnkey investment opportunity.
-
2026-03-07historical 264-char remark
Show marketing remark (264 chars)
Fully renovated and fully rented duplex featuring a 2 bed / 1 bath unit rented at $1,350 and a spacious 5 bed / 2 bath unit rented at $2,300 ($3,650 combined monthly income). Leases are in place through October 2026. Don't miss this turnkey investment opportunity.
-
2026-01-28$299,900 Active 264-char remark
Show marketing remark (264 chars)
Fully renovated and fully rented duplex featuring a 2 bed / 1 bath unit rented at $1,350 and a spacious 5 bed / 2 bath unit rented at $2,300 ($3,650 combined monthly income). Leases are in place through October 2026. Don't miss this turnkey investment opportunity.
-
2026-01-28historical
Show marketing remark (264 chars)
Fully renovated and fully rented duplex featuring a 2 bed / 1 bath unit rented at $1,350 and a spacious 5 bed / 2 bath unit rented at $2,300 ($3,650 combined monthly income). Leases are in place through October 2026. Don't miss this turnkey investment opportunity.
-
2026-01-27price $299,900
-
2026-01-13price $324,900
-
2026-01-03price $349,900
-
2025-12-15$369,900 Active
-
2025-04-09soldstatus $85,000 Sold
-
2025-03-15historical Contingency Pending
-
2025-03-11status Active
-
2025-02-26historical Contingency Pending
-
2025-02-16status Active
-
2025-02-05historical Contingency Pending
-
2025-01-20price $82,000
-
2025-01-15status Active
-
2024-11-25historical Contingency Pending
-
2024-11-12$130,000 Active
-
2024-11-11historical
-
2024-09-12price $135,000
-
2024-08-22status Active
-
2024-08-16historical Contingency Pending
-
2024-05-11$150,000 Active
-
2024-03-27historical
-
2023-12-15price $150,000
-
2023-09-27$160,000 Active
-
2023-09-21historical
-
2023-04-13price $165,000
-
2023-04-13status Active
-
2023-04-13price $150,000
-
2023-03-06status Pending
-
2022-11-13status Active
-
2022-11-08historical Contingency Pending
ⓘ Source: listings_history table (triggers on properties + properties_extension) + one-shot
backfill from property_details.listing_events for pre-trigger history.
Tax reassessment forecast OH · Partial reset (capped growth)
- Current annual tax
- $2,878 · $240/mo
- Projected year-2 tax
- $2,998 · $250/mo
- Expected delta
- +$120/yr (+$10/mo · 4.2%)
ⓘ Screening estimate from a state-policy table — verify with the county assessor before closing.
Climate risk First Street
- Flood 1/10 Low FEMA zone X (unshaded) · 0% chance over 30 yrs
- Wildfire 1/10 Low
- Heat 4/10 Moderate 7 d/yr ≥102°F today · 19 d/yr by 30 yrs out
- Wind 2/10 Low 100% chance of damaging wind over 30 yrs
- Air quality 3/10 Moderate 3 unhealthy d/yr today · 5 by 30 yrs out
Nearby sold comps map
Loading sold comps map…
Walkable amenities ~0.75 mi
Loading nearby amenities…
Taxation est. · year 1
- Rental income
- $39,204
- − Mortgage interest
- −$11,198
- − Property taxes
- −$2,878
- − Insurance
- −$1,000
- − Repairs & maintenance
- −$3,136
- − Management
- −$3,136
- − Depreciation
- −$5,815
- Taxable income
- $12,041
- Est. tax owed @ 24.0%
- −$2,890
- After-tax cash flow
- $11,624/yr
For passive investors: Depreciation is non-cash, so a rental often shows a tax loss while cash-flowing — sheltering income. Rental losses are passive: they offset passive income freely, and up to $25,000/yr can offset ordinary (W-2) income if you actively participate and your MAGI is under $100k (phasing out to $0 by $150k); unused losses carry forward. On sale, claimed depreciation is recaptured at up to 25%, and gains may owe capital-gains tax (a 1031 exchange can defer both). Figures are a year-1 estimate at your 24.0% rate — not tax advice; consult a CPA.
Schools (NCES district)
- District
- Cincinnati Public Schools
- NCES district ID
- 3904375
- Math proficiency
- 25% ▼ -19.00%
- Reading proficiency
- 36% ▼ -14.00%
- Median HH income
- $35,743
- Composite
- 25.21/100
- National rank
- #7508
- State rank
- #581 of 656 in OH
Livability — Cincinnati
- Score
- 80/100
- State rank
- #130
- US rank
- #1856
Category grades
Schools grade is shown separately in the Schools card above.
Census & demographics
- Census place
- Cincinnati, OH
- County
- Hamilton County · 701,295 people
- City population
- 505,555
- Metro
- Cincinnati, OH-KY-IN
- Population (ZIP)
- 18,651
- Household income
- $43,682
- Rent vs Own
- Severe rent burden
- 980.0
Population outlook (Hamilton County) Hauer SSP2
- Today (2025)
- 826,054 people
- By 2030
- 830,947 · +0.6%
- By 2040
- 832,319 · +0.8%
- By 2050
- 822,428 · -0.4%
- By 2075
- 788,688 · -4.5%
- By 2100
- 710,674 · -14.0%
Race, ethnicity, and origin ACS 2023
- Neighborhood character
- Diverse neighborhood (Simpson 0.69)
- Race & ethnicity
- Black 43% White 32% Hispanic / Latino 16% Two or more races 7% Asian 2%
- Hispanic origin (detail)
- Mexican 2%
- Common ancestry
- Lithuanian 1% Slovak 1% Serbian 1%
- Foreign-born
- 9% · Canada, India, China
- Languages at home
- 84% English-only · Spanish 10% Other Asian/Pacific 2% Other Indo-European 1%
Political lean MEDSL · Hamilton
- 2024 margin
- D (+14.9) · D 57.0% · R 42.1%
- 2008→2024 swing
- +7.9pp toward D · 2008: 7.0pp · 2024: 14.9pp
- All cycles
- 2024: D+14.9 2020: D+15.9 2016: D+9.5 2012: D+4.9 2008: D+7.0
Not yet ingested
- Civics
- —
Market trends
- HPI YoY
- ▼ -138.67%
- Current HPI
- 163.3375
- Rent YoY
- ▲ 3.30%
- Metro
- Cincinnati, OH-KY-IN
- State GDP YoY
- ▲ 1.98%
- F500 in state
- 48
Industry mix (Fortune 500 HQ in OH)
| Industry | F500 HQs | Revenue |
|---|---|---|
| Insurance | 3 | $145B |
|
||
| Industrial Machinery | 3 | $49B |
|
||
| Financial Services | 3 | $24B |
|
||
| Consumer Goods | 2 | $93B |
|
||
| Aerospace / Defense | 2 | $47B |
|
||
| Utilities | 2 | $33B |
|
||
Price history
+292.0% since first listed66 events — show timeline
- 2026-05-13 Price Changed $199,900 Cincy MLS
- 2026-04-28 Listing Removed — Cincy MLS
- 2026-04-28 Listed $299,000 Cincy MLS
- 2026-04-23 Price Changed $299,000 Cincy MLS
- 2026-03-07 Listing Removed — Cincy MLS
- 2026-03-07 Listed $299,900 Cincy MLS
- 2026-01-28 Listing Removed — Cincy MLS
- 2026-01-28 Listed $299,900 Cincy MLS
- 2026-01-27 Price Changed $299,900 Cincy MLS
- 2026-01-13 Price Changed $324,900 Cincy MLS
- 2026-01-03 Price Changed $349,900 Cincy MLS
- 2025-12-15 Listed $369,900 Cincy MLS
- 2025-04-09 Sold (MLS) $85,000 Cincy MLS
- 2025-03-15 Contingent — Cincy MLS
- 2025-03-11 Relisted — Cincy MLS
- 2025-02-26 Contingent — Cincy MLS
- 2025-02-16 Relisted — Cincy MLS
- 2025-02-05 Contingent — Cincy MLS
- 2025-01-20 Price Changed $82,000 Cincy MLS
- 2025-01-15 Relisted — Cincy MLS
- 2024-11-25 Contingent — Cincy MLS
- 2024-11-12 Listed $130,000 Cincy MLS
- 2024-11-11 Listing Removed — Cincy MLS
- 2024-09-12 Price Changed $135,000 Cincy MLS
- 2024-08-22 Relisted — Cincy MLS
- 2024-08-16 Contingent — Cincy MLS
- 2024-05-11 Listed $150,000 Cincy MLS
- 2024-03-27 Listing Removed — Cincy MLS
- 2023-12-15 Price Changed $150,000 Cincy MLS
- 2023-09-27 Listed $160,000 Cincy MLS
- 2023-09-21 Listing Removed — Cincy MLS
- 2023-04-13 Price Changed $165,000 Cincy MLS
- 2023-04-13 Relisted — Cincy MLS
- 2023-04-13 Price Changed $150,000 Cincy MLS
- 2023-03-06 Pending — Cincy MLS
- 2022-11-13 Relisted — Cincy MLS
- 2022-11-08 Contingent — Cincy MLS
- 2022-10-14 Price Changed $199,000 Cincy MLS
- 2022-09-21 Listed $227,000 Cincy MLS
- 2021-03-10 Sold (Public Records) $50,000 Public Records
- 2018-09-26 Sold (Public Records) $38,000 Public Records
- 2018-09-14 Sold (MLS) $38,000 Cincy MLS
- 2018-09-04 Contingent — Cincy MLS
- 2018-08-22 Relisted — Cincy MLS
- 2018-08-17 Contingent — Cincy MLS
- 2018-07-31 Listed $45,000 Cincy MLS
- 2009-08-07 Listing Removed — Cincy MLS
- 2009-07-16 Listing Removed — Cincy MLS
- 2009-07-14 Listed $13,500 Cincy MLS
- 2009-03-16 Listed $19,500 Cincy MLS
- 2008-11-13 Listing Removed — Cincy MLS
- 2008-05-20 Listed $98,000 Cincy MLS
- 2007-10-19 Sold (Public Records) $105,000 Public Records
- 2006-08-21 Listing Removed — Cincy MLS
- 2006-01-11 Listed $29,900 Cincy MLS
- 2000-12-18 Sold (Public Records) $75,000 Public Records
- 2000-11-30 Sold (MLS) $75,000 Cincy MLS
- 2000-08-22 Listed $79,900 Cincy MLS
- 2000-08-16 Listing Removed — Cincy MLS
- 2000-05-15 Listed $69,900 Cincy MLS
- 1999-02-05 Sold (Public Records) $53,000 Public Records
- 1999-02-05 Sold (Public Records) $59,900 Public Records
- 1999-01-28 Sold (MLS) $53,000 Cincy MLS
- 1998-09-19 Listed $58,900 Cincy MLS
- 1994-11-09 Sold (Public Records) $51,000 Public Records
- 1994-10-09 Sold (Public Records) $51,000 Public Records
Property tax history
+31.5%/yrLatest (2025): $2,878 · +0.1% YoY. Source: county tax records.
Cash-flow waterfall
monthlySold comps — $/sqft
last 12 mo · ≤1 miLoading sold comps…