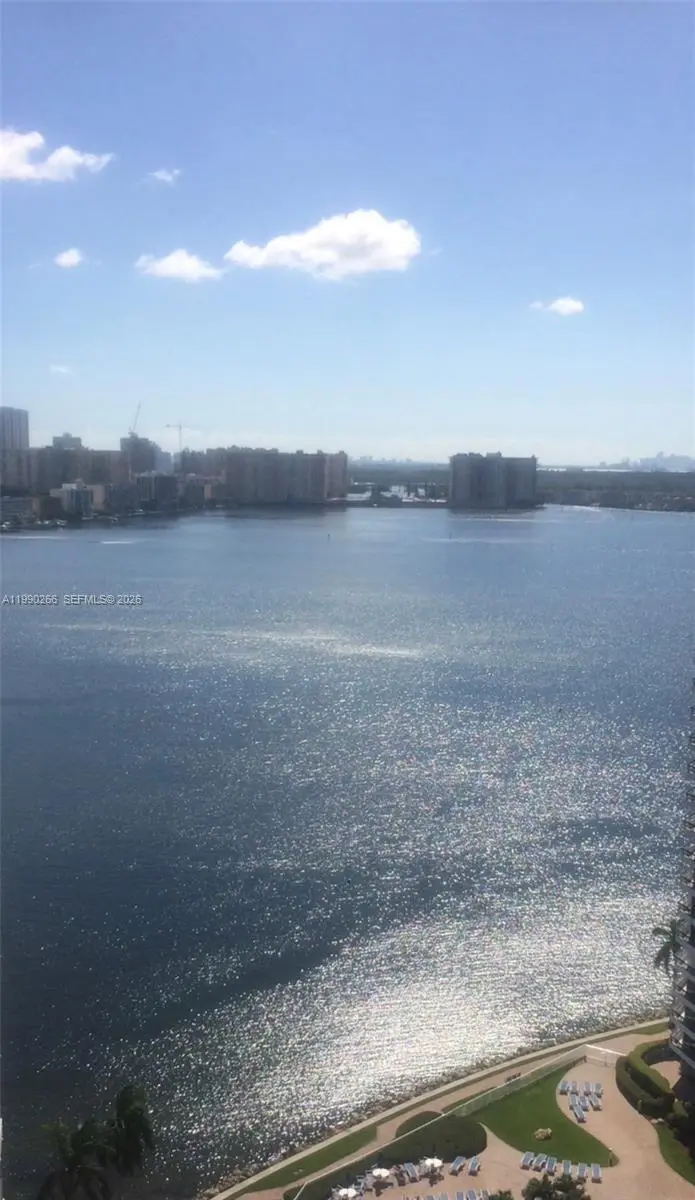
19195 NE 36th Ct #2304 · Aventura, FL
Flood risk No data
- FEMA flood zone
- —
- Chance of flooding over 30 yrs
- —
- Est. flood insurance / yr
- —
Fire risk No data
- Est. fire insurance / yr
- —
Heat risk No data
- Hot days now (above threshold)
- —
- Hot days in 30 yrs
- —
Wind risk No data
- Chance of severe wind over 30 yrs
- —
Air-quality risk No data
- Unhealthy air days now
- —
- Unhealthy air days in 30 yrs
- —
Risk factors via First Street. Map © Google.
Why this score? — see what drove the C+ grade
The composite is a weighted blend of 9 inputs, each scored 0–100. Each bar is that input's sub-score; the figure is the points it added to the 100-point composite (weight × sub-score).
- Cash flow +24.0/30.0
- DSCR +7.7/10.0
- ARV discount +7.5/15.0
- 1% rule +7.0/10.0
- Condition / age +4.8/5.0
- Schools +4.2/10.0
- Livability +4.0/5.0
- Rent growth +2.1/5.0
- Appreciation +0.0/10.0
$299,900
🖨 Deal sheet 📄 Offer letter ✓ Due diligence
Listing remarks
MUST SELL! REDUCED $30K FOR QUICK SALE!!! SPACIOUS 1 BED. 1 BTH. HIGHLY UPGRADED! TOTALLY RENOVATED(KITCHEN AND BATHROOM)! HIGH IMPACT WINDOWS AND DOORS THROUGHOUT! FLAT/SMOOTH CEILINGS. SOLID WOOD DECORATIVE DOORS. NO EXPENSE WAS SPARED! LOOKS LIKE A MODEL! SUPER CLEAN! MOST AMAZING WATER VIEWS! STAINLESS STEEL APPLIANCES, NEW A/C, TANKLESS WATER HEATER, WINE COOLER, BUILT OUT CLOSETS, PLANTATION SHUTTERS AND MUCH MORE! BUILDING HAS SECURITY, A FITNESS CENTER/GYM, LIBRARY, HEATED POOL AND JACUZZI OVERLOOKING THE INTRACOASTAL, PARTY ROOM, PING PONG AND MUCH MORE! MYSTIC POINTE COMPLEX IS GATED AND HAS SECURITY, MARINA, TENNIS COURTS/PICKLE BALL COURTS WITH PRO SHOP AND PRO, BASKETBALL
Key facts
- Built out closets
- Plantation shutters
- High impact windows
Tags
Property features AI
Finance
- Financial info: Pets allowed with restrictions or possible restrictions (conditional)
- HOA & community: Association fees (monthly/quarterly; includes management, amenities, cable TV, parking, pool(s), sewer, security, trash, water); Community amenities include basketball court, billiard room, bike storage, fitness center, playground, pickleball, pool, spa/hot tub, tennis courts, and trails
Exterior
- Parking: Attached, covered garage parking; 1 garage space; Secured garage/parking; Valet available
- Security: Lobby secured; Security guard; Secured garage/parking
- Utilities: Cable available
- Home design: Condominium (attached property); High-rise building (31 stories); Updated/remodeled; Waterfront with bay front and intracoastal access
- Construction: Block construction; Effective year built
- Exterior features: Balcony (open); Security/high-impact doors; Association pool; Seawall
Interior
- Kitchen: Built-in oven; Electric range; Microwave; Dishwasher; Refrigerator; Disposal; Wine cooler
- Bedrooms: Bedroom located on main level
- Flooring: Marble flooring
- Bathrooms: 1 full bathroom
- Heating & cooling: Central heating (electric); Central air conditioning (electric)
- Interior features: Impact glass windows; Plantation shutters; Closet cabinetry; Walk-in closets; Bedroom on main level; Updated/remodeled condition
- Laundry & utility: Washer; Dryer; Electric water heater
Neighborhood map
What this means for you Summary
Snapshot
- This is a 1-bed/1.0-bath condo listed at $300k. Condition is rated excellent.
Deal economics
- At list price, monthly cash flow is $585 ($7k/yr) — positive.
- The deal already cash-flows at list — no discount required.
- Meets the 1% rule at list price ($4k rent vs $300k).
- Recommended offer: $282k (6.0% below list) — sets the bar for market timing.
- Cap rate 8.6% vs local median 2.6% in Aventura — top-decile yield for the area; either an underpriced asset or a hidden risk that comps aren't pricing in. Stress-test before assuming the spread holds.
Location & tenants
- Location reads 80/100 on livability (#127 in FL, #1,834 nationally) — a professional / high-income tenant draw. Strengths: schools A+, health & safety A+, amenities A; Watch: crime D+, cost of living F.
- Miami-Dade (suburban): math 45% / reading 54% proficiency, ranked #40 of 73 in FL (top 55%) — families likely to look elsewhere, expect single-tenant / working-renter base with shorter leases; 64% free/reduced lunch — lower-income household profile, screen leases tightly.
- Market conditions: Rents soft (-1.5%/yr); 985 active listings in the ZIP; 8 comparable units currently listed for rent nearby; rentals at typical pace (median 21d on market — plan ~3-4 weeks tenant-placement turnaround); solid renter incomes; 10,051 units permitted in Miami-Dade County in 2024 (7,758 in 5+ unit buildings).
- At $3,610/mo this rent would consume 48% of the median local household income ($91k/yr) (locally 1838% of renters already pay >50% of income on rent) — very limited rent-growth headroom before tenants either downsize or default.
Forward outlook
- Local home prices are declining (-3.0%/yr); year-one equity from $2k of loan paydown is wiped out by about $9k of value loss. Plan a longer hold.
- Miami-Dade County population projected at +28% by 2050 — long-run rental-demand tailwind backs the buy-and-hold thesis.
Negotiation context
- It's been on market 83 days — a 6% lower offer ($282k) is reasonable based on typical stale-listing flexibility.
- 2 sale attempts; this cycle's ask has dropped $79k (21%) from the opening price — seller is motivated, your offer sets the floor, not the list.
Questions for the listing agent
- It's been on market 83 days. Have you received any prior offers? Is the seller open to a 6% concession, seller financing, or rate buy-down credit?
- What does the HOA fee cover, when was the last increase, and are there any pending special assessments or reserve-fund shortfalls?
- Any open or pending special assessments — roof, HVAC, plumbing, elevator, façade? What's the per-unit balance and payoff schedule, and is the seller paying it off at close or rolling it to the buyer?
- Why hasn't it sold? Are there any deal-killer items the seller is aware of (foundation, flood, title, zoning, code violations)?
- Is there a deadline driving the sale (1031 exchange, divorce, estate, relocation)? That informs how much negotiation room exists.
- Schools are A-rated — typically a magnet for longer-tenancy family renters. What's the average tenant stay here, and is there a school-zone premium baked into asking?
- Crime grade is D in this area — have there been break-ins, vandalism, or insurance claims at this property in the last 3 years? What carrier currently insures it and at what premium?
- What's the average days-on-market for RENTAL listings here right now (not sales)? A rising rental-DOM trend means longer vacancies and softer asking-rent achievability than the comps imply.
- What's the recent tenant-quality profile in this submarket — average credit score on applications, eviction rate, late-payment / NSF rate, and stable-employment percentage? A property-management company in the area should have these aggregated.
- How much new apartment / multifamily construction is in the pipeline within 1–3 miles? Heavy new supply (>2% of stock underway) typically softens rents 12–24 months out; light construction supports rent growth.
Investment metrics
- 1% rule
- 1.20% ✓
- Cap rate
- 8.63%
- Cash-on-cash
- 8.35%
- DSCR
- 1.37
- GRM
- 6.9
CMA / ARV
No comps found within radius.
Projected returns pro-forma
-3.0% appreciation · 0.0% rent growth · sell at horizon
- IRR
- -7.3%
- Equity multiple
- 0.74×
- Total profit
- $-21,769
- Equity at exit
- $44,716
- IRR
- -2.3%
- Equity multiple
- 0.87×
- Total profit
- $-11,193
- Equity at exit
- $25,930
Cash invested: $83,972 (down + closing). Projections, not guarantees.
Landlord ↔ Tenant lean methodology
- Overall (STATE)
- 87 Strongly Landlord-Friendly
- State Florida
- 87 Strongly Landlord-Friendly · R+3
- County
- — inherits STATE
- City
- — inherits STATE
ZIP-level market 33180
- Rents YoY
- -1.5%
- Active inventory
- 985
- Price-to-rent
- 6.9×
Monthly cashflow live
- Estimated rent
- $3,610 high interval (Pro) →
- Mortgage (P&I)
- −$1,573
- Tax est. 1.5%
- −$375 /mo · $4,498/yr
- Insurance
- −$125
- HOA
- −$195
- Vacancy / Maint / Mgmt
- −$758
- Net cashflow
- $585
Break-even live
UW: 25.0% down · 7.5% · 30yr · 1.5% tax · 5.0% vac · 8.0% maint · 8.0% mgmt
Financing live
Cash to close
- Down payment
- $74,975
- Closing costs
- $8,997
- Reserves months
- —
- Total cash needed
- —
Loan-product check · same deal, 3 products live
Conventional
25% down · 7.5% · 30yr
- Down + closing
- —
- Monthly P&I
- —
- Monthly cashflow
- —
- DSCR
- —
- Eligible?
- —
Personal DTI + credit; lowest rate.
DSCR
20% down · 8.5% · 30yr
- Down + closing
- —
- Monthly P&I
- —
- Monthly cashflow
- —
- DSCR
- —
- Eligible?
- —
No personal income docs; deal must DSCR.
Hard money
10% down · 12.0% · 12mo
- Down + closing
- —
- Monthly P&I
- —
- Monthly cashflow
- —
- DSCR
- —
- Eligible?
- —
Short-term bridge; refi at stabilization.
Rent comps 8 comps
| Address | Beds | Baths | Sqft | Rent | $/sqft | DOM | Units | Dist |
|---|---|---|---|---|---|---|---|---|
| 3180 S Ocean Dr Hallandale Beach, FL | 2.0–3.0 | 2.0 | 1285 | $3,650 | $2.84 | 24d | 3 | 1.28mi |
| 3180 S Ocean Dr Hallandale Beach, FL | 2.0–3.0 | 2.0 | 1263 | $3,750 | $2.97 | 20d | 2 | 1.28mi |
| 3180 S Ocean Dr #1709 Hallandale Beach, FL | 2.0 | 2.0 | 1105 | $4,000 | $3.62 | 7d | 1 | 1.28mi |
| 3140 S Ocean Dr Hallandale Beach, FL | 2.0 | 2.0 | 1100 | $4,250 | $3.86 | 1d | 2 | 1.32mi |
| 2065 S Ocean Dr Unit 1049793P Hallandale Beach, FL | 2.0 | 2.0 | 871 | $4,971 | $5.71 | 7d | 1 | 1.36mi |
| 2080 S Ocean Dr Hallandale Beach, FL | 2.0–3.0 | 2.0–2.5 | 1270 | $3,800 | $2.99 | 3d | 11 | 1.37mi |
| 2080 S Ocean Dr Hallandale Beach, FL | 2.0–3.0 | 2.0–2.5 | 1270 | $3,900 | $3.07 | 24d | 7 | 1.37mi |
| 2080 S Ocean Dr #8 Hallandale Beach, FL | 2.0 | 2.0 | 1100 | $4,000 | $3.64 | 24d | 1 | 1.38mi |
HOA detail condo
- Monthly dues
- $195 · $2,340/yr
- Likely covers
- waterpoolgymsecurity
- Assessments
- None detected in remarks — confirm with the listing agent.
Listing history 18 events
-
2026-06-18days on market $299,900 Active 83 DOM
-
2026-06-17days on market $299,900 Active 82 DOM
-
2026-06-16days on market $299,900 Active 81 DOM
-
2026-06-15days on market $299,900 Active 80 DOM
-
2026-06-13days on market $299,900 Active 78 DOM
-
2026-06-09days on market $299,900 Active 74 DOM
-
2026-06-08days on market $299,900 Active 73 DOM
-
2026-06-07days on market $299,900 Active 72 DOM
-
2026-06-04days on market $299,900 Active 69 DOM
-
2026-06-03days on market $299,900 Active 68 DOM
-
2026-06-02days on market $299,900 Active 67 DOM
-
2026-06-01days on market $299,900 Active 66 DOM
-
2026-05-31days on market $299,900 Active 65 DOM
-
2026-04-13price $349,000
-
2026-03-27$379,000 Active
-
2026-03-23historical
-
2026-01-23price $389,000
-
2025-09-29$399,000 Active
ⓘ Source: listings_history table (triggers on properties + properties_extension) + one-shot
backfill from property_details.listing_events for pre-trigger history.
Nearby sold comps map
Loading sold comps map…
Walkable amenities ~0.75 mi
Loading nearby amenities…
Taxation est. · year 1
- Rental income
- $43,324
- − Mortgage interest
- −$16,799
- − Property taxes
- −$4,498
- − Insurance
- −$1,500
- − Repairs & maintenance
- −$3,466
- − Management
- −$3,466
- − HOA
- −$2,340
- − Depreciation
- −$8,724
- Taxable income
- $2,530
- Est. tax owed @ 24.0%
- −$607
- After-tax cash flow
- $6,408/yr
For passive investors: Depreciation is non-cash, so a rental often shows a tax loss while cash-flowing — sheltering income. Rental losses are passive: they offset passive income freely, and up to $25,000/yr can offset ordinary (W-2) income if you actively participate and your MAGI is under $100k (phasing out to $0 by $150k); unused losses carry forward. On sale, claimed depreciation is recaptured at up to 25%, and gains may owe capital-gains tax (a 1031 exchange can defer both). Figures are a year-1 estimate at your 24.0% rate — not tax advice; consult a CPA.
Condition & rehab AI · 13 photos
This fully-upgraded and well-maintained condo is move-in ready with stunning water views and modern amenities.
Value-add opportunities
- Both Upgraded kitchen appliances — Modern stainless steel appliances enhance both resale and rental value
- Both Landscaping improvements — Well-maintained landscaping enhances curb appeal and rental value
- Both Paint touch-ups — Neutral paint color is timeless and enhances both resale and rental value
Renovation cost estimate screening
Value-add ROI direction
- Both Upgraded kitchen appliances — Modern stainless steel appliances enhance both resale and rental value ↑
- Both Landscaping improvements — Well-maintained landscaping enhances curb appeal and rental value ↑
- Both Paint touch-ups — Neutral paint color is timeless and enhances both resale and rental value ↑
ⓘ Cost ranges are severity-bucket heuristics (US national rule-of-thumb). Get contractor quotes + a written scope before underwriting a rehab budget.
Schools (NCES district)
- District
- Miami-Dade
- NCES district ID
- 1200390
- Math proficiency
- 45% ▼ -16.00%
- Reading proficiency
- 54% ▼ -5.00%
- Median HH income
- $43,928
- Composite
- 41.76/100
- National rank
- #3397
- State rank
- #40 of 73 in FL
Livability — Aventura
- Score
- 80/100
- State rank
- #127
- US rank
- #1834
Category grades
Schools grade is shown separately in the Schools card above.
Census & demographics
- Census place
- Aventura, FL
- County
- Miami-Dade County · 2,697,751 people
- City population
- 34,147
- Metro
- Miami-Fort Lauderdale-Pompano Beach, FL
- Population (ZIP)
- 34,147
- Household income
- $91,055
- Rent vs Own
- Severe rent burden
- 1838.0
Population outlook (Miami-Dade County) Hauer SSP2
- Today (2025)
- 3,126,439 people
- By 2030
- 3,325,765 · +6.4%
- By 2040
- 3,697,561 · +18.3%
- By 2050
- 4,012,134 · +28.3%
- By 2075
- 4,605,612 · +47.3%
- By 2100
- 4,866,598 · +55.7%
Race, ethnicity, and origin ACS 2023
- Neighborhood character
- Diverse neighborhood (Simpson 0.59)
- Race & ethnicity
- White 46% Hispanic / Latino 45% Two or more races 28% Black 2% Asian 2%
- Hispanic origin (detail)
- Mexican 2% Puerto Rican 2% Cuban 7% Dominican 1% Salvadoran 6%
- Common ancestry
- Scotch-Irish 5% Romanian 5% Italian 3%
- Foreign-born
- 52% · Canada, Jamaica, Dominican Republic
- Languages at home
- 30% English-only · Spanish 49% Other Indo-European 6% Russian/Polish/Slavic 4%
Political lean MEDSL · Miami-Dade
- 2024 margin
- R (+11.4) · D 43.9% · R 55.4%
- 2008→2024 swing
- -27.6pp toward R · 2008: 16.1pp · 2024: -11.4pp
- All cycles
- 2024: R+11.4 2020: D+7.3 2016: D+29.6 2012: D+23.7 2008: D+16.1
Not yet ingested
- Civics
- —
Market trends
- HPI YoY
- ▼ -343.81%
- Current HPI
- 234.7715
- Rent YoY
- ▼ -1.51%
- Metro
- Miami-Fort Lauderdale-Pompano Beach, FL
- State GDP YoY
- ▲ 3.28%
- F500 in state
- 36
Industry mix (Fortune 500 HQ in FL)
| Industry | F500 HQs | Revenue |
|---|---|---|
| Industrial Technology | 2 | $29B |
|
||
| Insurance | 2 | $17B |
|
||
| Retail | 1 | $60B |
|
||
| Technology Distribution | 1 | $58B |
|
||
| Homebuilding | 1 | $35B |
|
||
| Technology Manufacturing | 1 | $35B |
|
||
Price history
-12.5% since first listed5 events — show timeline
- 2026-04-13 Price Changed $349,000 MARMLS
- 2026-03-27 Listed $379,000 MARMLS
- 2026-03-23 Listing Removed — MARMLS
- 2026-01-23 Price Changed $389,000 MARMLS
- 2025-09-29 Listed $399,000 MARMLS
Cash-flow waterfall
monthlySold comps — $/sqft
last 12 mo · ≤1 miLoading sold comps…