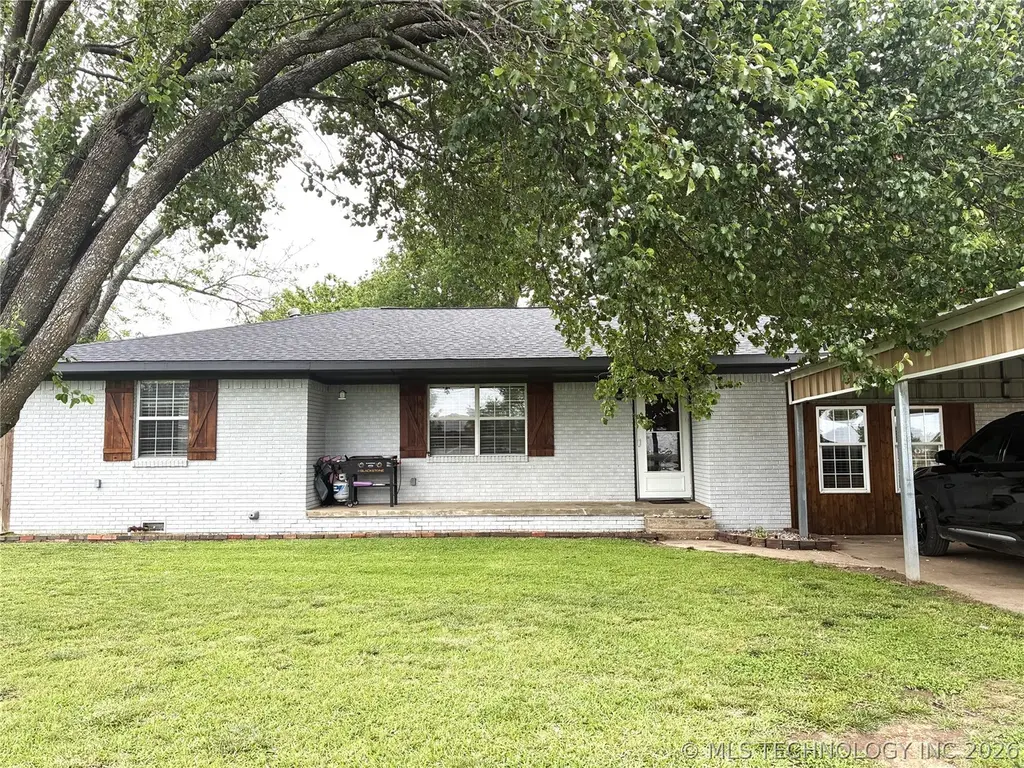
803 N Marshall St · Kingston, OK
Flood risk 1/10 · Minimal
- FEMA flood zone
- X
- Chance of flooding over 30 yrs
- 0.0%
- Est. flood insurance / yr
- $507 – $1,088
Fire risk 6/10 · Moderate
- Est. fire insurance / yr
- $2,463 – $4,575
Heat risk 6/10 · Moderate
- Hot days now (above 109°F)
- 7 days/yr
- Hot days in 30 yrs
- 20 days/yr
Wind risk 4/10 · Minor
- Chance of severe wind over 30 yrs
- 16.0%
Air-quality risk 3/10 · Minor
- Unhealthy air days now
- 3 days/yr
- Unhealthy air days in 30 yrs
- 3 days/yr
Risk factors via First Street. Map © Google.
Why this score? — see what drove the C- grade
The composite is a weighted blend of 9 inputs, each scored 0–100. Each bar is that input's sub-score; the figure is the points it added to the 100-point composite (weight × sub-score).
- Cash flow +21.0/30.0
- Appreciation +10.0/10.0
- DSCR +6.7/10.0
- 1% rule +4.8/10.0
- Livability +3.1/5.0
- Rent growth +2.5/5.0
- Schools +2.5/10.0
- Condition / age +2.5/5.0
- ARV discount +0.0/15.0
$234,000
🖨 Deal sheet (PDF) 📄 Offer letter ✓ Due diligence
Listing remarks
This spacious 3-bedroom, 3-bathroom home is ideally located just a couple of blocks behind the Kingston elementary school and close to middle school offering both convenience and a welcoming neighborhood feel. Inside, you’ll find two master suites, perfect for multi-generational living or added guest comfort, along with a nice sized living area that provides extra space for relaxing or entertaining. A versatile fourth room offers the ideal setup for a home office, hobby space, or even a guest room. The home has been thoughtfully maintained, featuring a roof and privacy fence that are both only five years old. The large, fully fenced backyard provides plenty of room for outdoor activit
Key facts
- Privacy fence
- Storm cellar
- 0.28 acre lot
Tags
Property features AI
Exterior
- Security: Storm shelter; Smoke detectors
- Utilities: Electricity available; Natural gas available; Public water; Public sewer
- Home design: Single-story; Faces east; Crawlspace foundation
- Construction: Brick veneer and wood frame construction; Asphalt/fiberglass roof
- Exterior features: Patio; Porch; Fire pit; Outdoor lighting; Gazebo; Privacy fencing; Mature trees; Less than 10 miles to Texoma Lake
Interior
- Kitchen: Dishwasher; Disposal; Oven; Range; Gas water heater
- Flooring: Carpet; Laminate
- Bathrooms: 3 full bathrooms
- Heating & cooling: Central heating (gas); Central air conditioning
- Interior features: Ceiling fans; Laminate countertops; Insulated windows with aluminum frames; Insulated doors and storm door(s); Electric oven/range connections
- Laundry & utility: Washer hookup; Electric dryer hookup
Neighborhood map
What this means for you Summary
Snapshot
- This is a 3-bed/2.0-bath single-family listed at $234k.
Deal economics
- At list price, monthly cash flow is $329 ($4k/yr) — positive.
- The deal already cash-flows at list — no discount required.
- To meet the 1% rule (rent ≥ 1% of price), the offer needs to be $230k (1.7% below list).
- Recommended offer: $227k (3.0% below list) — sets the bar for market timing.
- Cap rate 8.0% vs local median 4.6% in Kingston — top-decile yield for the area; either an underpriced asset or a hidden risk that comps aren't pricing in. Stress-test before assuming the spread holds.
Location & tenants
- Location reads 62/100 on livability (#251 in OK) — a middle-class / working-renter tenant base. Strengths: cost of living A+, housing A+, crime A-; Watch: amenities F, commute F, health & safety F.
- Kingston (rural): math 27% / reading 32% proficiency, ranked #70 of 270 in OK (top 26%) — low school quality limits family demand, transient renter base, plan for 1-2y turnover; 76% free/reduced lunch — lower-income household profile, screen leases tightly.
- Zoned schools: Kingston Es (math 33% / reading 32%, grade F, #210 of 845 statewide, top 25%, 620 students, 0% FRL); Kingston Ms (math 23% / reading 34%, grade F, #57 of 345 statewide, top 18%, 286 students, 0% FRL); Kingston Hs (math 22% / reading 27%, grade F, #150 of 447 statewide, top 48%, 362 students, 0% FRL) — zoned schools average 0% FRL vs 76% district-wide (76 pts lower); this property's tenant base skews higher-income than the district average.
- Market conditions: 436 active listings in the ZIP; 42 units permitted in Marshall County in 2024 (0 in 5+ unit buildings).
Forward outlook
- In year one you build about $25k of equity ($2k loan paydown + $23k appreciation (10.0% local appreciation)).
- Marshall County population projected at +22% by 2050 — long-run rental-demand tailwind backs the buy-and-hold thesis.
- At projected returns (10.0% appreciation + 3.0% rent growth), your $66k cash investment doubles in ~3 years — after that, you're playing with house money.
- By year 2, paydown + projected appreciation supports a ~$40k cash-out refi (75% LTV) — recoverable capital for the next deal without selling this one.
Negotiation context
- It's been on market 58 days — a 3% lower offer ($227k) is reasonable based on typical stale-listing flexibility.
- 6 sale attempts since 5y ago with the ask held roughly flat each time — persistent listings suggest the price (not the market) is what's stuck; bring a comps-based counter.
Risks & watch-outs
- Climate carrying-cost: major wildfire risk; extreme-heat days projected 7→20/yr by 2055 (HVAC capex compounding) — expect insurance premiums to compound above CPI over the hold.
Questions for the listing agent
- It's been on market 58 days. Have you received any prior offers? Is the seller open to a 3% concession, seller financing, or rate buy-down credit?
- Built in 1975 — when were the roof, HVAC, electrical panel, plumbing, and water heater last replaced?
- Is there a deadline driving the sale (1031 exchange, divorce, estate, relocation)? That informs how much negotiation room exists.
- Schools are F-rated, which usually means shorter tenancies and higher turnover. Who's the typical renter profile here, and what's been the actual vacancy rate?
- What's the average days-on-market for RENTAL listings here right now (not sales)? A rising rental-DOM trend means longer vacancies and softer asking-rent achievability than the comps imply.
- What's the recent tenant-quality profile in this submarket — average credit score on applications, eviction rate, late-payment / NSF rate, and stable-employment percentage? A property-management company in the area should have these aggregated.
- How much new for-sale + rental construction is in the pipeline within 1–3 miles? Heavy new supply typically softens prices + rents 12–24 months out; constrained supply supports both.
Investment metrics
- 1% rule
- 0.98% ✗
- Cap rate
- 7.98%
- Cash-on-cash
- 6.02%
- DSCR
- 1.27
- GRM
- 8.5
CMA / ARV
- ARV (on-the-fly)
- $169,740
- Comps found
- 6
Show comp detail 6 sales within ~0.75 mi
| Address | Dist | Beds/Ba | Sqft | Sold | Price | $/sf | Match |
|---|---|---|---|---|---|---|---|
| 501 NW Sterling | 0.57mi | 3/2.0 | 1,361 (-8%) | 8mo | $157,000 | $115 | 53 |
| 712 NW White | 0.68mi | 3/2.0 | 1,568 (+6%) | 7mo | $52,500 | $33 | 52 |
| 803 NW Dallas | 0.69mi | 4/1.5 (+1) | 1,545 (+5%) | 3mo | $174,000 | $113 | 50 |
| 206 N Main St | 0.40mi | 3/2.0 | 1,620 (+10%) | 18mo | $205,000 | $127 | 50 |
| 502 NW Scribner Dr | 0.40mi | 3/1.5 | 1,332 (-10%) | 20mo | $150,000 | $113 | 46 |
| 104 N Maytubby | 0.48mi | 3/2.0 | 1,260 (-15%) | 23mo | $145,000 | $115 | 34 |
Match score weights: distance 35% · size 25% · config 20% · recency 20%. Top-matched comps best support the ARV.
Projected returns pro-forma
10.0% appreciation · 3.0% rent growth · sell at horizon
- IRR
- 28.6%
- Equity multiple
- 3.26×
- Total profit
- $148,334
- Equity at exit
- $210,806
- IRR
- 24.9%
- Equity multiple
- 7.41×
- Total profit
- $420,268
- Equity at exit
- $454,611
Cash invested: $65,520 (down + closing). Projections, not guarantees.
Landlord ↔ Tenant lean methodology
- Overall (STATE)
- 83 Strongly Landlord-Friendly
- State Oklahoma
- 83 Strongly Landlord-Friendly · R+20
- County
- — inherits STATE
- City
- — inherits STATE
ZIP-level market 73439
- Home prices YoY
- 12.3%
- Active inventory
- 436
- Price-to-rent
- 8.5×
Monthly cashflow live
- Estimated rent
- $2,300 medium interval (Pro) →
- Mortgage (P&I)
- −$1,227
- Tax from tax record
- −$164 /mo · $1,965/yr
- Insurance
- −$98
- HOA
- −$0
- Vacancy / Maint / Mgmt
- −$483
- Net cashflow
- $329
Break-even live
Sensitivity live
| Price | -10% $461 | -5% $395 | +0% $329 | +5% $262 | +10% $196 |
|---|---|---|---|---|---|
| Rent | -10% $147 | -5% $238 | +0% $329 | +5% $420 | +10% $510 |
| Rate | -1.0pp $447 | -0.5pp $388 | base $329 | +0.5pp $268 | +1.0pp $206 |
UW: 25.0% down · 7.5% · 30yr · 1.5% tax · 5.0% vac · 8.0% maint · 8.0% mgmt
Financing live
Cash to close
- Down payment
- $58,500
- Closing costs
- $7,020
- Reserves months
- —
- Total cash needed
- —
Loan-product check · same deal, 3 products live
Conventional
25% down · 7.5% · 30yr
- Down + closing
- —
- Monthly P&I
- —
- Monthly cashflow
- —
- DSCR
- —
- Eligible?
- —
Personal DTI + credit; lowest rate.
DSCR
20% down · 8.5% · 30yr
- Down + closing
- —
- Monthly P&I
- —
- Monthly cashflow
- —
- DSCR
- —
- Eligible?
- —
No personal income docs; deal must DSCR.
Hard money
10% down · 12.0% · 12mo
- Down + closing
- —
- Monthly P&I
- —
- Monthly cashflow
- —
- DSCR
- —
- Eligible?
- —
Short-term bridge; refi at stabilization.
Listing history 38 events
-
2026-06-22days on market $234,000 Active 58 DOM
-
2026-06-19days on market $234,000 Active 56 DOM
-
2026-06-18days on market $234,000 Active 55 DOM
-
2026-06-17days on market $234,000 Active 54 DOM
-
2026-06-16days on market $234,000 Active 53 DOM
-
2026-06-15days on market $234,000 Active 52 DOM
-
2026-06-14days on market $234,000 Active 50 DOM
-
2026-06-13days on market $234,000 Active 49 DOM
-
2026-06-10days on market $234,000 Active 47 DOM
-
2026-06-09days on market $234,000 Active 46 DOM
-
2026-06-08days on market $234,000 Active 45 DOM
-
2026-06-07days on market $234,000 Active 44 DOM
-
2026-06-05days on market $234,000 Active 41 DOM
-
2026-06-02days on market $234,000 Active 39 DOM
-
2026-06-01days on market $234,000 Active 38 DOM
-
2026-05-31days on market $234,000 Active 37 DOM
-
2026-05-30days on market $234,000 Active 36 DOM
-
2026-04-23$239,000 Active
-
2025-05-02historical
-
2025-03-12price $235,000
-
2024-11-02$250,000 Active
-
2024-11-02historical
-
2024-10-07status Active
-
2024-10-07price $250,000
-
2024-09-20historical
-
2024-07-09price $235,000
-
2024-05-21price $245,000
-
2024-05-13price $255,000
-
2024-05-02$260,000 Active
-
2022-02-28soldstatus $220,000
-
2022-02-18soldstatus $220,000 Closed
-
2022-01-04status Pending
-
2022-01-03$220,000 Active
-
2021-07-26soldstatus $207,000
-
2021-07-22soldstatus $207,000 Closed
-
2021-05-16status Pending
-
2021-05-10$219,900 Active
-
1999-10-25soldstatus $42,000
ⓘ Source: listings_history table (triggers on properties + properties_extension) + one-shot
backfill from property_details.listing_events for pre-trigger history.
Tax reassessment forecast OK · Resets to sale price
- Current annual tax
- $1,965 · $164/mo
- Projected year-2 tax
- $2,106 · $176/mo
- Expected delta
- +$141/yr (+$12/mo · 7.2%)
ⓘ Screening estimate from a state-policy table — verify with the county assessor before closing.
Climate risk First Street
- Flood 1/10 Low FEMA zone X · 0% chance over 30 yrs
- Wildfire 6/10 Major
- Heat 6/10 Major 7 d/yr ≥109°F today · 20 d/yr by 30 yrs out
- Wind 4/10 Moderate 16% chance of damaging wind over 30 yrs
- Air quality 3/10 Moderate 3 unhealthy d/yr today · 3 by 30 yrs out
Nearby sold comps map
Loading sold comps map…
Walkable amenities ~0.75 mi
Loading nearby amenities…
Taxation est. · year 1
- Rental income
- $27,601
- − Mortgage interest
- −$13,108
- − Property taxes
- −$1,965
- − Insurance
- −$1,170
- − Repairs & maintenance
- −$2,208
- − Management
- −$2,208
- − Depreciation
- −$6,807
- Taxable income
- $135
- Est. tax owed @ 24.0%
- −$32
- After-tax cash flow
- $3,912/yr
For passive investors: Depreciation is non-cash, so a rental often shows a tax loss while cash-flowing — sheltering income. Rental losses are passive: they offset passive income freely, and up to $25,000/yr can offset ordinary (W-2) income if you actively participate and your MAGI is under $100k (phasing out to $0 by $150k); unused losses carry forward. On sale, claimed depreciation is recaptured at up to 25%, and gains may owe capital-gains tax (a 1031 exchange can defer both). Figures are a year-1 estimate at your 24.0% rate — not tax advice; consult a CPA.
Schools (NCES district)
- District
- Kingston
- NCES district ID
- 4016590
- Math proficiency
- 27% ▼ -7.00%
- Reading proficiency
- 32% ▼ -7.00%
- Median HH income
- $40,655
- Composite
- 24.88/100
- National rank
- #7585
- State rank
- #70 of 270 in OK
Livability — Kingston
- Score
- 62/100
- State rank
- #251
- US rank
- #16664
Category grades
Schools grade is shown separately in the Schools card above.
Census & demographics
- Census place
- Kingston, OK
- Population (ZIP)
- 7,011
Population outlook (Marshall County) Hauer SSP2
- Today (2025)
- 17,405 people
- By 2030
- 18,038 · +3.6%
- By 2040
- 19,513 · +12.1%
- By 2050
- 21,283 · +22.3%
- By 2075
- 27,884 · +60.2%
- By 2100
- 35,435 · +103.6%
Race, ethnicity, and origin ACS 2023
- Neighborhood character
- Predominantly White (75%)
- Race & ethnicity
- White 75% Two or more races 16% Native American 5% Hispanic / Latino 4%
- Common ancestry
- Lithuanian 3% Italian 2% Serbian 1%
- Foreign-born
- 1% · Canada
- Languages at home
- 97% English-only · Spanish 3%
Political lean MEDSL · Marshall
- 2024 margin
- Solid R (+63.4) · D 17.7% · R 81.2% · Other 1.1%
- 2008→2024 swing
- -24.6pp toward R · 2008: -38.8pp · 2024: -63.4pp
- All cycles
- 2024: R+63.4 2020: R+62.5 2016: R+56.6 2012: R+45.7 2008: R+38.8
Not yet ingested
- Civics
- —
Market trends
- HPI YoY
- ▲ 26.96%
- Current HPI
- 246.2253
- Rent YoY
- —
- Metro
- —
- State GDP YoY
- ▲ 1.55%
- F500 in state
- 6
Industry mix (Fortune 500 HQ in OK)
| Industry | F500 HQs | Revenue |
|---|---|---|
| Energy | 3 | $48B |
|
||
Price history
+469.0% since first listed21 events — show timeline
- 2026-04-23 Listed $239,000 MLS Technology, Inc.
- 2025-05-02 Listing Removed — MLS Technology, Inc.
- 2025-03-12 Price Changed $235,000 MLS Technology, Inc.
- 2024-11-02 Listing Removed — MLS Technology, Inc.
- 2024-11-02 Listed $250,000 MLS Technology, Inc.
- 2024-10-07 Relisted — MLS Technology, Inc.
- 2024-10-07 Price Changed $250,000 MLS Technology, Inc.
- 2024-09-20 Listing Removed — MLS Technology, Inc.
- 2024-07-09 Price Changed $235,000 MLS Technology, Inc.
- 2024-05-21 Price Changed $245,000 MLS Technology, Inc.
- 2024-05-13 Price Changed $255,000 MLS Technology, Inc.
- 2024-05-02 Listed $260,000 MLS Technology, Inc.
- 2022-02-28 Sold (Public Records) $220,000 Public Records
- 2022-02-18 Sold (MLS) $220,000 MLS Technology, Inc.
- 2022-01-04 Pending — MLS Technology, Inc.
- 2022-01-03 Listed $220,000 MLS Technology, Inc.
- 2021-07-26 Sold (Public Records) $207,000 Public Records
- 2021-07-22 Sold (MLS) $207,000 MLS Technology, Inc.
- 2021-05-16 Pending — MLS Technology, Inc.
- 2021-05-10 Listed $219,900 MLS Technology, Inc.
- 1999-10-25 Sold (Public Records) $42,000 Public Records
Property tax history
+14.7%/yrLatest (2025): $1,965 · -4.4% YoY. Source: county tax records.
Cash-flow waterfall
monthlySold comps — $/sqft
last 12 mo · ≤1 miLoading sold comps…