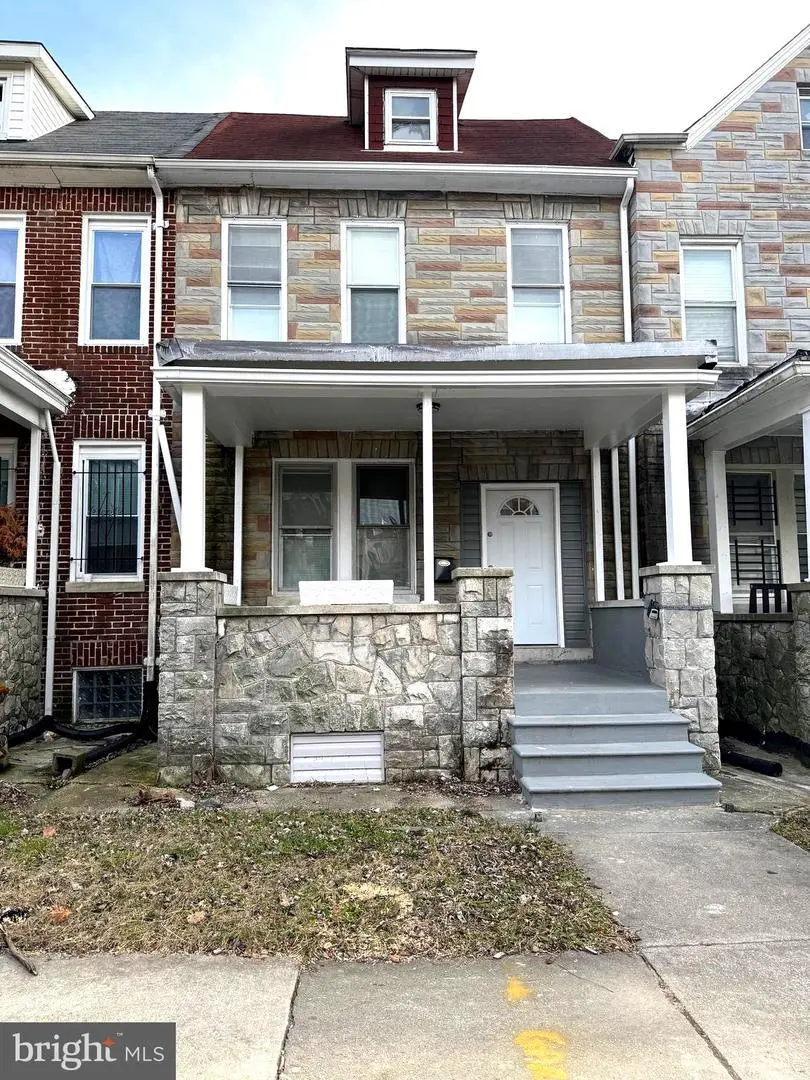
2213 Bryant Ave · Baltimore, MD
Flood risk 1/10 · Minimal
- FEMA flood zone
- X (unshaded)
- Chance of flooding over 30 yrs
- 0.0%
- Est. flood insurance / yr
- $473 – $860
Fire risk 1/10 · Minimal
- Est. fire insurance / yr
- $755 – $1,403
Heat risk 7/10 · Major
- Hot days now (above 103°F)
- 7 days/yr
- Hot days in 30 yrs
- 15 days/yr
Wind risk 6/10 · Moderate
- Chance of severe wind over 30 yrs
- 27.0%
Air-quality risk 4/10 · Minor
- Unhealthy air days now
- 6 days/yr
- Unhealthy air days in 30 yrs
- 7 days/yr
Risk factors via First Street. Map © Google.
Why this score? — see what drove the C- grade
The composite is a weighted blend of 9 inputs, each scored 0–100. Each bar is that input's sub-score; the figure is the points it added to the 100-point composite (weight × sub-score).
- Cash flow +26.1/30.0
- DSCR +8.8/10.0
- 1% rule +5.7/10.0
- Rent growth +4.2/5.0
- Livability +3.8/5.0
- Condition / age +2.5/5.0
- Schools +1.0/10.0
- ARV discount +0.0/15.0
- Appreciation +0.0/10.0
$190,000
🖨 Deal sheet 📄 Offer letter ✓ Due diligence
Listing remarks MLS
Welcome to your very own slice of the city of Baltimore, Maryland at 2213 Bryant Ave in the Woodbrook subdivision. This 4-bedroom townhouse has a loft that can be counted as a bedroom number 5, with a functioning half bath that can be converted to full bathroom in the basement: it’s home base for your weekend treks through Druid Hill Park and morning coffee at the Rawlings Conservatory. With 1,400+ sq. ft. of space, it’s got the bones of a classic 1920s townhouse but the feel of a modern industrial masterpiece. Come for the brick soul, stay for the five-minute commute to MICA or the Zoo and experience the charisma and city charm.
Key facts
- Built 1920
- Listed 33 days
Neighborhood map
What this means for you Summary
Snapshot
- This is a 5-bed/1.0-bath townhouse listed at $190k.
Deal economics
- At list price, monthly cash flow is $478 ($6k/yr) — positive.
- The deal already cash-flows at list — no discount required.
- Meets the 1% rule at list price ($2k rent vs $190k).
- Recommended offer: $184k (3.0% below list) — sets the bar for market timing.
- Cap rate 9.3% vs local median 6.0% in Baltimore — top-decile yield for the area; either an underpriced asset or a hidden risk that comps aren't pricing in. Stress-test before assuming the spread holds.
Location & tenants
- Location reads 76/100 on livability (#90 in MD, #3,396 nationally) — a middle-class / working-renter tenant base. Strengths: amenities A+, commute A+, housing A+; Watch: schools D, crime F.
- Baltimore City Public Schools (urban): math 7% / reading 16% proficiency, ranked #24 of 24 in MD (top 100%) — low school quality limits family demand, transient renter base, plan for 1-2y turnover; 79% free/reduced lunch — lower-income household profile, screen leases tightly.
- Market conditions: Rents rising fast (+6.6%/yr); 331 active listings in the ZIP; 18 comparable units currently listed for rent nearby; rentals at typical pace (median 24d on market — plan ~3-4 weeks tenant-placement turnaround); lower-income renter base — watch delinquency; 1,273 units permitted in Baltimore city in 2024 (1,104 in 5+ unit buildings).
- At $2,042/mo this rent would consume 64% of the median local household income ($38k/yr) (locally 2921% of renters already pay >50% of income on rent) — very limited rent-growth headroom before tenants either downsize or default.
Forward outlook
- Local home prices are declining (-3.0%/yr); year-one equity from $1k of loan paydown is wiped out by about $6k of value loss. Plan a longer hold.
- Baltimore County population projected to shrink 4% by 2050 — rents likely to lag national; underwrite the cash flow, not the appreciation.
- At projected returns (-3.0% appreciation + 6.6% rent growth), your $53k cash investment doubles in ~8 years — after that, you're playing with house money.
Negotiation context
- It's been on market 33 days — a 3% lower offer ($184k) is reasonable based on typical stale-listing flexibility.
- 4 sale attempts since 22y ago; this cycle's ask has dropped $15k (7%) from the opening price — seller is motivated, your offer sets the floor, not the list.
- Current owner paid $50k; list at $190k implies a 280% gain — meaningful room to come down on a strong offer.
Risks & watch-outs
- Watch-outs: built in 1920 — expect roof / HVAC / electrical / plumbing capex.
- Climate carrying-cost: major wind risk, 27% chance of damaging wind over 30y; extreme-heat days projected 7→15/yr by 2055 (HVAC capex compounding) — expect insurance premiums to compound above CPI over the hold.
Questions for the listing agent
- It's been on market 33 days. Have you received any prior offers? Is the seller open to a 3% concession, seller financing, or rate buy-down credit?
- Built in 1920 — when were the roof, HVAC, electrical panel, plumbing, and water heater last replaced?
- Is there a deadline driving the sale (1031 exchange, divorce, estate, relocation)? That informs how much negotiation room exists.
- Schools are D-rated, which usually means shorter tenancies and higher turnover. Who's the typical renter profile here, and what's been the actual vacancy rate?
- Crime grade is F in this area — have there been break-ins, vandalism, or insurance claims at this property in the last 3 years? What carrier currently insures it and at what premium?
- What's the average days-on-market for RENTAL listings here right now (not sales)? A rising rental-DOM trend means longer vacancies and softer asking-rent achievability than the comps imply.
- What's the recent tenant-quality profile in this submarket — average credit score on applications, eviction rate, late-payment / NSF rate, and stable-employment percentage? A property-management company in the area should have these aggregated.
- How much new for-sale + rental construction is in the pipeline within 1–3 miles? Heavy new supply typically softens prices + rents 12–24 months out; constrained supply supports both.
Investment metrics
- 1% rule
- 1.07% ✓
- Cap rate
- 9.31%
- Cash-on-cash
- 10.77%
- DSCR
- 1.48
- GRM
- 7.8
CMA / ARV
- ARV (median comp)
- $162,937
- List price
- $190,000
- Delta
- 16.61%
- Verdict
- OVERPRICED
- Comps
- 20 within 1.0 mi
Show comp detail 12 sales within ~0.75 mi
| Address | Dist | Beds/Ba | Sqft | Sold | Price | $/sf | Match |
|---|---|---|---|---|---|---|---|
| 2217 Bryant Ave | 0.01mi | 6/2.0 (+1) | 1,416 (+1%) | 2mo | $55,000 | $39 | 88 |
| 2855 Woodbrook Ave | 0.17mi | 4/2.0 (-1) | 1,320 (-6%) | 19mo | $50,000 | $38 | 57 |
| 1722 N Bentalou St | 0.64mi | 4/2.0 (-1) | 1,450 (+3%) | 3mo | $245,000 | $169 | 53 |
| 1940 W North Ave | 0.45mi | 5/3.0 | 1,307 (-7%) | 8mo | $173,000 | $132 | 53 |
| 2505 Woodbrook Ave | 0.41mi | 4/2.0 (-1) | 1,256 (-10%) | 7mo | $11,000 | $9 | 48 |
| 700 Cumberland St | 0.63mi | 4/2.0 (-1) | 1,280 (-9%) | 3mo | $107,800 | $84 | 45 |
| 2009 Ruxton Ave | 0.50mi | 4/2.0 (-1) | 1,600 (+14%) | 1mo | $234,000 | $146 | 44 |
| 1805 N Monroe St N | 0.52mi | 5/2.0 | 1,544 (+10%) | 19mo | $110,000 | $71 | 39 |
| 2402 Presbury St | 0.72mi | 4/2.5 (-1) | 1,440 (+3%) | 15mo | $221,000 | $153 | 38 |
| 3052 Tioga Pkwy | 0.56mi | 4/2.0 (-1) | 1,280 (-9%) | 15mo | $255,000 | $199 | 38 |
| 1716 N Monroe St | 0.57mi | 4/3.0 (-1) | 1,600 (+14%) | 9mo | $190,000 | $119 | 30 |
| 2210 Baker St | 0.72mi | 4/1.5 (-1) | 1,200 (-14%) | 9mo | $85,000 | $71 | 28 |
Match score weights: distance 35% · size 25% · config 20% · recency 20%. Top-matched comps best support the ARV.
Projected returns pro-forma
-3.0% appreciation · 6.63% rent growth · sell at horizon
- IRR
- 3.4%
- Equity multiple
- 1.14×
- Total profit
- $7,279
- Equity at exit
- $28,330
- IRR
- 15.9%
- Equity multiple
- 2.49×
- Total profit
- $79,372
- Equity at exit
- $16,428
Cash invested: $53,200 (down + closing). Projections, not guarantees.
Landlord ↔ Tenant lean methodology
- Overall (CITY)
- 12 Strongly Tenant-Friendly
- State Maryland
- 27 Tenant-Leaning · D+14
- County
- — inherits STATE
- City Baltimore
- 12 Strongly Tenant-Friendly · D+58
ZIP-level market 21217
- Rents YoY
- 6.6%
- Active inventory
- 331
- Price-to-rent
- 7.8×
Monthly cashflow live
- Estimated rent
- $2,042 high interval (Pro) →
- Mortgage (P&I)
- −$996
- Tax from tax record
- −$60 /mo · $723/yr
- Insurance
- −$79
- HOA
- −$0
- Vacancy / Maint / Mgmt
- −$429
- Net cashflow
- $478
Break-even live
UW: 25.0% down · 7.5% · 30yr · 1.5% tax · 5.0% vac · 8.0% maint · 8.0% mgmt
Financing live
Cash to close
- Down payment
- $47,500
- Closing costs
- $5,700
- Reserves months
- —
- Total cash needed
- —
Loan-product check · same deal, 3 products live
Conventional
25% down · 7.5% · 30yr
- Down + closing
- —
- Monthly P&I
- —
- Monthly cashflow
- —
- DSCR
- —
- Eligible?
- —
Personal DTI + credit; lowest rate.
DSCR
20% down · 8.5% · 30yr
- Down + closing
- —
- Monthly P&I
- —
- Monthly cashflow
- —
- DSCR
- —
- Eligible?
- —
No personal income docs; deal must DSCR.
Hard money
10% down · 12.0% · 12mo
- Down + closing
- —
- Monthly P&I
- —
- Monthly cashflow
- —
- DSCR
- —
- Eligible?
- —
Short-term bridge; refi at stabilization.
Rent comps 18 comps
| Address | Beds | Baths | Sqft | Rent | $/sqft | DOM | Units | Dist |
|---|---|---|---|---|---|---|---|---|
| 2201 Whittier Ave Baltimore, MD | 4.0 | 2.0 | 1750 | $1,700 | $0.97 | 18d | 1 | 0.03mi |
| 2201 Whittier Ave Baltimore, MD | 4.0 | 2.0 | 1750 | $1,700 | $0.97 | 43d | 1 | 0.03mi |
| 2216 Whittier Ave Baltimore, MD | 5.0 | 1.5 | 1392 | $1,975 | $1.42 | 24d | 1 | 0.04mi |
| 2505 Woodbrook Ave Baltimore, MD | 4.0 | 2.0 | 1256 | $1,745 | $1.39 | 2d | 1 | 0.39mi |
| 2405 W North Ave Baltimore, MD | 4.0 | 3.0 | 1826 | $1,900 | $1.04 | 4d | 1 | 0.61mi |
| 1315 Presstman St Baltimore, MD | 4.0 | 2.0 | 1700 | $2,000 | $1.18 | 43d | 1 | 0.88mi |
| 2917 Clifton Ave Baltimore, MD | 4.0 | 4.0 | 1700 | $2,150 | $1.26 | 24d | 1 | 1.00mi |
| 1914 Mosher St Unit 1914 Baltimore, MD | 4.0 | 2.5 | 1200 | $1,700 | $1.42 | 43d | 1 | 1.11mi |
| 1402 Poplar Grove St Baltimore, MD | 4.0 | 1.5 | 1540 | $800 | $0.52 | 43d | 1 | 1.24mi |
| 834 N Stricker St Baltimore, MD | 4.0 | 1.0 | 1200 | $1,500 | $1.25 | 20d | 1 | 1.25mi |
| 2303 Calverton Heights Ave Baltimore, MD | 4.0 | 2.0 | 1314 | $2,250 | $1.71 | 24d | 1 | 1.30mi |
| 910 N Arlington Ave Unit 2 Baltimore, MD | 4.0 | 2.0 | 1220 | $1,850 | $1.52 | 24d | 1 | 1.31mi |
| 3204 Sequoia Ave Baltimore, MD | 4.0 | 2.5 | 1791 | $2,600 | $1.45 | 43d | 1 | 1.31mi |
| 3348 Chestnut Ave Baltimore, MD | 4.0 | 3.5 | 1702 | $3,200 | $1.88 | 24d | 1 | 1.35mi |
| 2744 W Mosher St Baltimore, MD | 4.0 | 2.0 | 1412 | $2,100 | $1.49 | 24d | 1 | 1.36mi |
| 305 W 31st St Baltimore, MD | 4.0 | 2.0 | 1500 | $2,499 | $1.67 | 43d | 1 | 1.44mi |
| 1625 Edmondson Ave Unit 1 Baltimore, MD | 4.0 | 3.0 | 1500 | $2,175 | $1.45 | 4d | 1 | 1.47mi |
| 1625 Edmondson Ave Unit 2 Baltimore, MD | 4.0 | 3.0 | 1500 | $1,895 | $1.26 | 12d | 1 | 1.47mi |
Listing history 24 events
-
2026-06-18days on market $190,000 Active 33 DOM
-
2026-06-17days on market $190,000 Active 32 DOM
-
2026-06-16days on market $190,000 Active 31 DOM
-
2026-06-15days on market $190,000 Active 30 DOM
-
2026-06-13days on market $190,000 Active 28 DOM
-
2026-06-09days on market $190,000 Active 24 DOM
-
2026-06-08days on market $190,000 Active 23 DOM
-
2026-06-07days on market $190,000 Active 22 DOM
-
2026-06-04days on market $190,000 Active 19 DOM
-
2026-06-03days on market $190,000 Active 18 DOM
-
2026-06-02days on market $190,000 Active 17 DOM
-
2026-06-01days on market $190,000 Active 16 DOM
-
2026-05-31days on market $190,000 Active 15 DOM
-
2026-05-17$205,000 Active 652-char remark
Show marketing remark (652 chars)
Welcome to your very own slice of the city of Baltimore, Maryland at 2213 Bryant Ave in the Woodbrook subdivision. This 4-bedroom townhouse has a loft that can be counted as a bedroom number 5, with a functioning half bath that can be converted to full bathroom in the basement: it’s home base for your weekend treks through Druid Hill Park and morning coffee at the Rawlings Conservatory. With 1,400+ sq. ft. of space, it’s got the bones of a classic 1920s townhouse but the feel of a modern industrial masterpiece. Come for the brick soul, stay for the five-minute commute to MICA or the Zoo and experience the charisma and city charm.
-
2026-04-09historical $205,000 652-char remark
Show marketing remark (652 chars)
Welcome to your very own slice of the city of Baltimore, Maryland at 2213 Bryant Ave in the Woodbrook subdivision. This 4-bedroom townhouse has a loft that can be counted as a bedroom number 5, with a functioning half bath that can be converted to full bathroom in the basement: it’s home base for your weekend treks through Druid Hill Park and morning coffee at the Rawlings Conservatory. With 1,400+ sq. ft. of space, it’s got the bones of a classic 1920s townhouse but the feel of a modern industrial masterpiece. Come for the brick soul, stay for the five-minute commute to MICA or the Zoo and experience the charisma and city charm.
-
2024-02-16historical $1,300
-
2024-01-13$1,300
-
2022-12-14soldstatus $50,000
-
2022-09-16soldstatus $50,000 Closed 86-char remark
Show marketing remark (86 chars)
The property is in need of full rehab, price to sell. Bring screw gun, and imagination
-
2022-08-30status Pending 86-char remark
Show marketing remark (86 chars)
The property is in need of full rehab, price to sell. Bring screw gun, and imagination
-
2022-08-20$50,000 Active 86-char remark
Show marketing remark (86 chars)
The property is in need of full rehab, price to sell. Bring screw gun, and imagination
-
2020-02-28soldstatus $360,807
-
2004-12-03historical
-
2004-06-08
ⓘ Source: listings_history table (triggers on properties + properties_extension) + one-shot
backfill from property_details.listing_events for pre-trigger history.
Tax reassessment forecast MD · Partial reset (capped growth)
- Current annual tax
- $723 · $60/mo
- Projected year-2 tax
- $1,397 · $116/mo
- Expected delta
- +$674/yr (+$56/mo · 93.1%)
ⓘ Screening estimate from a state-policy table — verify with the county assessor before closing.
Climate risk First Street
- Flood 1/10 Low FEMA zone X (unshaded) · 0% chance over 30 yrs
- Wildfire 1/10 Low
- Heat 7/10 Severe 7 d/yr ≥103°F today · 15 d/yr by 30 yrs out
- Wind 6/10 Major 27% chance of damaging wind over 30 yrs
- Air quality 4/10 Moderate 6 unhealthy d/yr today · 7 by 30 yrs out
Nearby sold comps map
Loading sold comps map…
Walkable amenities ~0.75 mi
Loading nearby amenities…
Taxation est. · year 1
- Rental income
- $24,507
- − Mortgage interest
- −$10,643
- − Property taxes
- −$723
- − Insurance
- −$950
- − Repairs & maintenance
- −$1,961
- − Management
- −$1,961
- − Depreciation
- −$5,527
- Taxable income
- $2,742
- Est. tax owed @ 24.0%
- −$658
- After-tax cash flow
- $5,072/yr
For passive investors: Depreciation is non-cash, so a rental often shows a tax loss while cash-flowing — sheltering income. Rental losses are passive: they offset passive income freely, and up to $25,000/yr can offset ordinary (W-2) income if you actively participate and your MAGI is under $100k (phasing out to $0 by $150k); unused losses carry forward. On sale, claimed depreciation is recaptured at up to 25%, and gains may owe capital-gains tax (a 1031 exchange can defer both). Figures are a year-1 estimate at your 24.0% rate — not tax advice; consult a CPA.
Schools (NCES district)
- District
- Baltimore City Public Schools
- NCES district ID
- 2400090
- Math proficiency
- 7% ▼ -9.00%
- Reading proficiency
- 16% ▼ -5.00%
- Median HH income
- $42,108
- Composite
- 10.08/100
- National rank
- #9805
- State rank
- #24 of 24 in MD
Livability — Baltimore
- Score
- 76/100
- State rank
- #90
- US rank
- #3396
Category grades
Schools grade is shown separately in the Schools card above.
Census & demographics
- Census place
- Baltimore, MD
- County
- Baltimore City · 558,601 people
- City population
- 588,727
- Metro
- Baltimore-Columbia-Towson, MD
- Population (ZIP)
- 30,792
- Household income
- $38,409
- Rent vs Own
- Severe rent burden
- 2921.0
Population outlook (Baltimore County) Hauer SSP2
- Today (2025)
- 624,249 people
- By 2030
- 621,541 · -0.4%
- By 2040
- 609,756 · -2.3%
- By 2050
- 597,249 · -4.3%
- By 2075
- 552,236 · -11.5%
- By 2100
- 513,934 · -17.7%
Race, ethnicity, and origin ACS 2023
- Neighborhood character
- Predominantly Black (81%)
- Race & ethnicity
- Black 81% White 12% Two or more races 4% Hispanic / Latino 2% Asian 2%
- Common ancestry
- Romanian 1% Hispanic 1% Italian 1%
- Foreign-born
- 5% · Canada, China, South Korea
- Languages at home
- 94% English-only · Spanish 2% French/Haitian/Cajun 1% Chinese 1%
Political lean MEDSL · Baltimore
- 2024 margin
- Solid D (+73.0) · D 85.2% · R 12.2% · Other 2.6%
- 2008→2024 swing
- -2.5pp toward R · 2008: 75.5pp · 2024: 73.0pp
- All cycles
- 2024: D+73.0 2020: D+76.6 2016: D+74.6 2012: D+76.4 2008: D+75.5
Not yet ingested
- Civics
- —
Market trends
- HPI YoY
- ▼ -187.20%
- Current HPI
- 104.2102
- Rent YoY
- ▲ 6.63%
- Metro
- Baltimore-Columbia-Towson, MD
- State GDP YoY
- ▲ 2.97%
- F500 in state
- 12
Industry mix (Fortune 500 HQ in MD)
| Industry | F500 HQs | Revenue |
|---|---|---|
| Aerospace / Defense | 1 | $71B |
|
||
| Utilities | 1 | $25B |
|
||
| Hotels | 1 | $24B |
|
||
| Consumer Goods | 1 | $7B |
|
||
| Real Estate | 1 | $6B |
|
||
| Chemicals | 1 | $2B |
|
||
Price history
-43.2% since first listed11 events — show timeline
- 2026-05-17 Listed $205,000 BRIGHT MLS
- 2026-04-09 Coming Soon $205,000 BRIGHT MLS
- 2024-02-16 Rental Removed $1,300 BRIGHTMLS
- 2024-01-13 Listed for Rent $1,300 BRIGHTMLS
- 2022-12-14 Sold (Public Records) $50,000 Public Records
- 2022-09-16 Sold (MLS) $50,000 BRIGHT MLS
- 2022-08-30 Pending — BRIGHT MLS
- 2022-08-20 Listed $50,000 BRIGHT MLS
- 2020-02-28 Sold (Public Records) $360,807 Public Records
- 2004-12-03 Delisted — MRIS
- 2004-06-08 Listed — MRIS
Property tax history
-2.2%/yrLatest (2025): $723 · +0.0% YoY. Source: county tax records.
Cash-flow waterfall
monthlySold comps — $/sqft
last 12 mo · ≤1 miLoading sold comps…