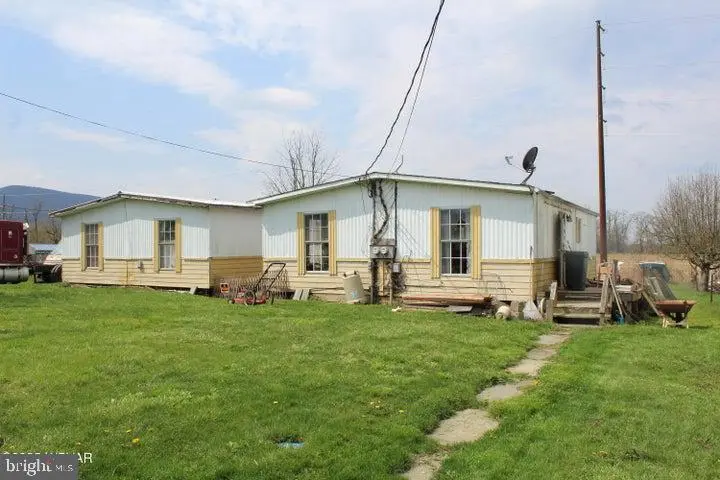
202 Maryland Ave · Pine Creek, PA
Flood risk 7/10 · Major
- FEMA flood zone
- AE
- Chance of flooding over 30 yrs
- 0.76%
- Est. flood insurance / yr
- $1,737 – $8,500
Fire risk 1/10 · Minimal
- Est. fire insurance / yr
- $511 – $949
Heat risk 4/10 · Minor
- Hot days now (above 94°F)
- 8 days/yr
- Hot days in 30 yrs
- 17 days/yr
Wind risk 2/10 · Minimal
- Chance of severe wind over 30 yrs
- 0.0%
Air-quality risk 1/10 · Minimal
- Unhealthy air days now
- 0 days/yr
- Unhealthy air days in 30 yrs
- 0 days/yr
Risk factors via First Street. Map © Google.
Why this score? — see what drove the B- grade
The composite is a weighted blend of 9 inputs, each scored 0–100. Each bar is that input's sub-score; the figure is the points it added to the 100-point composite (weight × sub-score).
- Cash flow +30.0/30.0
- 1% rule +10.0/10.0
- DSCR +10.0/10.0
- ARV discount +7.5/15.0
- Schools +4.3/10.0
- Rent growth +2.5/5.0
- Livability +2.5/5.0
- Condition / age +2.5/5.0
- Appreciation +0.0/10.0
$49,000
🖨 Deal sheet (PDF) 📄 Offer letter ✓ Due diligence
Listing remarks MLS
Two, double wide mobile homes manufactured in 1974. One unit, #202, was rented in 2023, the second unit, #204, is not livable, nor can interior be viewed, extensive Floor damage, no utilities connected in unit 204.. They are identical in layout. Flat lot. Pretty location in South Avis. Collapsed garage on property. Unit 204 is secured, closed off from viewing.
Key facts
- 0.23 acre lot
- Garage
- Built 1974
Neighborhood map
What this means for you Summary
Snapshot
- This is a 2-bed/1.0-bath single-family listed at $49k.
Deal economics
- At list price, monthly cash flow is $-118 ($-1k/yr) — negative.
- To cash-flow at today's rent, offer at most $28k (42.4% below list).
- Meets the 1% rule at list price ($816 rent vs $49k).
- Recommended offer: $28k (42.4% below list) — sets the bar for cash-flow.
Location & tenants
- Location reads: area grade B — affects rentability + tenant quality, not the cash-flow math above.
- Jersey Shore Area SD (town): math 41% / reading 59% proficiency, ranked #179 of 539 in PA (top 33%) — acceptable for families but not a draw, mixed tenant base, ~2y average lease.
- Zoned schools: Avis El Sch (math 67% / reading 72%, grade A-, #151 of 1,518 statewide, top 12%, 192 students, 45% FRL); Jersey Shore Ms (math 28% / reading 55%, grade F, #234 of 512 statewide, top 47%, 470 students, 54% FRL); Jersey Shore Area Shs (math 67% / reading 72%, grade B, #49 of 437 statewide, top 12%, 710 students, 46% FRL).
- Market conditions: 47 active listings in the ZIP; 2 comparable units currently listed for rent nearby; 44 units permitted in Clinton County in 2024 (0 in 5+ unit buildings).
Forward outlook
- Local home prices are declining (-3.0%/yr); year-one equity from $339 of loan paydown is wiped out by about $1k of value loss. Plan a longer hold.
- Clinton County population projected to shrink 5% by 2050 — rents likely to lag national; underwrite the cash flow, not the appreciation.
Negotiation context
- It's been on market 129 days — a 12% lower offer ($43k) is reasonable based on typical stale-listing flexibility.
- 3 sale attempts with the ask held roughly flat each time — persistent listings suggest the price (not the market) is what's stuck; bring a comps-based counter.
- Current owner paid $24k; list at $49k implies a 109% gain — meaningful room to come down on a strong offer.
Risks & watch-outs
- Watch-outs: flood insurance adds $427/mo.
- Climate carrying-cost: in FEMA flood zone AE (mandatory federal flood insurance) — expect insurance premiums to compound above CPI over the hold.
Questions for the listing agent
- What do current leases actually rent for vs. the listed asking? Can we see a recent rent roll and the last 12 months of T-12 income?
- It's been on market 129 days. Have you received any prior offers? Is the seller open to a 42% concession, seller financing, or rate buy-down credit?
- Built in 1974 — when were the roof, HVAC, electrical panel, plumbing, and water heater last replaced?
- What's the actual annual flood-insurance premium (NFIP or private), and is the property in a SFHA with mandatory coverage?
- Why hasn't it sold? Are there any deal-killer items the seller is aware of (foundation, flood, title, zoning, code violations)?
- Is there a deadline driving the sale (1031 exchange, divorce, estate, relocation)? That informs how much negotiation room exists.
- What's the average days-on-market for RENTAL listings here right now (not sales)? A rising rental-DOM trend means longer vacancies and softer asking-rent achievability than the comps imply.
- What's the recent tenant-quality profile in this submarket — average credit score on applications, eviction rate, late-payment / NSF rate, and stable-employment percentage? A property-management company in the area should have these aggregated.
- How much new for-sale + rental construction is in the pipeline within 1–3 miles? Heavy new supply typically softens prices + rents 12–24 months out; constrained supply supports both.
Investment metrics
- 1% rule
- 1.67% ✓
- Cap rate
- 13.86%
- Cash-on-cash
- 27.03%
- DSCR
- 2.20
- GRM
- 5.0
CMA / ARV
- ARV (median comp)
- $111,908
- List price
- $49,000
- Delta
- -56.21%
- Verdict
- UNDERPRICED
- Comps
- 4 within 1.0 mi
Show comp detail 1 sale within ~0.75 mi
| Address | Dist | Beds/Ba | Sqft | Sold | Price | $/sf | Match |
|---|---|---|---|---|---|---|---|
| 756 Fourth St | 0.71mi | 2/1.0 | 660 (-10%) | 14mo | $50,000 | $76 | 38 |
Match score weights: distance 35% · size 25% · config 20% · recency 20%. Top-matched comps best support the ARV.
Projected returns pro-forma
-3.0% appreciation · 3.0% rent growth · sell at horizon
- IRR
- -33.8%
- Equity multiple
- -0.10×
- Total profit
- $-15,154
- Equity at exit
- $7,306
- IRR
- -37.2%
- Equity multiple
- -0.58×
- Total profit
- $-21,727
- Equity at exit
- $4,237
Cash invested: $13,720 (down + closing). Projections, not guarantees.
Landlord ↔ Tenant lean methodology
- Overall (STATE)
- 62 Landlord-Friendly
- State Pennsylvania
- 62 Landlord-Friendly · EVEN
- County
- — inherits STATE
- City
- — inherits STATE
ZIP-level market 17740
- Home prices YoY
- -7.6%
- Active inventory
- 47
- Price-to-rent
- 5.0×
Monthly cashflow live
- Estimated rent
- $816 medium interval (Pro) →
- Mortgage (P&I)
- −$257
- Tax from tax record
- −$59 /mo · $703/yr
- Insurance
- −$20
- Flood insurance flood zone
- −$427 /mo · $5,118/yr
- HOA
- −$0
- Vacancy / Maint / Mgmt
- −$171
- Net cashflow
- $-118
Break-even live
Sensitivity live
| Price | -10% $-90 | -5% $-104 | +0% $-118 | +5% $-131 | +10% $-145 |
|---|---|---|---|---|---|
| Rent | -10% $-182 | -5% $-150 | +0% $-118 | +5% $-85 | +10% $-53 |
| Rate | -1.0pp $-93 | -0.5pp $-105 | base $-118 | +0.5pp $-130 | +1.0pp $-143 |
UW: 25.0% down · 7.5% · 30yr · 1.5% tax · 5.0% vac · 8.0% maint · 8.0% mgmt
Financing live
Cash to close
- Down payment
- $12,250
- Closing costs
- $1,470
- Reserves months
- —
- Total cash needed
- —
Loan-product check · same deal, 3 products live
Conventional
25% down · 7.5% · 30yr
- Down + closing
- —
- Monthly P&I
- —
- Monthly cashflow
- —
- DSCR
- —
- Eligible?
- —
Personal DTI + credit; lowest rate.
DSCR
20% down · 8.5% · 30yr
- Down + closing
- —
- Monthly P&I
- —
- Monthly cashflow
- —
- DSCR
- —
- Eligible?
- —
No personal income docs; deal must DSCR.
Hard money
10% down · 12.0% · 12mo
- Down + closing
- —
- Monthly P&I
- —
- Monthly cashflow
- —
- DSCR
- —
- Eligible?
- —
Short-term bridge; refi at stabilization.
Rent comps 2 comps
| Address | Beds | Baths | Sqft | Rent | $/sqft | DOM | Units | Dist |
|---|---|---|---|---|---|---|---|---|
| 601 Shaw St Apt 7 Avis, PA | 1.0 | 1.0 | 500 | $675 | $1.35 | 45d | 1 | 0.62mi |
| 951 4th St Unit 953 Jersey Shore, PA | 2.0 | 1.0 | 655 | $1,000 | $1.53 | 45d | 1 | 1.05mi |
Listing history 21 events
-
2026-06-21days on market $49,000 Active 129 DOM
-
2026-06-19days on market $49,000 Active 127 DOM
-
2026-06-18days on market $49,000 Active 126 DOM
-
2026-06-17days on market $49,000 Active 125 DOM
-
2026-06-16days on market $49,000 Active 124 DOM
-
2026-06-15days on market $49,000 Active 123 DOM
-
2026-06-14days on market $49,000 Active 121 DOM
-
2026-06-12days on market $49,000 Active 120 DOM
-
2026-06-09days on market $49,000 Active 117 DOM
-
2026-06-08days on market $49,000 Active 116 DOM
-
2026-06-07days on market $49,000 Active 115 DOM
-
2026-06-04days on market $49,000 Active 111 DOM
-
2026-06-02days on market $49,000 Active 110 DOM
-
2026-06-01days on market $49,000 Active 109 DOM
-
2026-05-31days on market $49,000 Active 108 DOM
-
2026-05-31days on market $49,000 Active 107 DOM
-
2026-02-12$49,000 Active 362-char remark
Show marketing remark (362 chars)
Two, double wide mobile homes manufactured in 1974. One unit, #202, was rented in 2023, the second unit, #204, is not livable, nor can interior be viewed, extensive Floor damage, no utilities connected in unit 204.. They are identical in layout. Flat lot. Pretty location in South Avis. Collapsed garage on property. Unit 204 is secured, closed off from viewing.
-
2026-01-15status Active 362-char remark
Show marketing remark (362 chars)
Two, double wide mobile homes manufactured in 1974. One unit, #202, was rented in 2023, the second unit, #204, is not livable, nor can interior be viewed, extensive Floor damage, no utilities connected in unit 204.. They are identical in layout. Flat lot. Pretty location in South Avis. Collapsed garage on property. Unit 204 is secured, closed off from viewing.
-
2026-01-01historical 362-char remark
Show marketing remark (362 chars)
Two, double wide mobile homes manufactured in 1974. One unit, #202, was rented in 2023, the second unit, #204, is not livable, nor can interior be viewed, extensive Floor damage, no utilities connected in unit 204.. They are identical in layout. Flat lot. Pretty location in South Avis. Collapsed garage on property. Unit 204 is secured, closed off from viewing.
-
2025-08-01$49,000 Active 362-char remark
Show marketing remark (362 chars)
Two, double wide mobile homes manufactured in 1974. One unit, #202, was rented in 2023, the second unit, #204, is not livable, nor can interior be viewed, extensive Floor damage, no utilities connected in unit 204.. They are identical in layout. Flat lot. Pretty location in South Avis. Collapsed garage on property. Unit 204 is secured, closed off from viewing.
-
1995-04-01soldstatus $23,500
ⓘ Source: listings_history table (triggers on properties + properties_extension) + one-shot
backfill from property_details.listing_events for pre-trigger history.
Tax reassessment forecast PA · Partial reset (capped growth)
- Current annual tax
- $703 · $59/mo
- Projected year-2 tax
- $738 · $62/mo
- Expected delta
- +$36/yr (+$3/mo · 5.1%)
ⓘ Screening estimate from a state-policy table — verify with the county assessor before closing.
Climate risk First Street
- Flood 7/10 Severe FEMA zone AE · 76% chance over 30 yrs
- Wildfire 1/10 Low
- Heat 4/10 Moderate 8 d/yr ≥94°F today · 17 d/yr by 30 yrs out
- Wind 2/10 Low 0% chance of damaging wind over 30 yrs
- Air quality 1/10 Low 0 unhealthy d/yr today · 0 by 30 yrs out
Nearby sold comps map
Loading sold comps map…
Walkable amenities ~0.75 mi
Loading nearby amenities…
Taxation est. · year 1
- Rental income
- $9,796
- − Mortgage interest
- −$2,745
- − Property taxes
- −$703
- − Insurance
- −$5,364
- − Repairs & maintenance
- −$784
- − Management
- −$784
- − Depreciation
- −$1,425
- Taxable loss
- −$2,007
- Est. tax savings @ 24.0%
- +$482
- After-tax cash flow
- $-929/yr
For passive investors: Depreciation is non-cash, so a rental often shows a tax loss while cash-flowing — sheltering income. Rental losses are passive: they offset passive income freely, and up to $25,000/yr can offset ordinary (W-2) income if you actively participate and your MAGI is under $100k (phasing out to $0 by $150k); unused losses carry forward. On sale, claimed depreciation is recaptured at up to 25%, and gains may owe capital-gains tax (a 1031 exchange can defer both). Figures are a year-1 estimate at your 24.0% rate — not tax advice; consult a CPA.
Schools (NCES district)
- District
- Jersey Shore Area SD
- NCES district ID
- 4212480
- Math proficiency
- 41% ▼ -8.00%
- Reading proficiency
- 59% ▼ -7.00%
- Median HH income
- $50,019
- Composite
- 42.72/100
- National rank
- #3165
- State rank
- #179 of 539 in PA
Livability — Pine Creek
No livability data for this city. (Only ~50 U.S. cities are tracked.)
Census & demographics
- Population (ZIP)
- 11,600
Population outlook (Clinton County) Hauer SSP2
- Today (2025)
- 39,048 people
- By 2030
- 38,812 · -0.6%
- By 2040
- 38,011 · -2.7%
- By 2050
- 36,931 · -5.4%
- By 2075
- 34,077 · -12.7%
- By 2100
- 29,683 · -24.0%
Race, ethnicity, and origin ACS 2023
- Neighborhood character
- Predominantly White (96%)
- Race & ethnicity
- White 96% Two or more races 2%
- Common ancestry
- Romanian 3% Slovak 2% Polish 1%
- Foreign-born
- 1% · Canada
- Languages at home
- 98% English-only · German/W. Germanic 2%
Political lean MEDSL · Clinton
- 2024 margin
- Solid R (+40.9) · D 29.1% · R 70.0%
- 2008→2024 swing
- -38.1pp toward R · 2008: -2.8pp · 2024: -40.9pp
- All cycles
- 2024: R+40.9 2020: R+36.3 2016: R+34.8 2012: R+11.3 2008: R+2.8
Not yet ingested
- Civics
- —
Market trends
- HPI YoY
- ▼ -18.78%
- Current HPI
- 229.4555
- Rent YoY
- —
- Metro
- —
- State GDP YoY
- ▲ 1.68%
- F500 in state
- 34
Industry mix (Fortune 500 HQ in PA)
| Industry | F500 HQs | Revenue |
|---|---|---|
| Healthcare | 2 | $309B |
|
||
| Insurance | 2 | $27B |
|
||
| Telecommunications / Media | 1 | $124B |
|
||
| Industrial Distribution | 1 | $22B |
|
||
| Financial Services | 1 | $20B |
|
||
| Chemicals / Materials | 1 | $18B |
|
||
Price history
+108.5% since first listed5 events — show timeline
- 2026-02-12 Listed $49,000 BRIGHT MLS
- 2026-01-15 Relisted — WBVAR
- 2026-01-01 Delisted — WBVAR
- 2025-08-01 Listed $49,000 WBVAR
- 1995-04-01 Sold (Public Records) $23,500 Public Records
Property tax history
+1.8%/yrLatest (2026): $703 · +0.7% YoY. Source: county tax records.
Cash-flow waterfall
monthlySold comps — $/sqft
last 12 mo · ≤1 miLoading sold comps…